Building effective threat hunting and detection rules in Elastic Security
Learn to create custom detection rules in Elastic Security following real detection use cases.


 Share on Twitter
Share on Twitter

 Share on LinkedIn
Share on LinkedIn

 Share on Facebook
Share on Facebook

 Share by Email
Share by Email

 Print this page
Print
This blog will guide you through creating custom detection rules in Elastic Security, equipping you with best practices for using Elasticsearch Query Language (ES|QL) and Elastic AI Assistant to refine threat detection logic and add crucial context for analysts. You’ll learn how to effectively preview, test, and enhance your rules, ultimately strengthening your security operations.
When do you need custom detection rules?
Detection engineering is about operationalizing threat detection efforts based on available data, knowledge of the threat landscape, and the attack surface of your environment.
The security community has a long history of sharing detection rules and collaborating to strengthen defenses across organizations; Elastic has always participated in these community collaborations. For example, Elastic Security opened its detection rules repository in 2020 and its endpoint behavior protections in 2022. These resources provide access to the rule logic behind our out-of-the-box SIEM detection and endpoint rules even if you are not using our tooling.
While this broad community effort provides robust coverage, you will likely encounter situations where you have detection use cases that are unique to your environment due to custom data sources, specific operational needs, or novel detection ideas. In these cases, you will need to fill coverage gaps by creating your own detections.
We’ll walk through the process of creating custom detections in Elastic Security using the powerful search and security operations functionality it provides. We’ll also show best practices and tips for high-quality detections.
Detection rule creation process
Before we begin, we need to define our focus — for example, the technology we want to detect threats for or an attack scenario we want to detect.
Then, we will follow this process to create and deploy detection rules:
Step 1. Create and refine detection logic
Step 2. Create a rule with detection and response context
Step 3. Preview and test the rule
Step 4. Deploy rule to production
Prerequisite: Define the focus area
Our focus area will be AWS, so let’s walk through a couple examples of threat detections for AWS.
Amazon CloudTrail is an audit logging service that provides a record of nearly every API call made within your AWS environment. CloudTrail events include information about who made the API call (IAM user, role, or service principal), when the call was made, from what location, and what parameters were passed. It is an essential data source for auditing and monitoring AWS operations.
Once ingested, CloudTrail logs provide a massive amount of information for security analysts to sift through. Without meaningful threat hunting queries or detection logic in place, threat actors can blend in with the noise and remain undetected.
Step 1. Create and refine detection logic
When developing detection rules, we prioritize capturing underlying attacker techniques rather than relying solely on static indicators or signatures that can be easily bypassed. Focusing on behavioral patterns that reflect what adversaries are actually doing ensures our detections remain relevant even as tooling evolves. You should always consider how an attacker might evade your rule, such as by altering command-line arguments or abusing trusted processes. At Elastic, we practice what we preach and design our prebuilt rules detection logic to be resilient to such evasions.
We strive to balance precision and coverage by tuning for realistic false positives while avoiding overly narrow logic that might miss variations of the threat. We document known limitations or expected noise clearly in the rule itself as additional context. If our approach generates high-value signals but also produces too many false positives to reliably alert on, we consider implementing it as a threat hunting query instead. This allows analysts to investigate patterns of interest without overwhelming them with alerts.
By taking this thoughtful, technique-focused approach, you can develop effective detections that provide intended coverage while maintaining analyst trust and avoiding alert fatigue.
We’ll go through two examples in the next sections to demonstrate our approach and process. In the first example, we’ll develop a threat hunting query to capture behavior that might not always be indicative of an attack but will certainly give us events that should be further investigated. And in the second example, we’ll move on to a high-fidelity detection that is more indicative of threat behavior and rises to the standard for a true alert.
Scenario 1: Hunt through noisy potential privilege escalation activity
Good quality detections stem from good quality threat research. For example, Elastic Security Labs’ Exploring AWS STS AssumeRoot and Rhino Security’s AWS IAM Privilege Escalation – Methods and Mitigation both describe how attackers can exploit misconfigurations in AWS Identity and Access Management (IAM) to elevate a low-privilege account to full administrative rights.
IAM lets you define who (users, groups, or roles) can authenticate to your AWS account and control exactly what they can do via JSON policy documents. These documents specify which AWS actions are allowed or denied and on which resources. Although IAM is designed to enforce least-privilege access, overly permissive or risky permission combinations can also be abused.
Like all AWS services, CloudTrail records IAM API calls, providing a detailed audit trail of activity. We can query CloudTrail for high-risk IAM API calls as a first step in hunting for potential threats in our environment. Because these API calls can also appear in legitimate administrative workflows, using a threat hunting query rather than an automated detection helps avoid unnecessary alerts while enabling proactive investigation.
Let’s start by querying our CloudTrail datastream for all IAM API calls made over the last 30 days.
event.dataset: “aws.cloudtrail” and event.provider: “iam.amazonaws.com”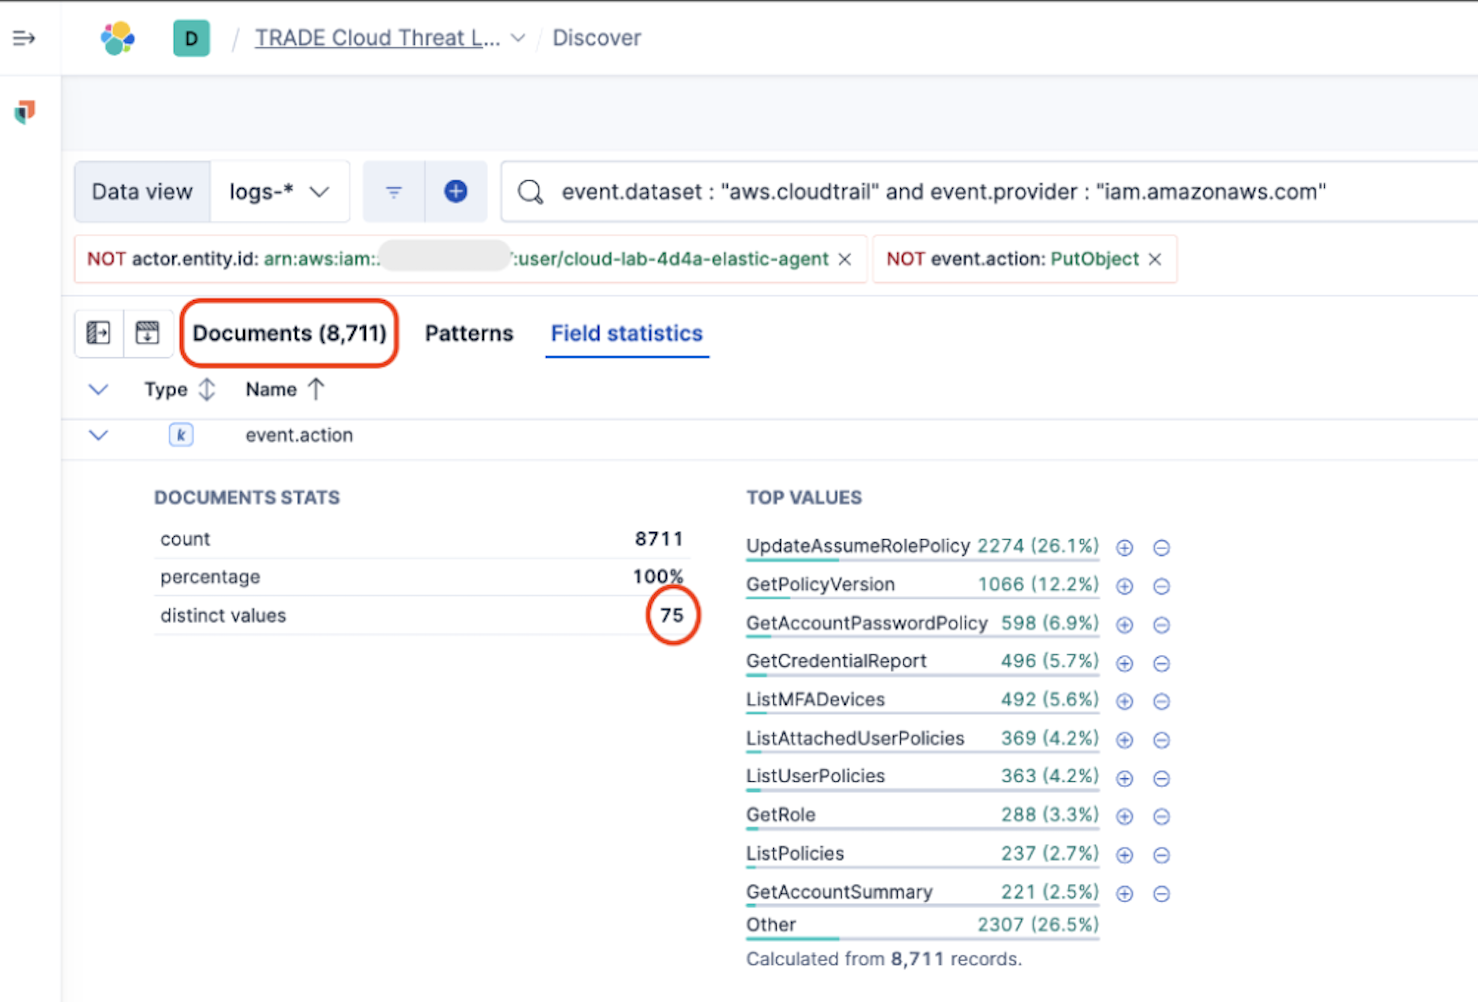
That gives us a good place to start, but even limiting ourselves to IAM service events still leaves a flood of routine, business-as-usual operations. We can narrow our scope even further by using what we learned from the prior research and only include the API calls potentially used for Privilege Escalation, reducing our list to about 21 event.action values to search for.
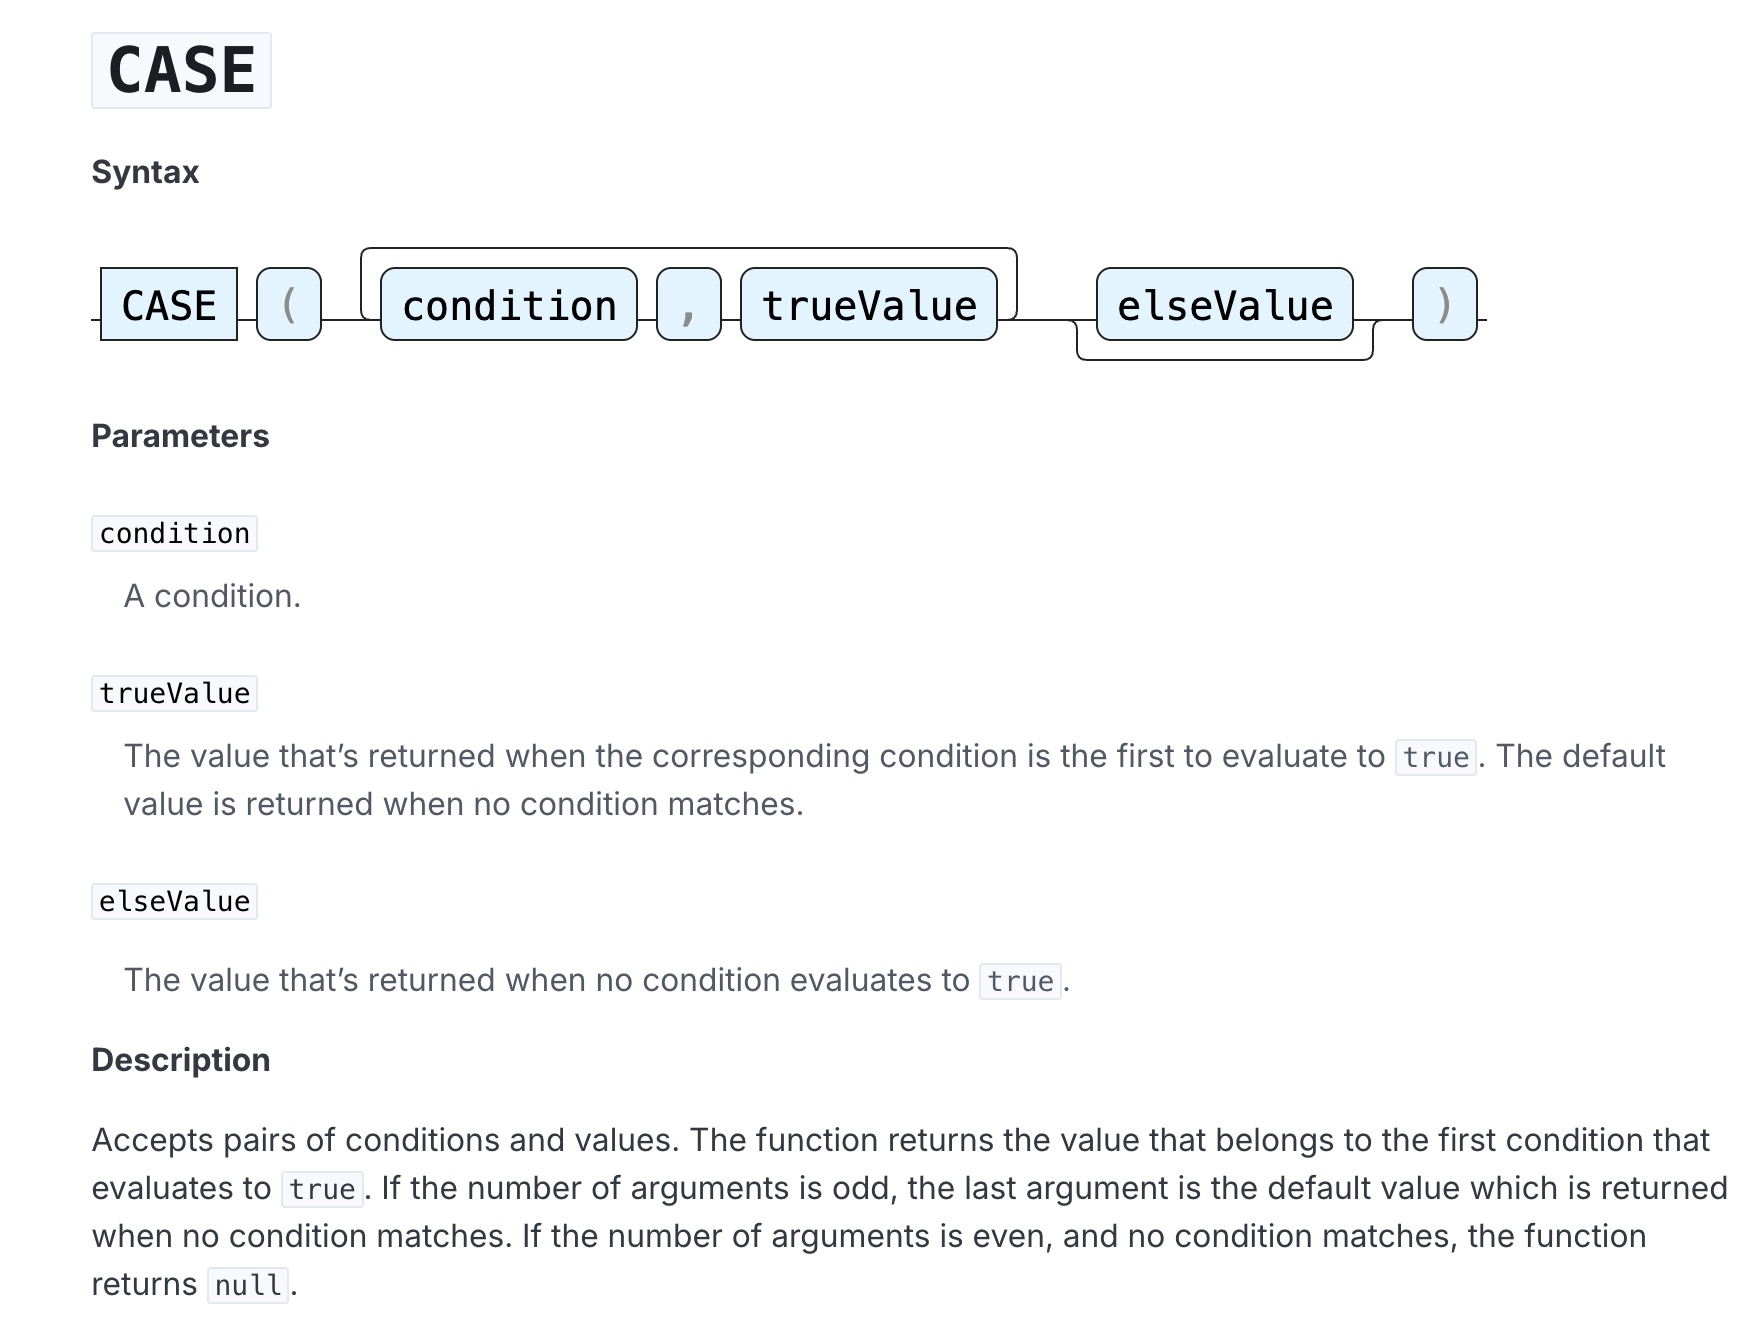
While certainly more manageable, it would be nice to categorize these events in a way that helps us understand and prioritize our detection efforts even more. This is a perfect use case for CASE() function in ES|QL, which allows us to assign separate values to specified conditions.
ES|QL is a piped query language for filtering, transforming, and analyzing data that allows us to create versatile and complex detection logic.
To streamline the query creation process, let’s use the Elastic AI Assistant to help build out an ES|QL query using the CASE() function to categorize our list of API calls into meaningful groups. We want to provide the assistant with enough context, so we’ll use the following prompt:
Can you help me create an ES|QL query for threat hunting against the `logs-aws.cloudtrail*` index? I want to detect various API calls commonly used for privilege escalation mechanisms. I want to use the Case function to categorize these calls based on activity type. These are the event.action values I'd like categorized.
("CreateUser", "AddUserToGroup") - "identity_management" ;
("CreateAccessKey", "UpdateAccessKey", "CreateLoginProfile", "UpdateLoginProfile") - "credential_management";
("CreatePolicy", "PutUserPolicy", "PutRolePolicy", "DeleteRolePolicy", "AttachUserPolicy", "DetachUserPolicy", "AttachRolePolicy", "DetachRolePolicy", "AttachGroupPolicy", "PutGroupPolicy", "CreatePolicyVersion", "SetDefaultPolicyVersion") - "policy_management";
("CreateRole", "DeleteRole", "UpdateAssumeRolePolicy", "PassRole") - "role_management"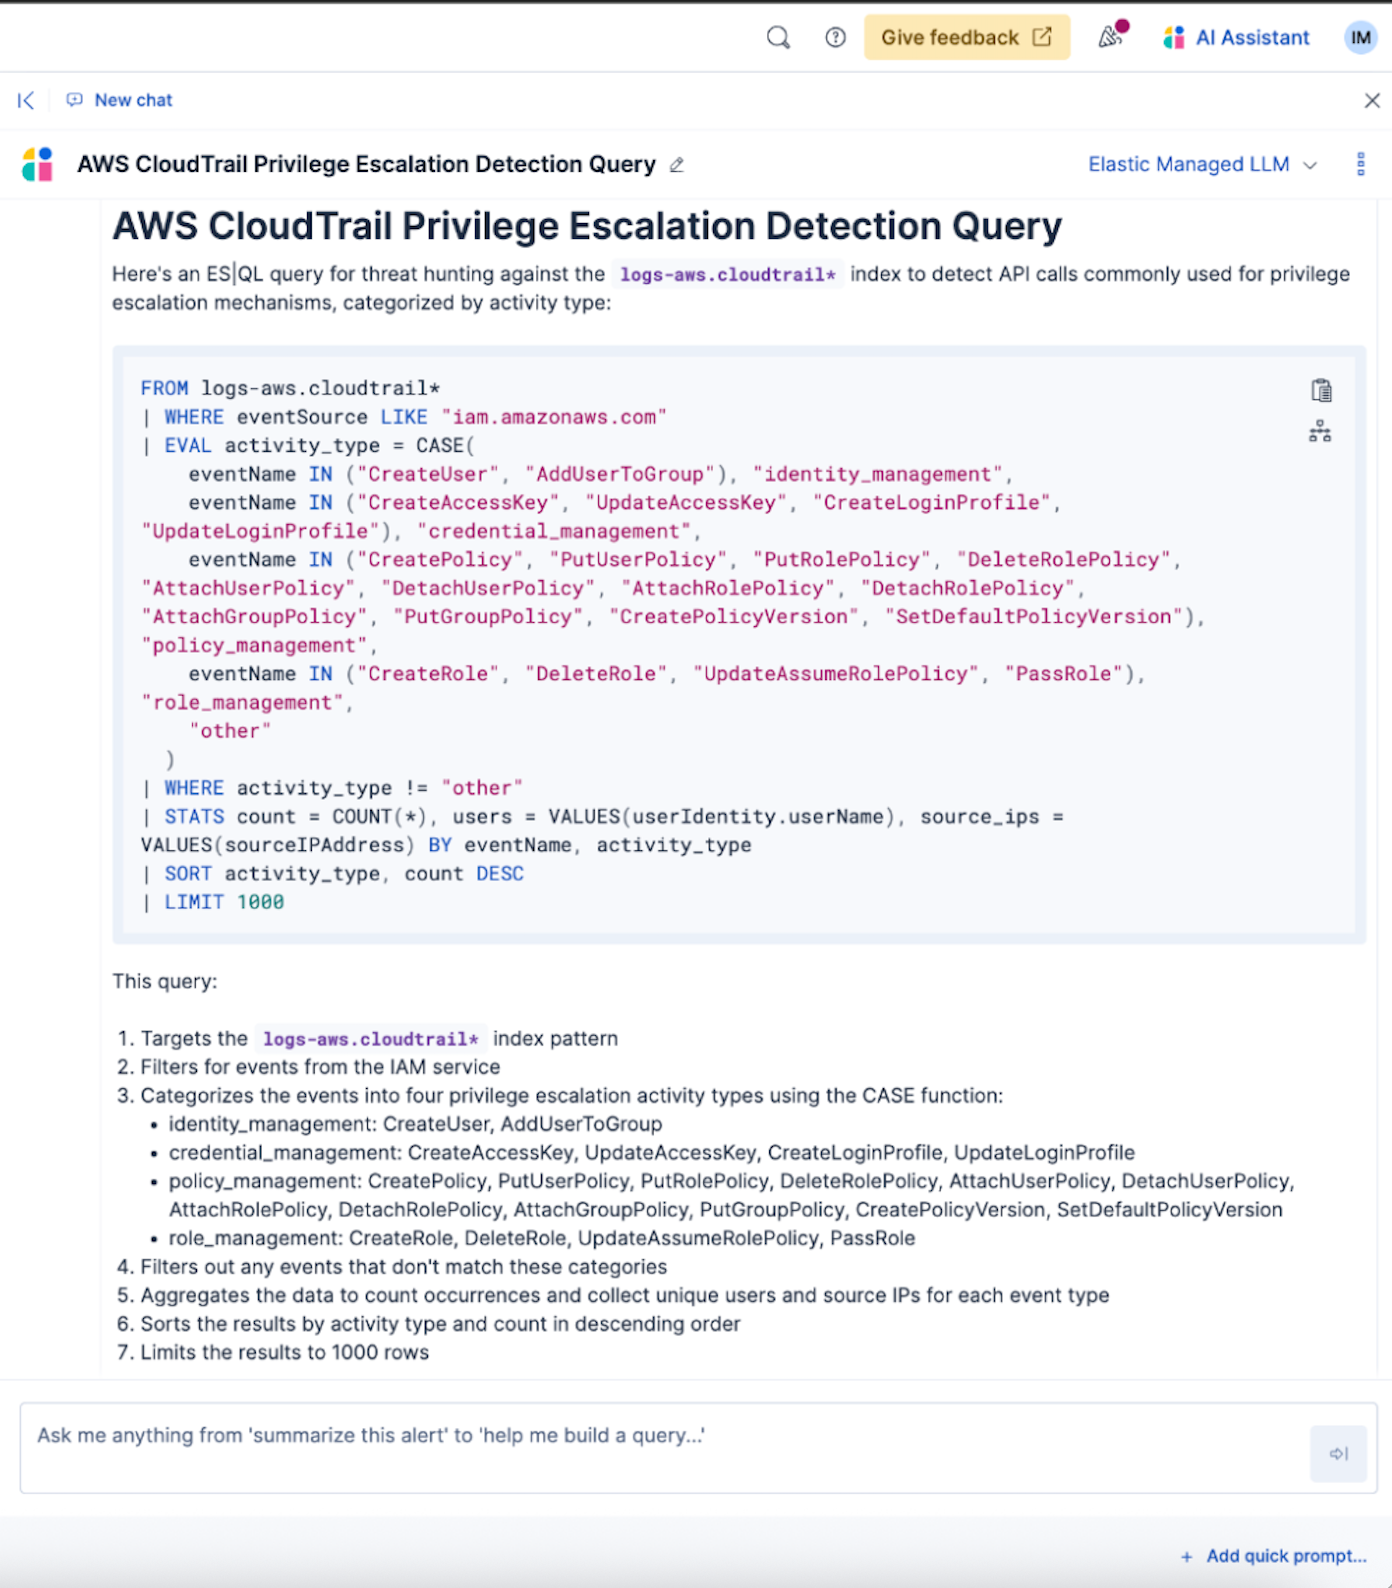
The assistant has given us a great query, which we can continue to tweak to meet our specific needs. We’ll map those suggested query fields to the exact fields in our CloudTrail datastream and layer on any additional detection criteria. In this case, we will only look at successfully executed actions performed by either the Root identity or an AssumedRole. We will also include the identity type in our results and remove source IP address for now (although this can and should be added during further investigation).
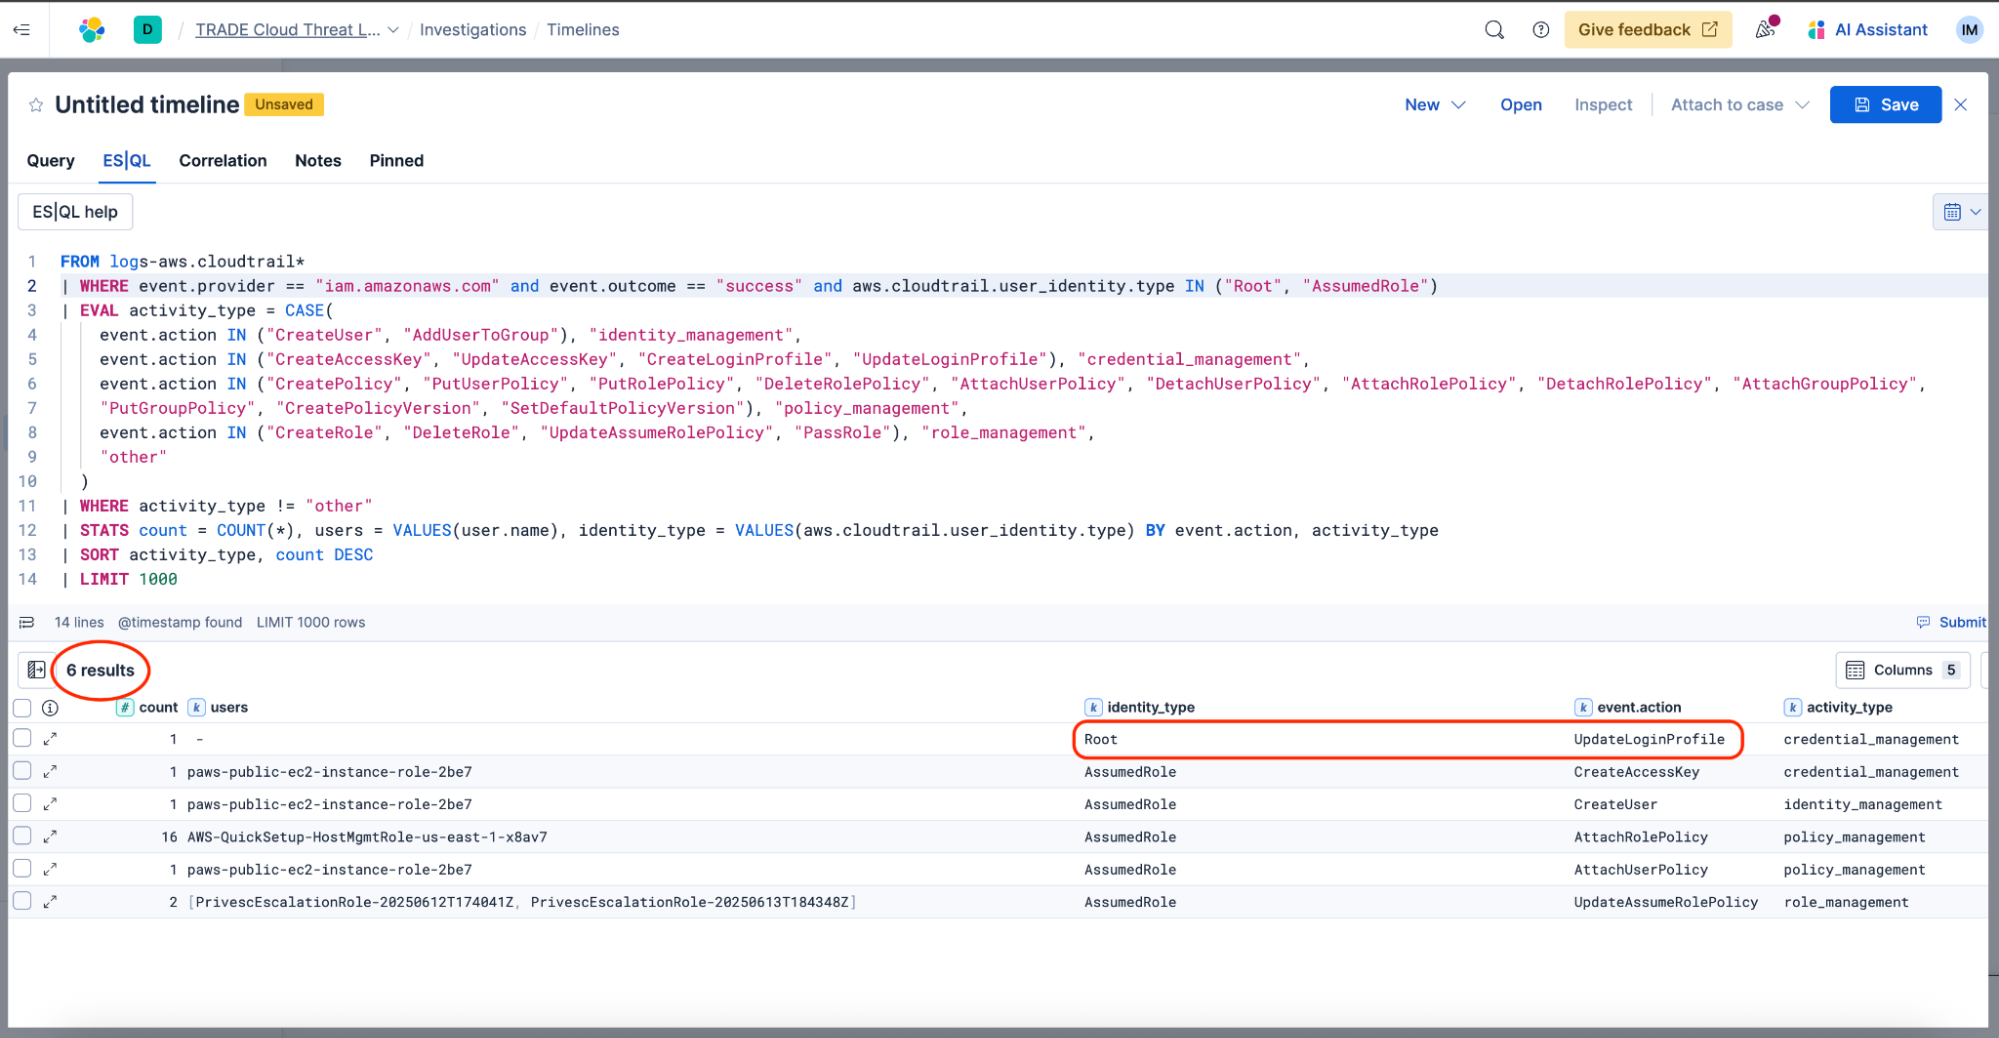
This threat hunting query now serves as a starting point for searching for potential privilege escalation attempts happening in our environment. What began as an unmanageable sea of logs is now filtered down to a handful of potentially suspicious events that we can investigate further. While some of these actions may be part of normal operations, some like modification of the Root login profile might be evidence of attacker behavior. Additional context will be essential for determining true versus false indicators of compromise.
Let’s take a look at another detection use case. One that is more clearly indicative of true positive threat behavior.
Scenario 2: Detect CloudTrail evasion technique
An interesting research article by Permiso “CloudTrail Logging Evasion: Where Policy Size Matters” outlines a defense evasion technique that abuses CloudTrail’s logging size constraints.
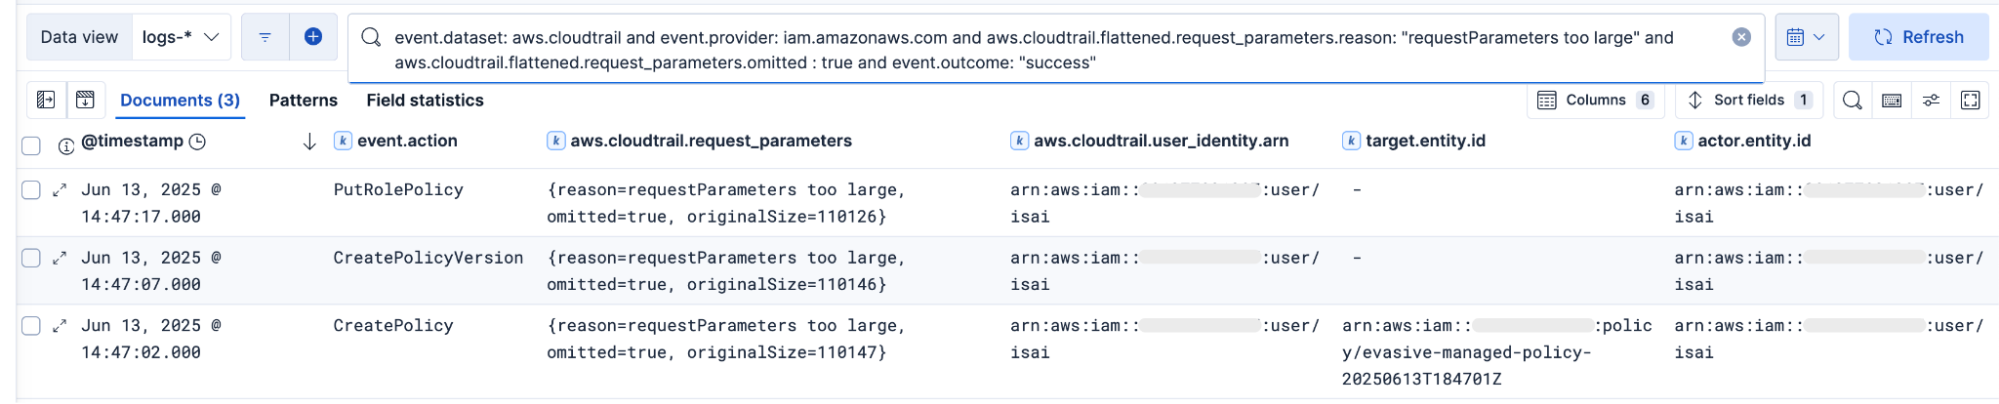
The requestParameters field of a CloudTrail log typically displays IAM policies when they’re created, modified, or attached to an identity. This includes details, such as the policy name and the full policy document content. However, when policies padded with large amounts of insignificant whitespace (spaces, tabs, or line breaks) reach a size range of 102,401 to 131,072 characters, they are omitted from CloudTrail logs and are instead rendered as "requestParameters too large." By exploiting this gap, threat actors can bypass monitoring performed through CloudTrail and can effectively conceal unauthorized permissions changes.
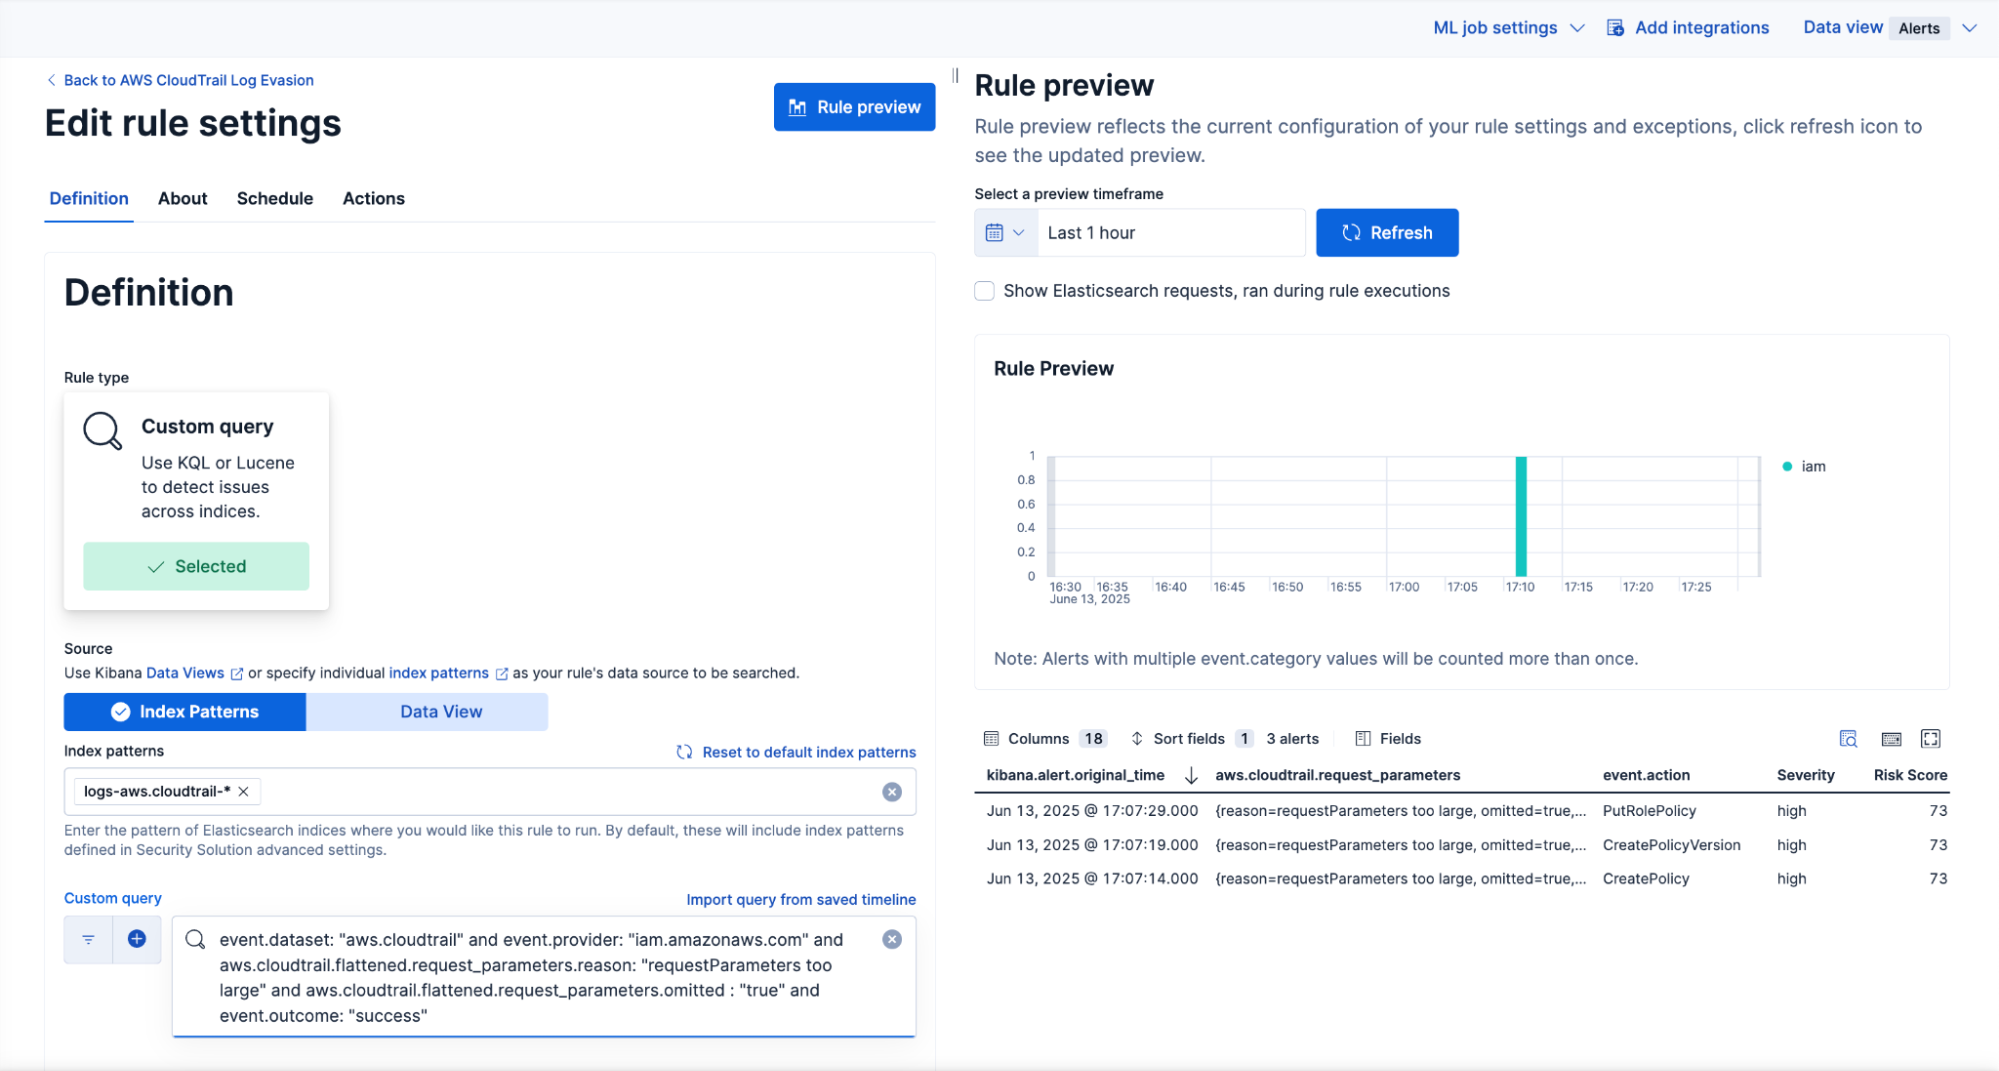
We can detect this behavior by looking for IAM API calls with the requestParameters property containing reason:”requestParameters too large” and omitted:true. This is not a common set of circumstances to expect in normal operations and would almost certainly be an intentional attempt to abuse this gap in CloudTrail logging. We can confidently use this query to create a detection rule, knowing that our analyst will receive a true positive alert indicative of suspicious activity.
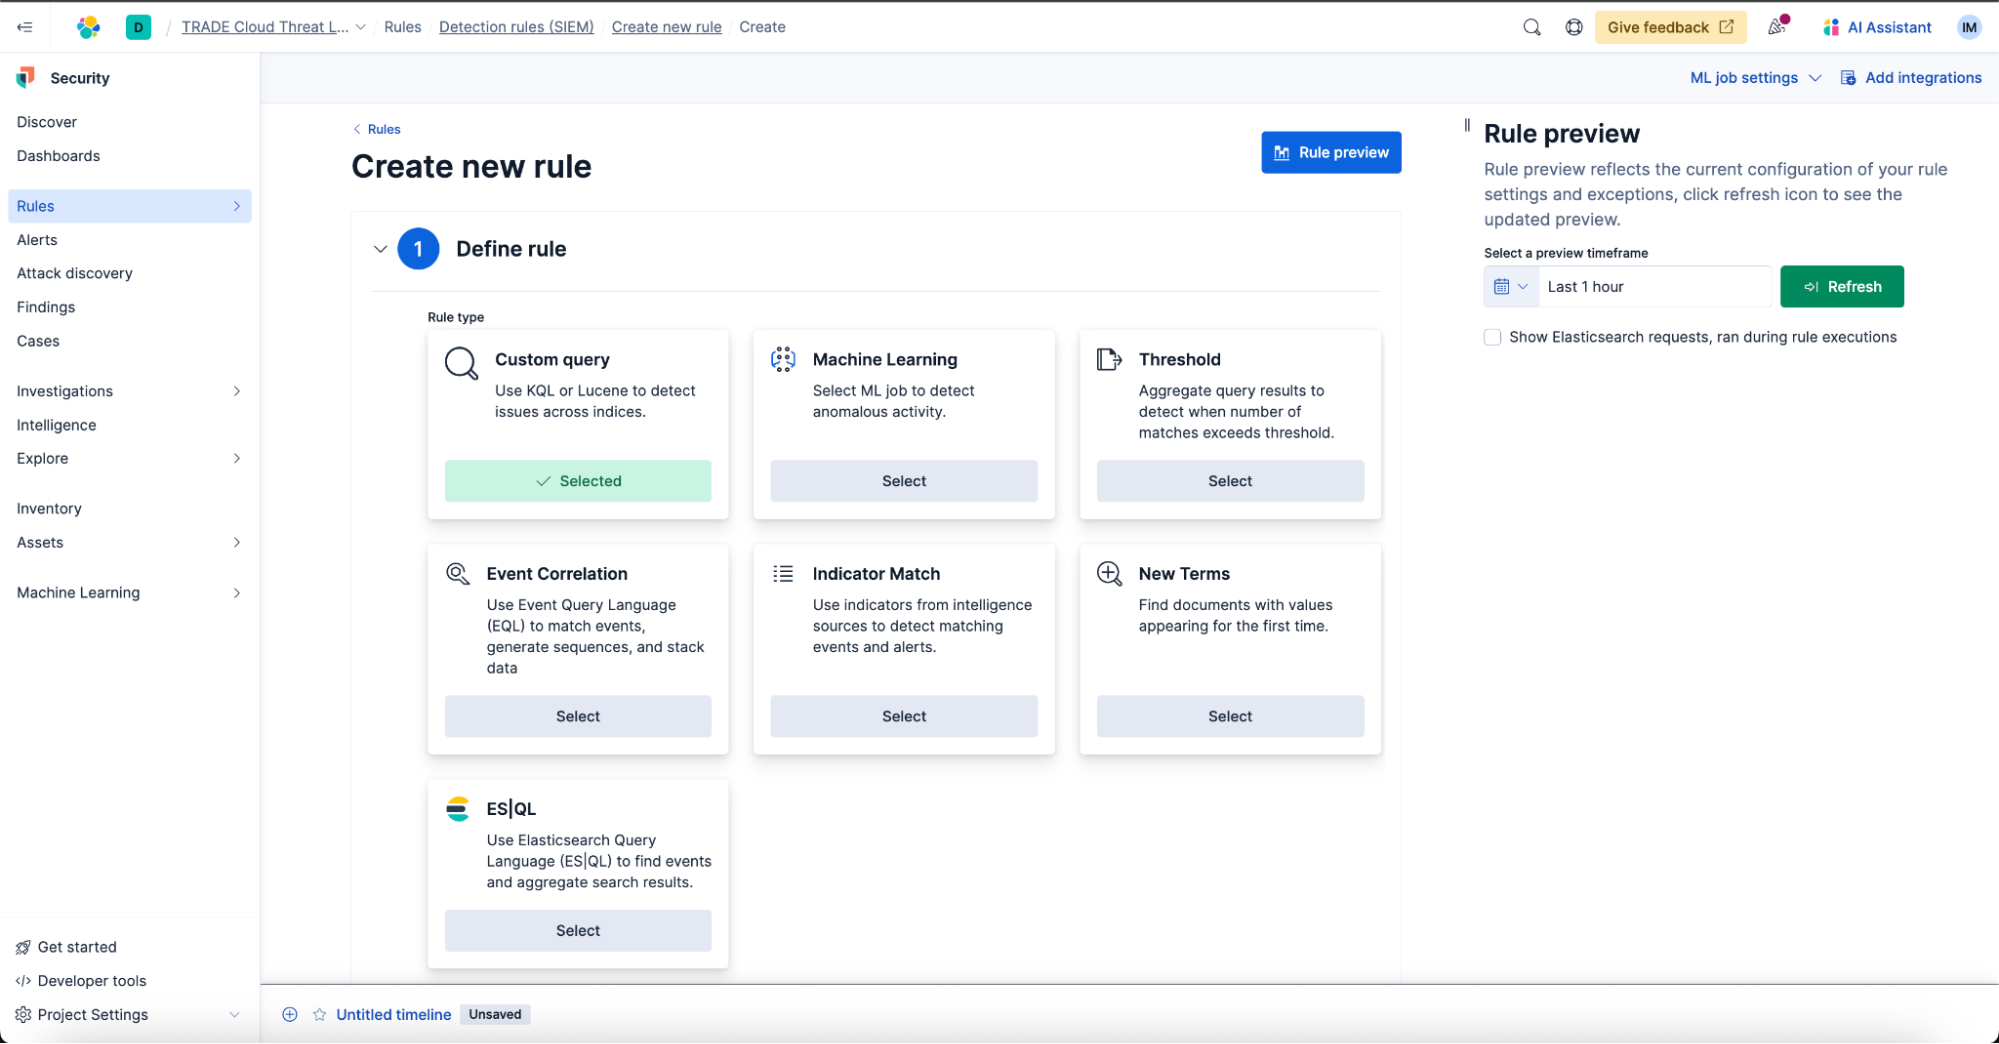
Step 2. Create a rule with relevant context
Depending on the detection method, we’ll select the relevant rule type and specify how often we want the rule to execute. The default setting is to run every five minutes with an additional one minute lookback to account for any logging delays.
For Example 1’s case, we will transfer our threat hunting query to an ES|QL rule that creates building block alerts. Building block alerts are not shown by default in the Alerts table so that it will not distract our analysts from triaging the higher fidelity alerts. Building block alerts can then feed into another rule or be periodically reviewed and investigated in bulk.
Tip! For more information on threat hunting, check out this article. Next to threat hunting queries, Elastic provides a number of building block rules out of the box for more threat hunting use cases.
The rule created from Example 2 will be a custom query detection rule with alerts shown by default in the Alerts table for triage and follow-up investigation. We will continue illustrating further rule creation steps with this rule.
Add detection and response context
Detection rules not only define the detection logic and how often it is executed but also provide crucial context for detection engineers and security analysts.
Here are best practices for rule creation, focused on reducing mean time to respond (MTTR) by providing useful information to analysts:
Name the rule: Capture concisely what the rule will detect.
- Describe the rule: Add a clear description for those unfamiliar with the specific threat or for team members reviewing and tuning the rule.
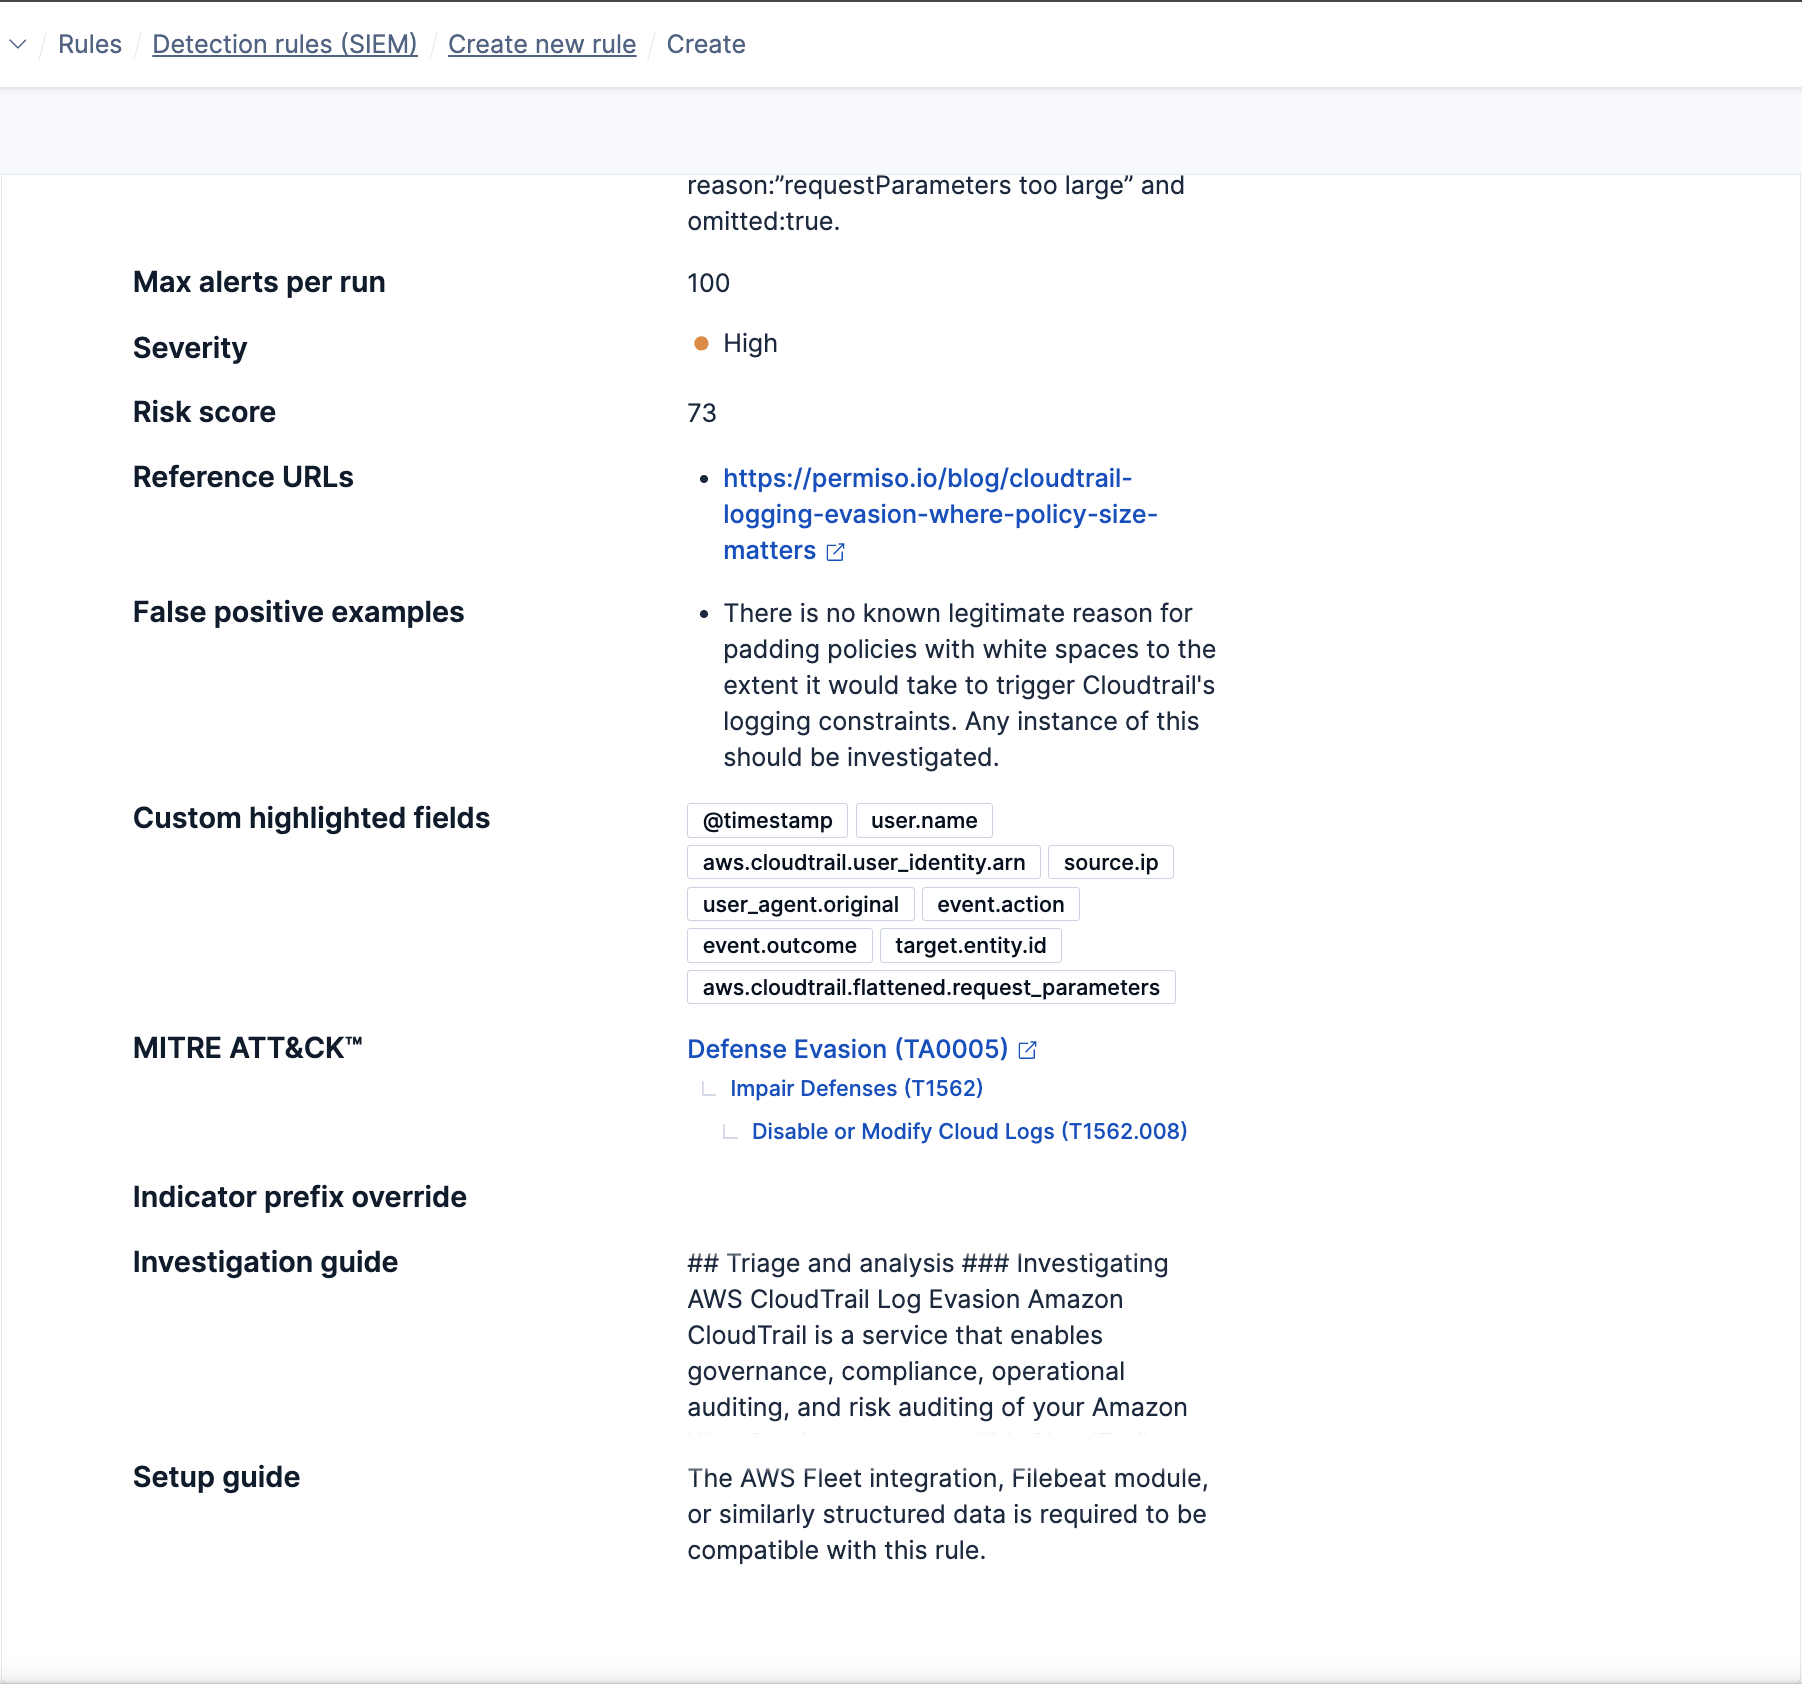
- Apply appropriate severity and risk scores: Help analysts prioritize alerts during triage and influence entity scoring within Elastic Security.
- Map your detection to MITRE ATT&CK®: Track and maintain detection coverage, and easily find similar detections.
- Add custom highlighted fields: Ensure security analysts have relevant context readily available when reviewing an alert.
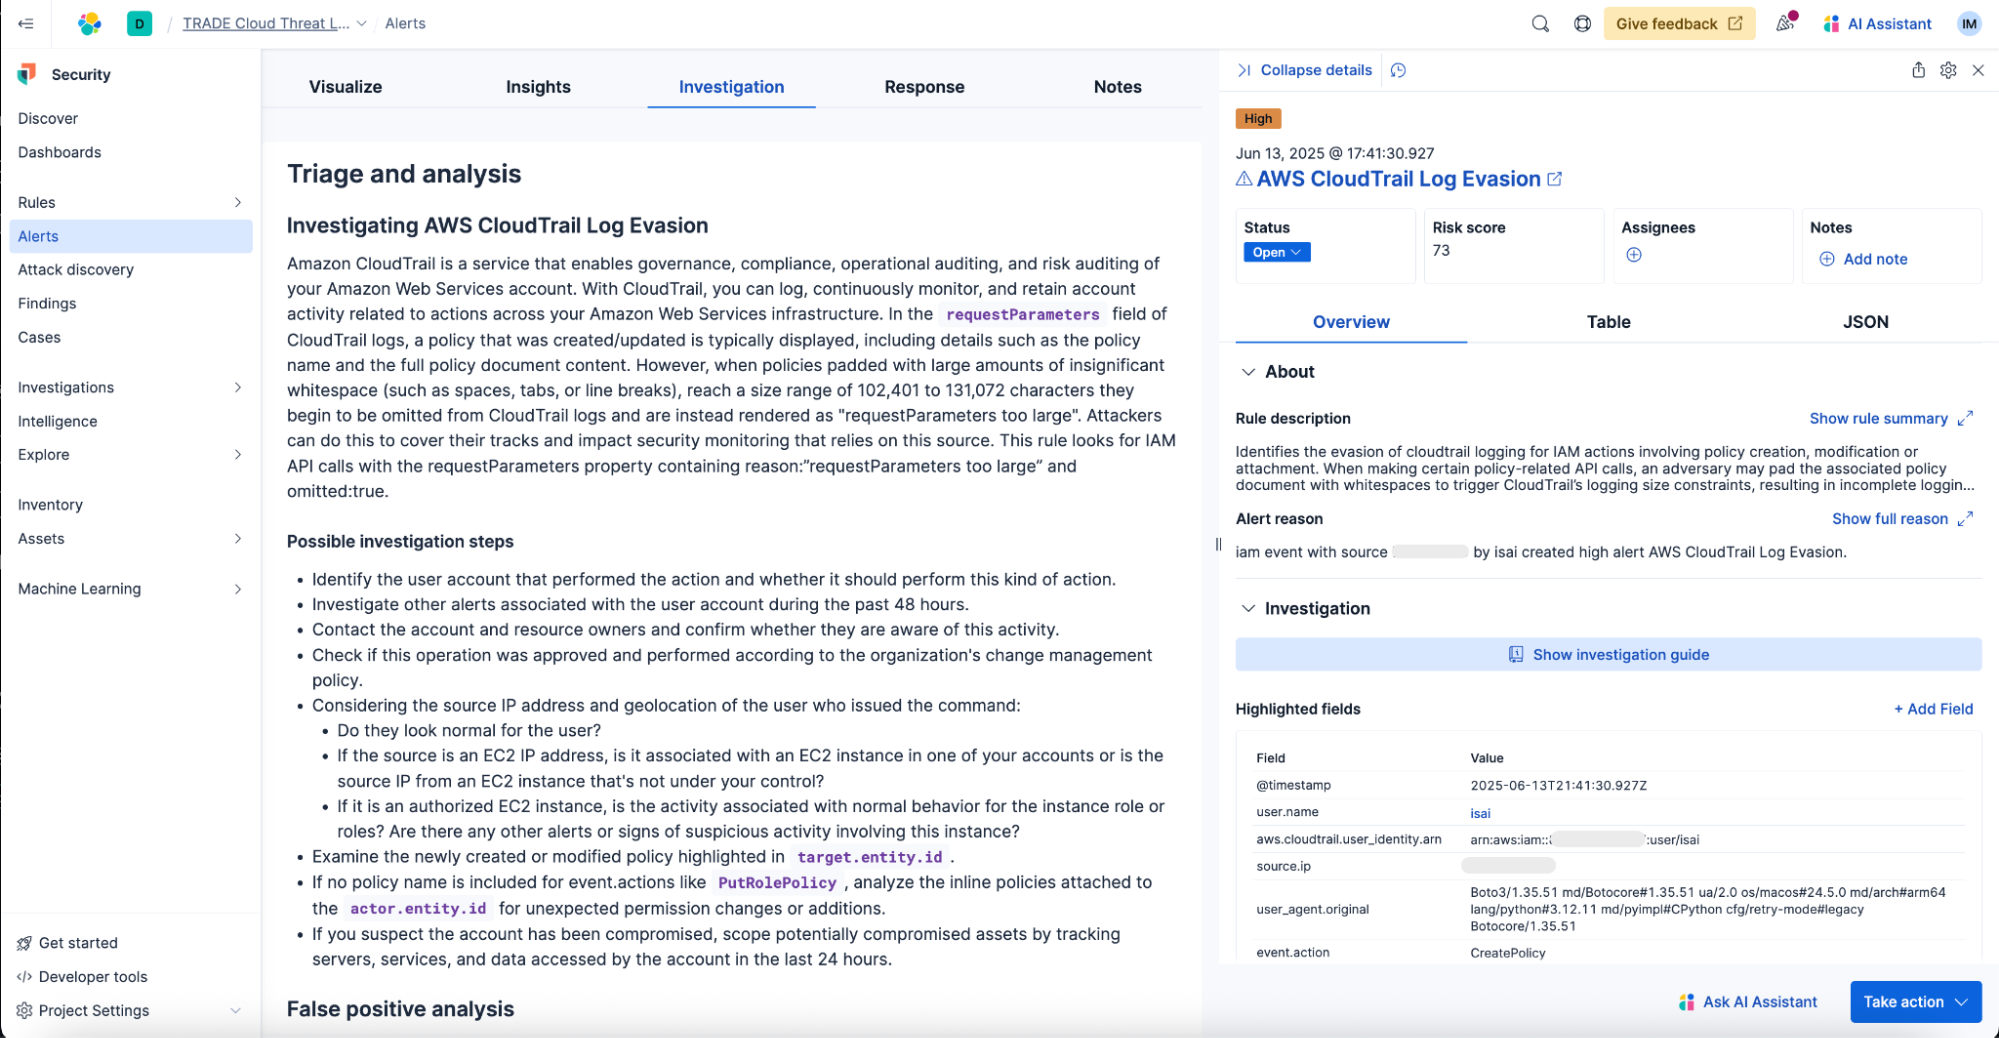
- Provide an investigation guide: Offer insights from detection engineers, presenting key checks and attack scenario context in a standardized form to assist analysts under pressure.
- Outline false positive examples: Provide valuable information for weeding out false positive alerts.
- Add reference URLs: Include links for further learning about the threat or for future reference.
- Provide a setup guide: Capture any specific settings like logging policies that must be enabled for proper rule operation, aiding seamless future data source onboarding.
Tip! You can use the Elastic AI Assistant to get the MITRE ATT&CK mapping, rule description, or other suggestions for your detection. Additional context provided in detection rules aids Attack Discovery, allowing for better alert correlation, attack description, and response recommendations.
Once documented, here’s how the provided additional context looks in the CloudTrail evasion technique detection rule:
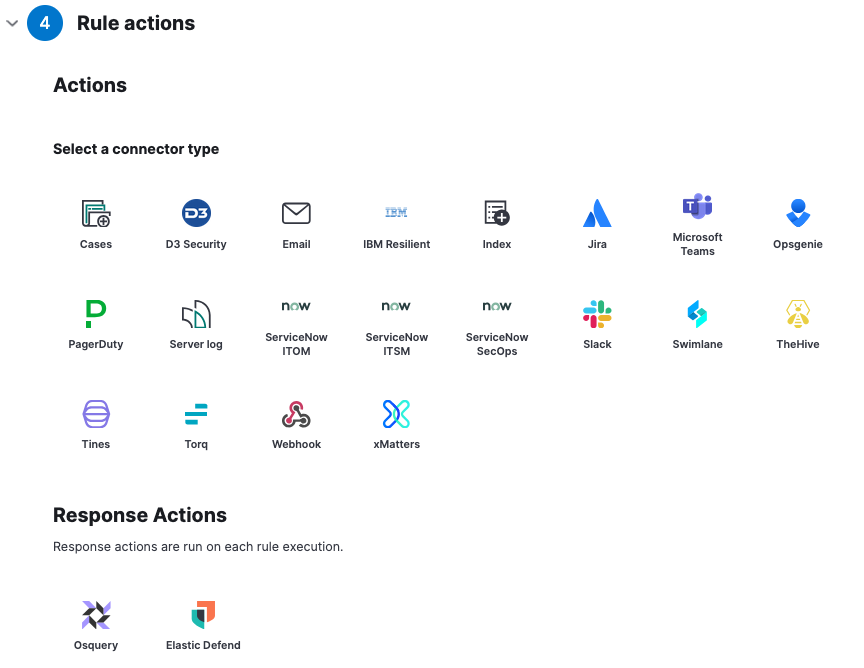
Set up automated response actions
Next to providing relevant context, we can reduce MTTR by automating actions for alerts. Various notifications and response actions can be set to speed up the investigation and remediation. Choose an option that works best for your specific environment and use case.
Step 3. Preview and test the rule
Before enabling the rule, it is recommended to preview the rule results. With Rule preview, our rule is executed against past data and potential alerts are generated. These alerts are not saved and are for preview purposes only. This way we check if the analyst experience is what we expect and if the volume of alerts is manageable. If needed, alert suppression can be set to prevent noisy alerts from overwhelming analysts.
Once the rule is created and validated against existing data with Rule preview, we need to test the rule from end to end. We will run a threat emulation script and confirm that the events are ingested and that the rule generates the expected alerts.
Tip! There are multiple open source threat emulation tools that can be used when testing your custom detections, such as Stratus Red Team and Pacu.
In this example, we see the expected three events and the resulting alerts triggered by the simulation.
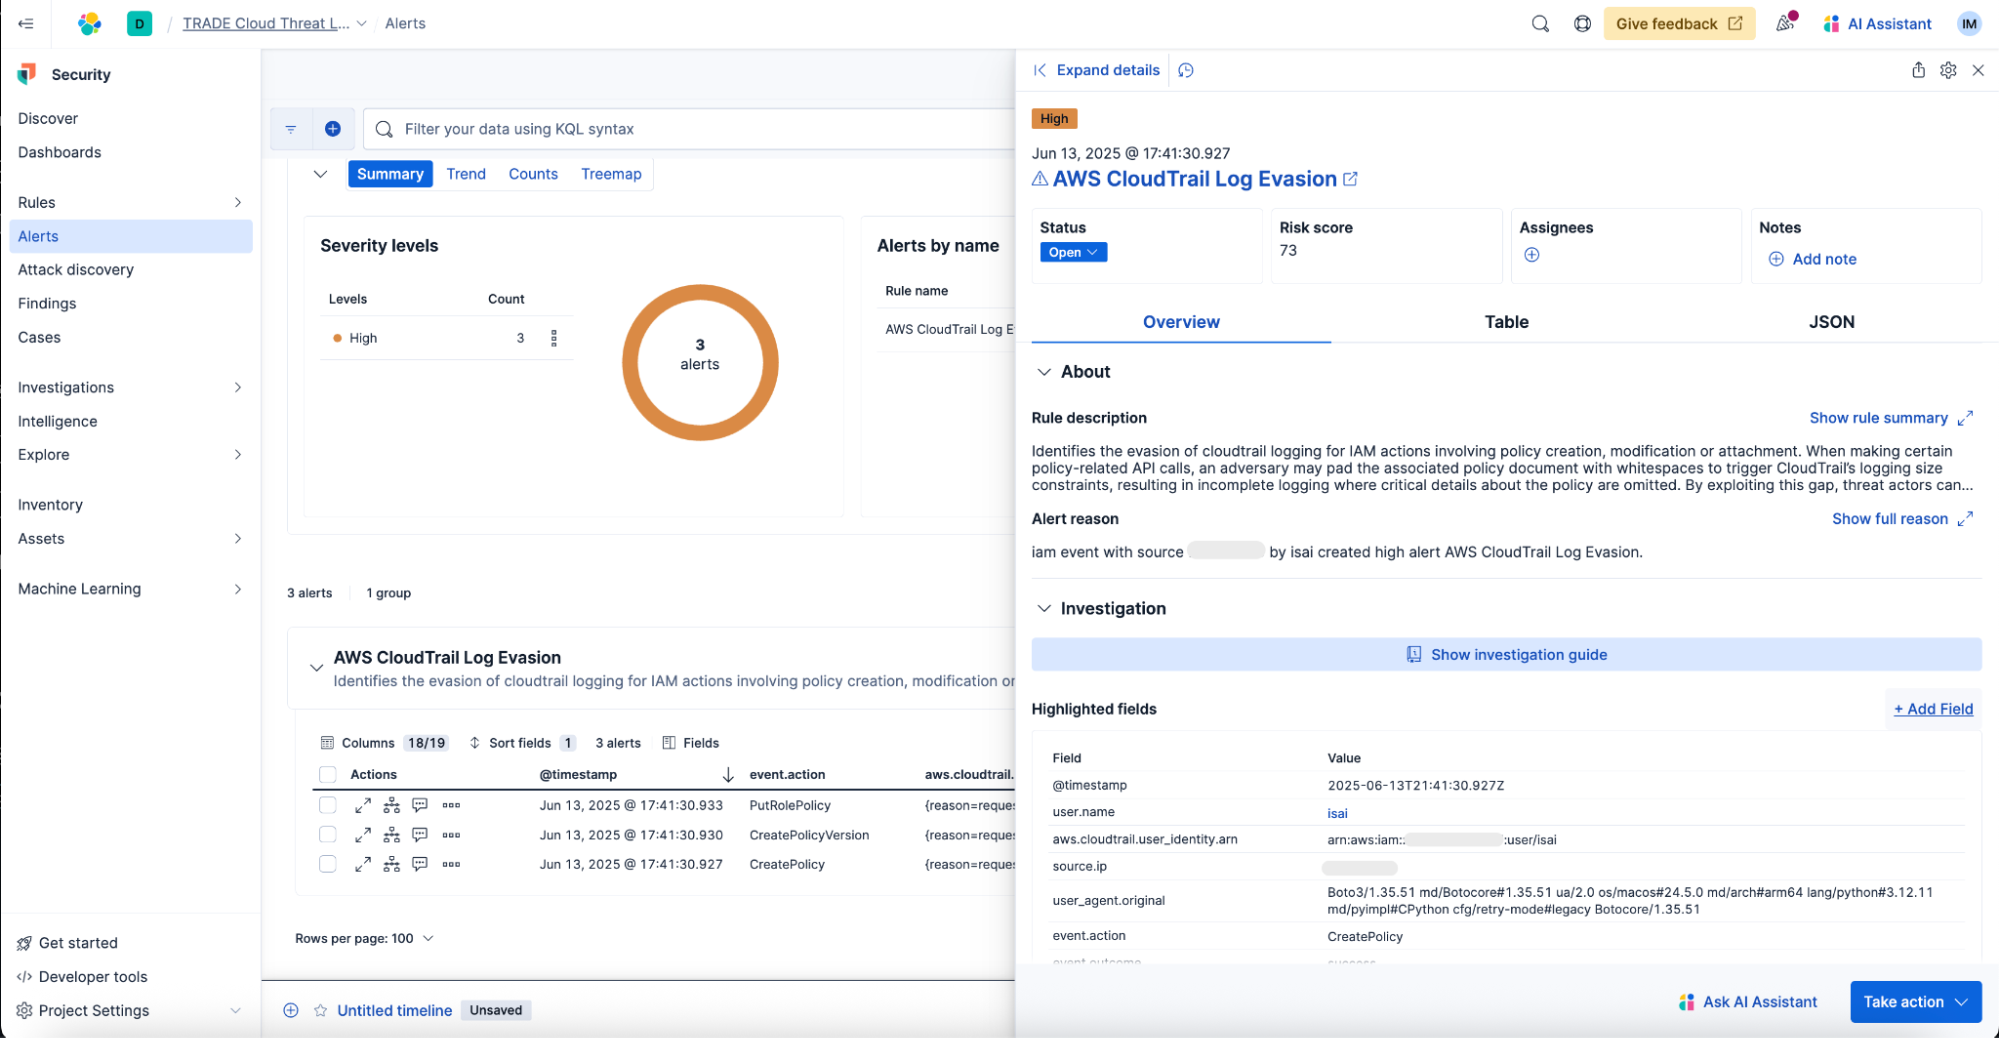
With all the context provided in the rule, the security analyst will get summarized information when opening an alert, including the rule description. They will also see the most notable information from the alert shown as highlighted fields and gain easy access to an investigation guide with additional information to speed up triage and reduce MTTR. Here’s an example.
Step 4. Deploy rule to production
Now that the rule has all the needed information and works as expected, we can follow the next steps in the detection engineering pipeline.
Depending on the team, the rule can be reviewed by other detection engineers like when using the Detections as Code setup. The rule can also be run in a test space to assess the production alert volumes and/or deployed to the production environment after handover to the security operations team.
Once in production, rules should be maintained to keep them up to date with the threat/data changes. At this point our rule enters a detection lifecycle with tuning, testing, and potential deprecation.
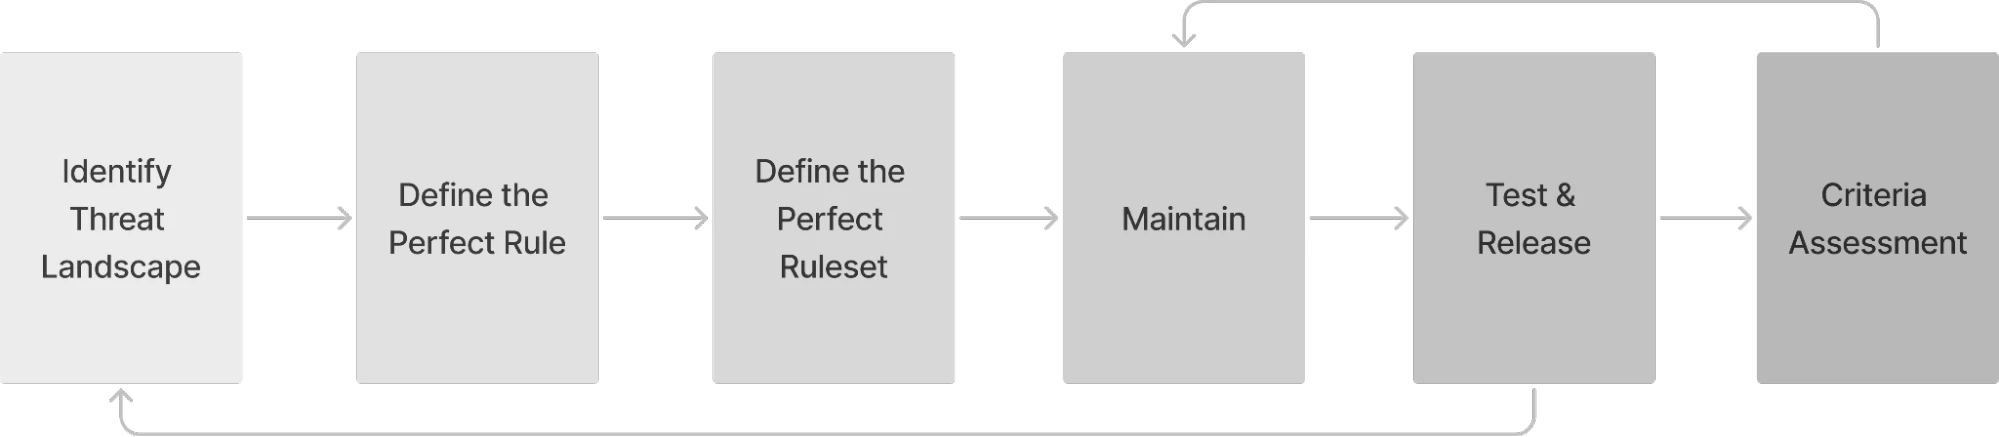
To get more insights on developing and maintaining quality detection rulesets, check out Elastic’s Detection Engineering Behavior Maturity Model blog. It provides a structured approach to improving detection engineering behaviors and processes. It also features criteria for measuring and improving ruleset maturity.
Empowering security teams
By following the four key steps — creating and refining detection logic, adding detection and response context, previewing and testing the rule, and finally deploying it to production — you can build effective threat detection capabilities. This structured approach combined with best practices and available Elastic features like ES|QL and Elastic AI Assistant empower security teams to enhance their operations and maintain a robust defense against evolving threats. We highly recommend reading about all the detection engineering features beyond ones related to detection creation in this detailed post.
Try it yourself! Connect with us and contribute
- Use your Elastic deployment, or start an Elastic Security free trial to follow the detection creation steps suggested in this blog.
- Connect with us on Elastic’s community Slack to give feedback, or tell us what detection engineering practice you are building and how we can help!
- Contribute to the security community by sharing your custom rules into the Elastic ruleset. Start by reading the rule contributor guidelines.
- Share your knowledge and opinions about Elastic Security by participating in our User Research program.
- Visit elastic.co/security to learn more.
The release and timing of any features or functionality described in this post remain at Elastic's sole discretion. Any features or functionality not currently available may not be delivered on time or at all.
In this blog post, we may have used or referred to third party generative AI tools, which are owned and operated by their respective owners. Elastic does not have any control over the third party tools and we have no responsibility or liability for their content, operation or use, nor for any loss or damage that may arise from your use of such tools. Please exercise caution when using AI tools with personal, sensitive or confidential information. Any data you submit may be used for AI training or other purposes. There is no guarantee that information you provide will be kept secure or confidential. You should familiarize yourself with the privacy practices and terms of use of any generative AI tools prior to use.
Elastic, Elasticsearch, and associated marks are trademarks, logos or registered trademarks of Elasticsearch N.V. in the United States and other countries. All other company and product names are trademarks, logos or registered trademarks of their respective owners.
Share
- Share on Twitter
Share on Twitter
- Share on LinkedIn
Share on LinkedIn
- Share on Facebook
Share on Facebook
- Share by Email
Share by Email
- Print this page
Print