Leaning into AI, ML, and observability to manage your ever-growing infrastructure
The complexity and scale of modern infrastructure requires an equally intelligent set of observability tools to effectively monitor it.


 Share on Twitter
Share on Twitter

 Share on LinkedIn
Share on LinkedIn

 Share on Facebook
Share on Facebook

 Share by Email
Share by Email

 Print this page
Print
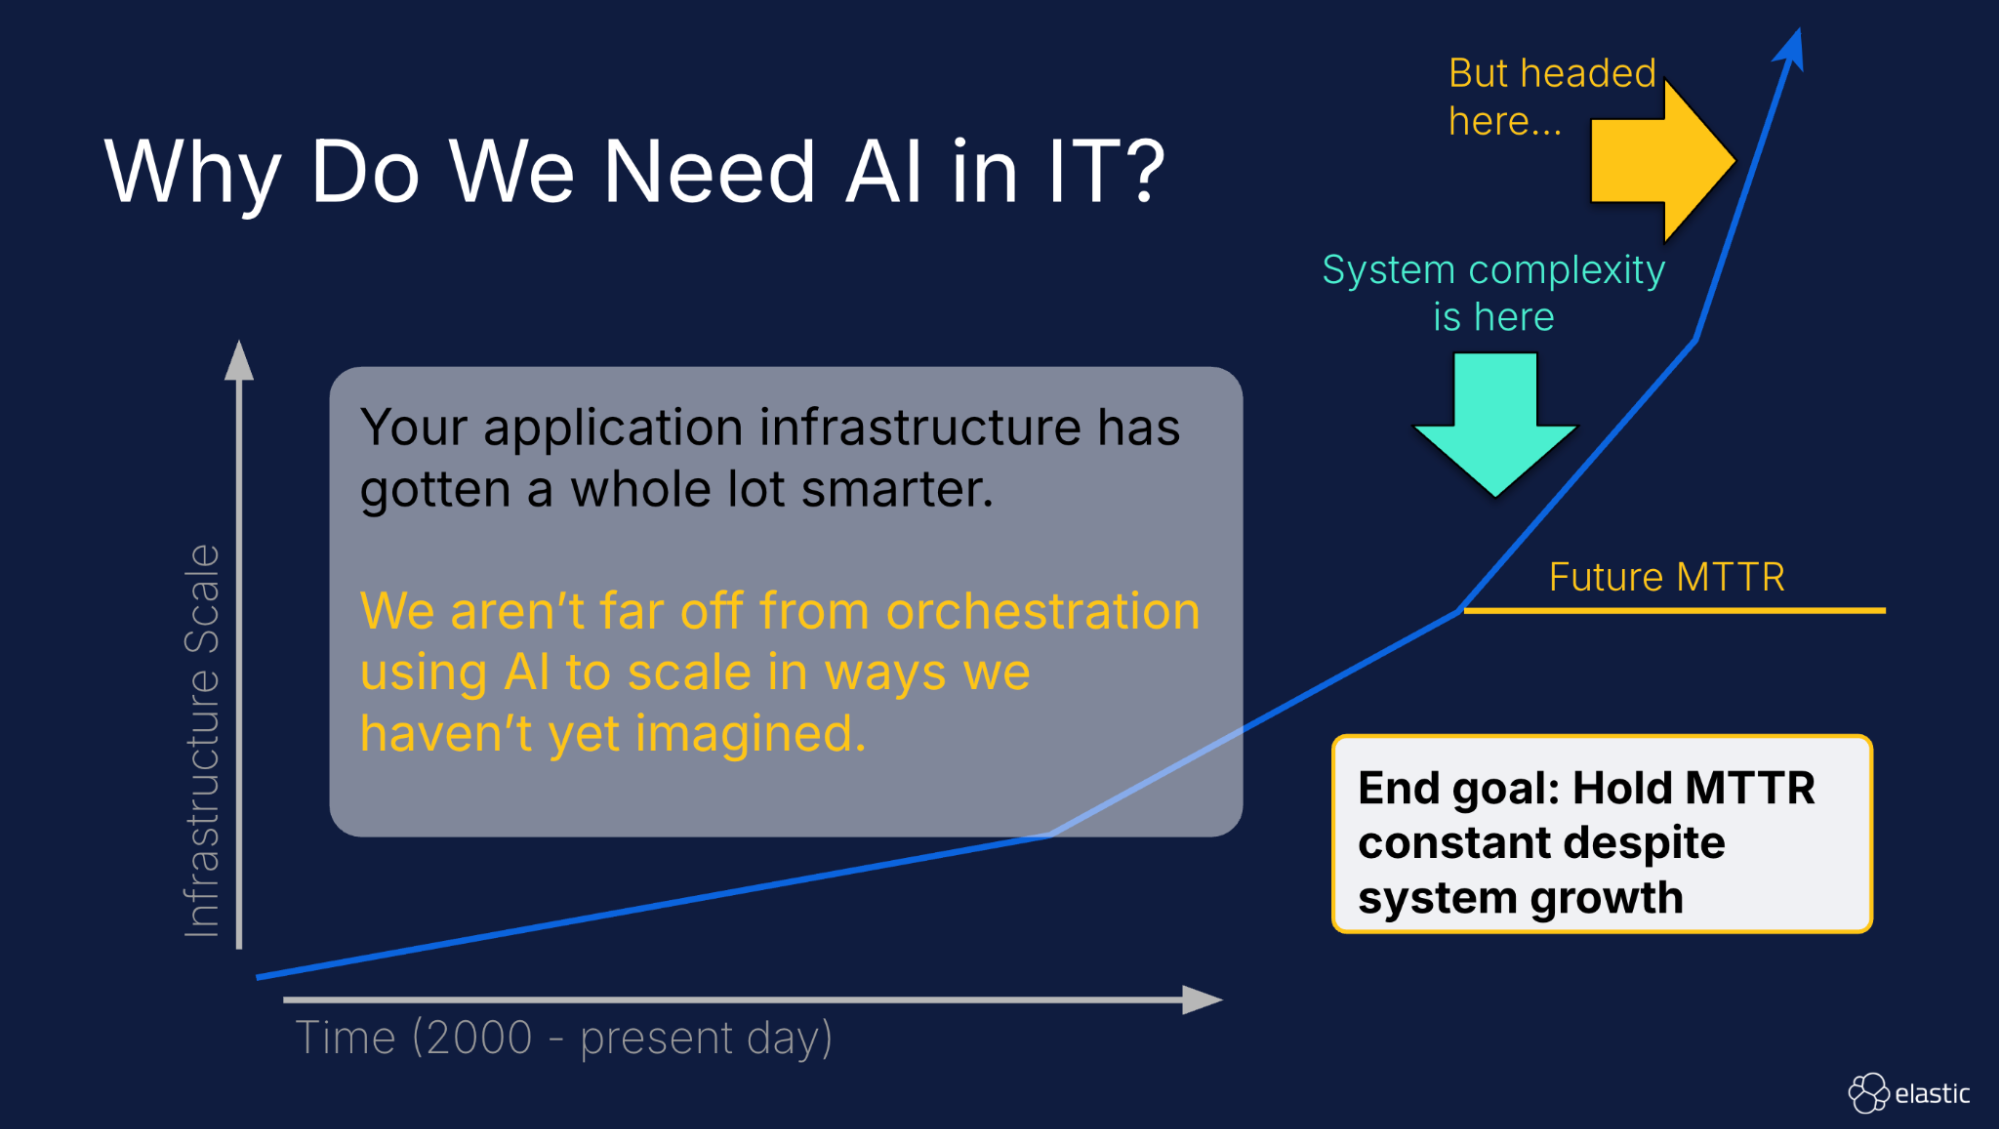
Remember when scaling meant ordering new servers and racking them in a data center? Remember when cloud providers first offered access to seemingly infinite virtual machines at the click of a button? Remember when Kubernetes made it trivial for infrastructure to automatically scale itself based on demand? Artificial intelligence (AI) is now fostering faster software development and more intelligent orchestration, once again exponentially increasing the scale of IT infrastructure.
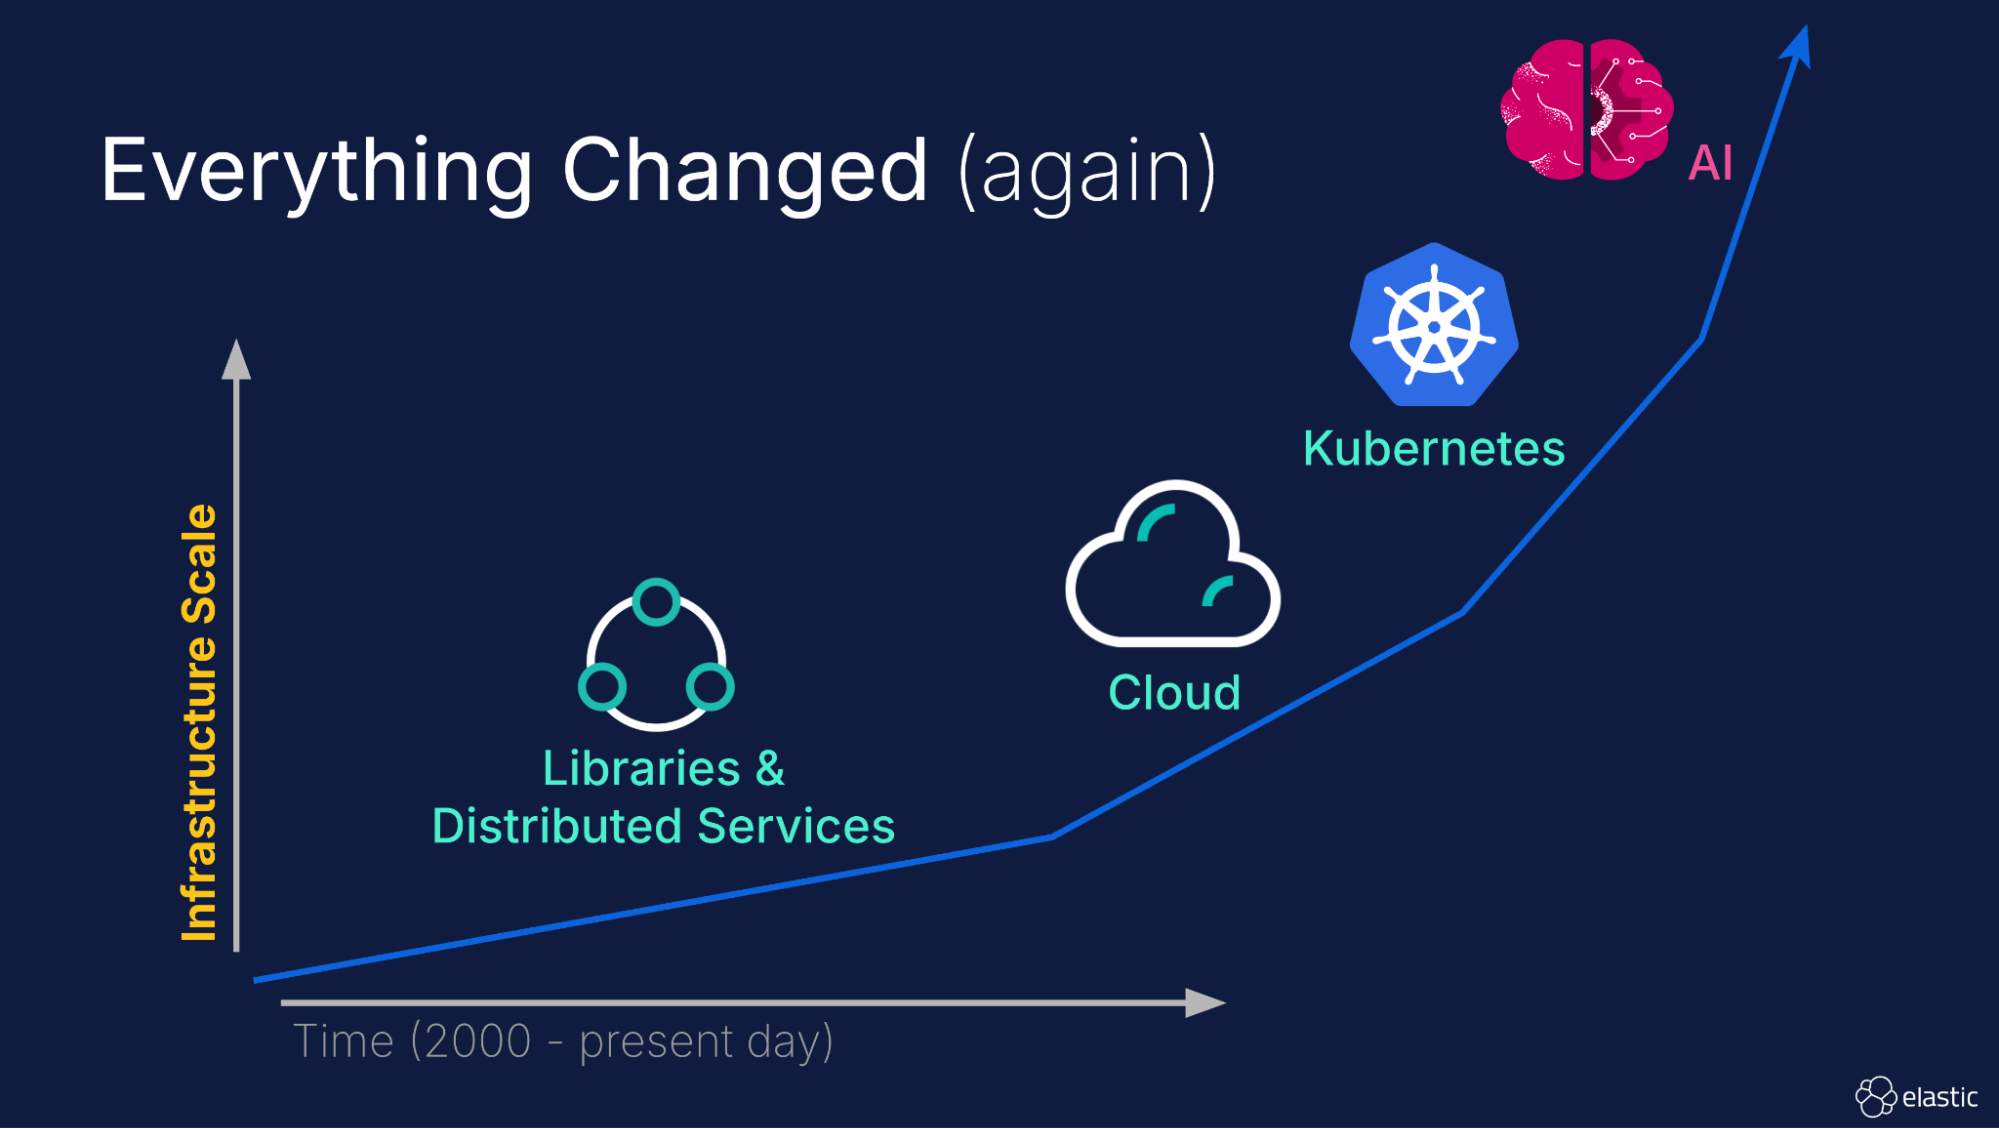
Welcome to the brave new world of modern observability and infrastructure! If you're feeling like the ground is shifting beneath your feet as an SRE or IT Operations professional, you're not alone. The way we build and run systems has undergone a dramatic transformation, and the tools we use to observe these systems need modernization to keep up. This isn't just an evolution; it's an "everything changed" moment.
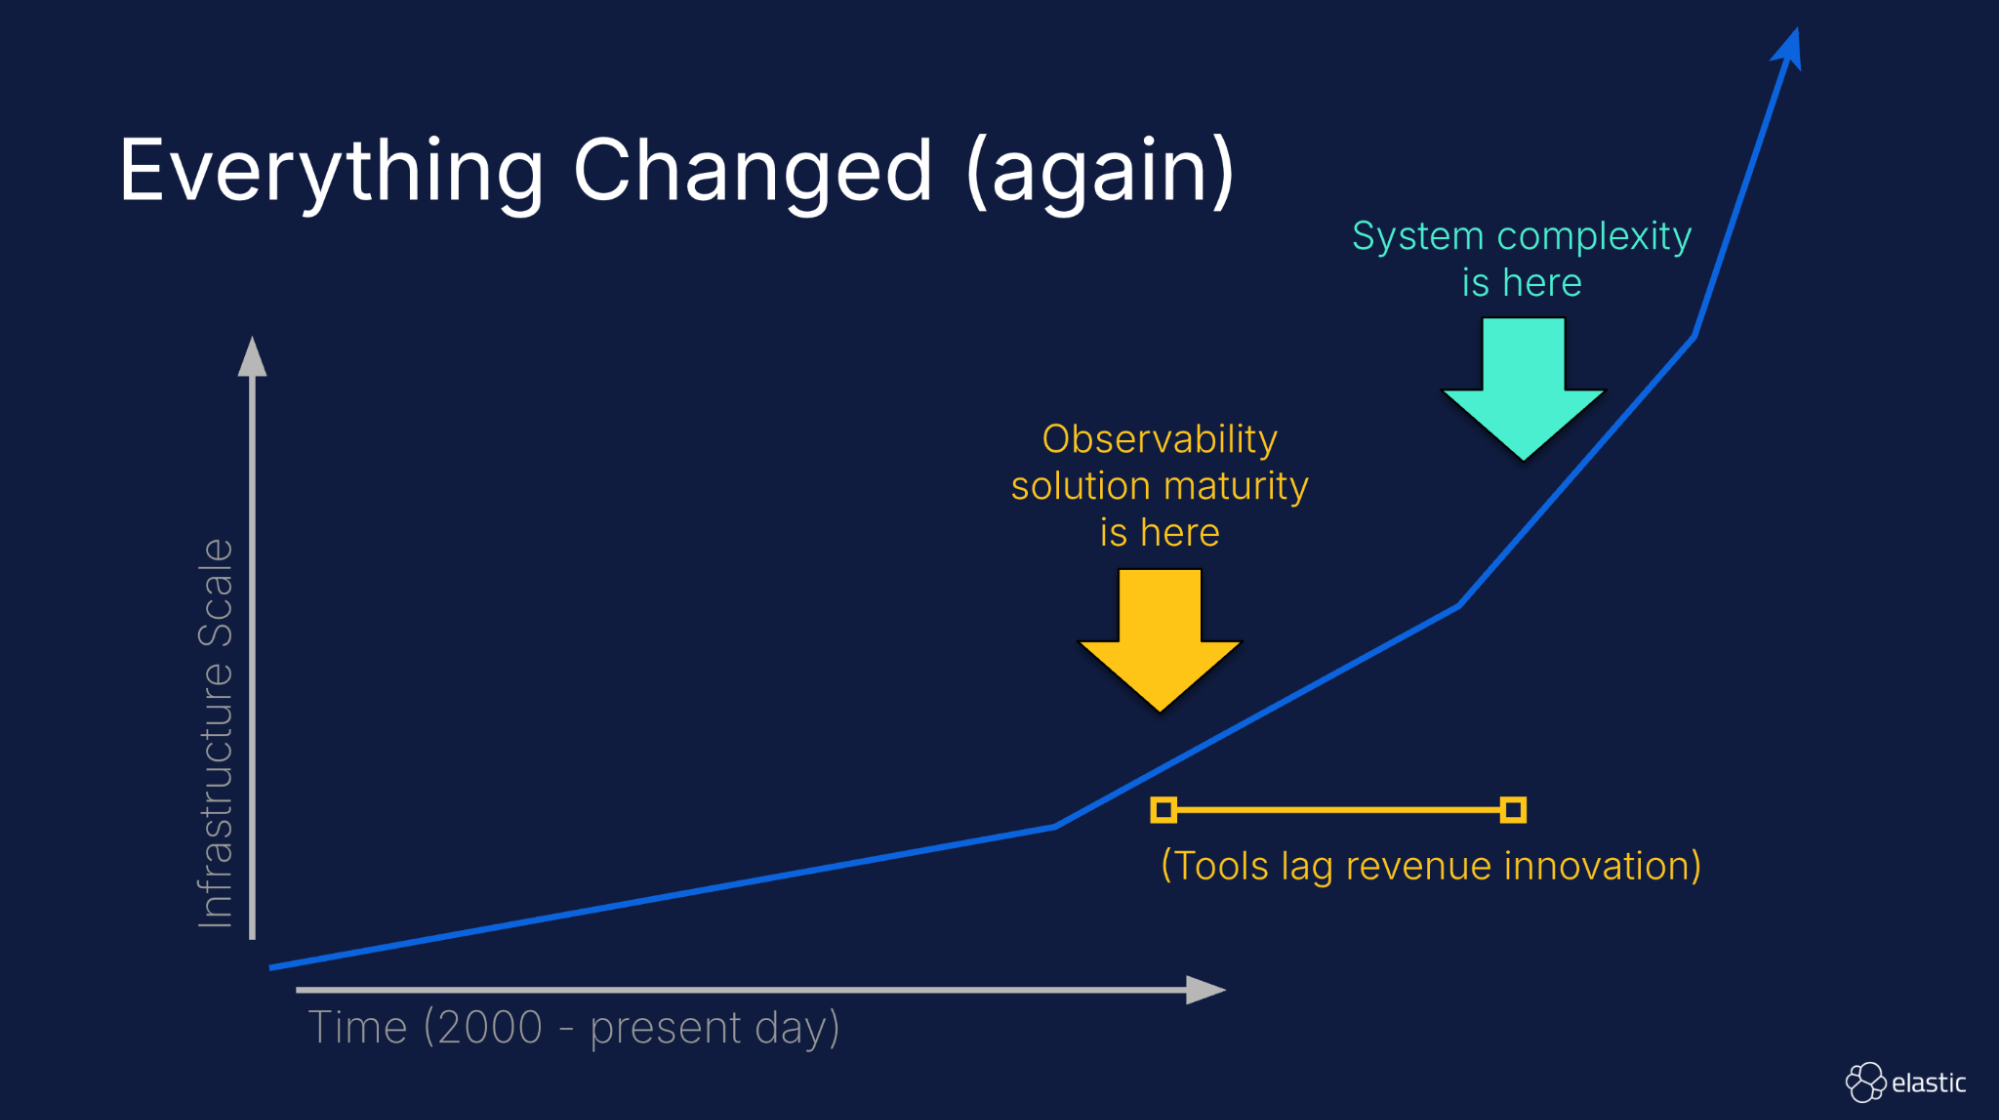
This rapid acceleration of infrastructure scale and complexity has created a gap between infrastructure complexity and the maturity of observability tools deployed today. This gap is exposing problems with data volume, data fidelity, signal correlation, and ultimately the ability to successfully perform root cause analysis (RCA).
So, how do we bridge this gap? In this article, we will discuss four key technologies that are critical to the success of modern observability.
Storage and search without compromise
As systems become more complex, intuitively they generate a lot more telemetry and data. Without help, observability costs will rise in lockstep with infrastructure scale, posing a significant financial burden to organizations.
There are a variety of existing techniques that can be employed to manage this deluge of observability data. While techniques such as metric downsampling, trace sampling, and log deduplication can be helpful in specific scenarios, they come with significant caveats if not employed carefully. Strategies that ignore data sources or surgically remove contextual metadata are generally not recommended. As we will discuss later, the future of observability is highly dependent on assistance from machine learning (ML) and AI. These technologies thrive on and require high fidelity data. Finally, speculating on the value of new log files is a full-time job; your time is better spent resolving issues.
Fortunately, there is a better solution: By making storage (a lot) cheaper, you can simply store everything without compromising searchability. How? Start by ingesting data in such a way as to separate index metadata from the data itself. This allows the backend to still support fast searches without requiring all of the backing data to always be loaded in a cache. Then apply state-of-the-art data organization and compression. Finally, store the data in super cheap object storage with a caching layer. This strategy allows an organization to maintain the full data fidelity required by ML and AI without becoming cost prohibitive.
OpenTelemetry: APM for all!
Perhaps the single largest change in modern observability is the advent of OpenTelemetry (OTel). OTel is an open source project that provides a standardized way to collect application and infrastructure logs, metrics, and traces. It offers a common set of tools, APIs, and SDKs for instrumenting applications and infrastructure.
Why is it such a big deal? OTel removes vendor lock-in and the need for proprietary agents. This in turn encourages more use of tracing as an observability signal. Further, because APIs are not vendor-specific, developers are encouraged to add application-specific attributes to their logs and spans. OTel makes the resulting data significantly more valuable both for SREs as well as ML and AI-based tools — imagine being able to analyze all of your telemetry data by customer ID, for example. Standardization of tracing APIs also encourages third parties to add instrumentation to their services, allowing visibility into infrastructure like reverse proxies and ingress controllers. Finally, a common format and tooling makes it easy for operators to process, route, and duplicate telemetry data to any OTel-compatible observability solution.
Adding OTel instrumentation to your systems is easier than ever: With the OTel Kubernetes Operator, instrumentation can be automatically injected into pods at runtime, without requiring changes to your devops workflow.
Correlation: Tying it all together
Collecting logs, metrics, and traces is a great first step, but the real power of these signals emerges when they are tied together with common correlating metadata. Correlation is a key tenet of the future of modern observability. Without it, debugging issues becomes a high-friction process, requiring analysts to manually correlate data across separate systems with inconsistent service names, timestamps, and contextual metadata. While humanly possible, this becomes a nearly impossible task for ML and AI-based tools.
OTel solves half of this problem by facilitating the consistent application of common metadata across observability signals. The other half of the problem is solved by bringing together logs, traces, and metrics into a single backend equipped for correlation.
Doing so gives SREs a superpower: They can seamlessly pivot between signals without friction, jumping from an alert to the associated traces and then drilling down into the related logs within seconds. This same level of correlation also makes it possible for ML and AI tools to look at the same problem from multiple angles, giving additional confidence and insight into a root cause.
ML and AI: Tackling complexity with intelligence
As infrastructure and applications increasingly adopt ML and AI, observability solutions must also useML and AI to be successful. What is “success” for a modern observability solution? Preventing the mean time to resolution (MTTR) of an issue from scaling in lockstep with infrastructure complexity. Ideally, MTTR remains relatively constant regardless of infrastructure scale.
The use of ML and AI in observability addresses several critical challenges:
Keeping a high signal to noise ratio: As the scale of telemetry data increases, ML plays a critical role in distinguishing meaningful alerts from noise and false alarms.
- Knowledge democratization: AI assistants level the playing field among SREs, ensuring all of them have the same level of access to tools (using natural language) and contextually relevant domain-specific knowledge (e.g., tickets, issues, and runbooks) to do their jobs uniformly and efficiently.
- Root cause analysis: AI rapidly accelerates root cause analysis by decyphering error messages, correlating signals to look at the problem from multiple perspectives, and consulting relevant domain-specific knowledge to suggest likely root causes.
In summary
Modern distributed applications and cloud infrastructure have grown increasingly complex. The solution isn't to eliminate that complexity, but rather to monitor it with confidence.
This requires four foundational capabilities: cost-effective storage, standardized data collection via OpenTelemetry, correlation between signals through unified metadata, and ML and AI-driven tools that democratize knowledge and make alerts actionable. Together, these capabilities will help constrain the mean time to resolution of an issue constant even as infrastructure continues to scale without bound.
With the advent of OpenTelemetry and AI, vendors will no longer differentiate themselves on ingestion technologies, basic analytics, and static dashboards; those things are becoming commodities. Future differentiation will come through innovations in storage (speed and cost) and AI-based workflow automation (alerts and dynamic dashboards).
This isn't just about monitoring; it's about enabling our systems, and the people who manage them, to operate effectively at a scale previously thought unimaginable.
Want to learn more? Watch the Future of Modern Observability webinar to hear more about Elastic’s vision for how observability will evolve moving forward.
The release and timing of any features or functionality described in this post remain at Elastic's sole discretion. Any features or functionality not currently available may not be delivered on time or at all.
In this blog post, we may have used or referred to third party generative AI tools, which are owned and operated by their respective owners. Elastic does not have any control over the third party tools and we have no responsibility or liability for their content, operation or use, nor for any loss or damage that may arise from your use of such tools. Please exercise caution when using AI tools with personal, sensitive or confidential information. Any data you submit may be used for AI training or other purposes. There is no guarantee that information you provide will be kept secure or confidential. You should familiarize yourself with the privacy practices and terms of use of any generative AI tools prior to use.
Elastic, Elasticsearch, and associated marks are trademarks, logos, or registered trademarks of Elasticsearch N.V. in the United States and other countries. All other company and product names are trademarks, logos or registered trademarks of their respective owners.
Share
- Share on Twitter
Share on Twitter
- Share on LinkedIn
Share on LinkedIn
- Share on Facebook
Share on Facebook
- Share by Email
Share by Email
- Print this page
Print