Hash, store, join: A modern solution to log deduplication with ES|QL LOOKUP JOIN
Storage reduction example on PowerShell logs with full context


 Share on Twitter
Share on Twitter

 Share on LinkedIn
Share on LinkedIn

 Share on Facebook
Share on Facebook

 Share by Email
Share by Email

 Print this page
Print
The high cost of data fidelity: When more data isn't better
In the world of cybersecurity and observability, leadership faces a persistent dilemma: The nonnegotiable mandate for complete visibility clashes with the stark reality of finite budgets. This conflict is nowhere more apparent than with PowerShell logging. For any modern enterprise with a significant Windows footprint, PowerShell is the engine of administration and automation. Its power and ubiquity, however, make it a primary target for adversaries who exploit it for fileless malware execution, lateral movement, and credential theft.
To counter this threat, security frameworks mandate comprehensive logging, specifically PowerShell script block logging (Event ID 4104). These logs are essential for threat hunting as they capture the exact deobfuscated code an attacker runs. However, this security mandate can create a data management crisis. Enabling full-script block logging generates a prohibitively large number of events, potentially creating terabytes of data that lead to significant storage and indexing costs.
This creates a direct conflict between security requirements and budget constraints. This blog introduces a more intelligent strategy, representing a paradigm shift in how to approach log data. What if it were possible to retain every piece of forensic evidence without paying to store it millions of times? The answer lies in treating logs less like a verbose diary and more like an efficient, searchable note — a strategy powered by the Elastic Stack and the revolutionary Elasticsearch Query Language (ES|QL) LOOKUP JOIN command.
The potential: Drastic storage reduction
Let’s quantify the potential benefit. Consider a realistic enterprise scenario where a standard 9KB PowerShell health check script runs on 10,000 servers every 10 minutes. This generates 1,440,000 events per day. The impact of this technique on storage consumption is transformative.
| Metric | Before optimization | After optimization | Impact |
| Script text storage/day | 12.96GB | 9KB | ~99.99% reduction |
| Total events logged | 1.44 million | 1.44 million (lean) + 1 (full) | No loss of event metadata |
| Analytic capability | Full script text available | Full script text available on demand | Zero loss of fidelity |
| Security rule coverage | Full | Full (with investigation via lookup index scanning) | Zero blind spots created |
Note: The storage figures are before any index-level compression is applied.
The strategy: Hash, store once, look up on demand
The core principle of this solution is intelligent data deduplication. In any large enterprise, the same set of PowerShell scripts for health checks, application monitoring, and administrative tasks is executed millions of times a day. The traditional approach captures the full, multikilobyte text of these scripts with every single execution, leading to massive data redundancy.
Consider your daily commute. You don't need a new, detailed map for every trip; you just need a note saying: took the usual route. Our logging strategy applies this same logic. Instead of storing the full "map" (the script text) every time, we store it once and then simply log a lightweight reference — a hash — for each execution.
This architecture is built on three pillars within the Elastic Stack:
Event cloning (Logstash): As a versatile server-side data processing pipeline, Logstash is ideal for complex routing. We will use its clone filter to create an in-flight duplicate of every PowerShell script block log event.
Deduplication via hashing (ingest pipeline): An Elasticsearch ingest pipeline will process both the original and cloned events. It generates a unique hash of the script text, which serves as the key for deduplication. The pipeline strips the bulky script text from the original event, transforming the clone into a minimal "lookup" document that contains only the script text, relevant metadata for security detection rules, and its hash. The "lookup" document is stored in a single-shard lookup index, where duplicates are automatically overwritten.
- Enrichment on demand (ES|QL): ES|QL is a powerful piped query engine that supports native joins. At query time, an analyst can use the LOOKUP JOIN command to seamlessly reunite the lean event metadata like timestamp, host, and user with the full script text from the lookup index, providing complete context on demand.
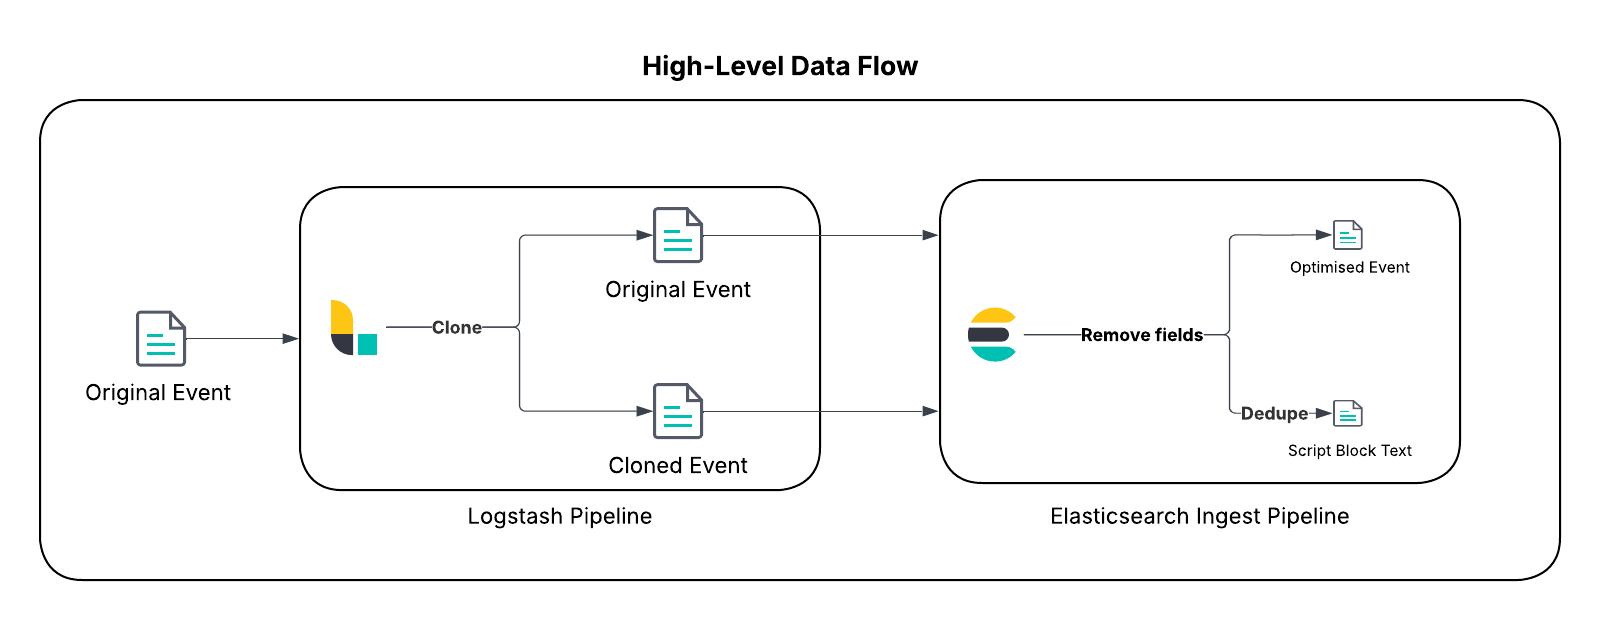
This approach represents a strategic shift from the traditional "denormalize at ingest" model to a more flexible and cost-efficient "enrich at query time" paradigm, showcasing the power of the new ES|QL query engine.
Implementation showcase
This section provides the technical details to demonstrate this data reduction strategy.
Important
Before implementing this in your production environment, thoroughly review the prerequisites and implementation steps outlined in this blog post, customize based on your requirements, and follow best practices for testing and evaluation in your nonproduction environment to ensure the solution is suitable in your environment and data. To facilitate the adoption and testing of this pattern, all the necessary configuration files and code snippets are provided in this public GitHub repository.
Prerequisites
Before beginning, ensure your environment meets the following requirements:
An Elastic Stack version 8.18/9.0 and newer: This pattern uses the LOOKUP JOIN command in ES|QL, which is now generally available in 8.19/9.1. This gives you access to powerful, new join capabilities. Lookup indices enable this powerful query-time operation and must be single-shard only.
PowerShell logging enabled: You must have PowerShell script block logging (Event ID 4104) enabled in your Windows environment. This is typically configured via Group Policy under Administrative Templates > Windows Components > Windows PowerShell > Turn on PowerShell Script Block Logging. View the Microsoft documentation for additional reference.
Elastic Windows integration: This solution is optimized for use with the official Elastic Windows integration. While the technique can be adapted to older integration versions or Winlogbeat, using a recent version of the Elastic Windows integration is recommended for optimal results. This guide will use the powershell.file.script_block_hash field to set the document_id for deduplication.
Logstash: This solution will use Logstash to duplicate the relevant event before it is optimized. Follow the documentation to set it up if you don’t have this deployed.
- Understand your data: This solution focuses on PowerShell script blocks that are not segmented due to the size limit of Event Tracing for Windows (ETW) events. Review your data and data access pattern over a meaningful timeframe to understand the potential benefit in your environment and plan for the volume accordingly.
Use this sample Kibana Query Language (KQL) search to understand the volume of target data in your environment: “event.module: "windows" and event.dataset: "windows.powershell_operational" and event.code: 4104 and powershell.total: 1”.
Optional: Creating the script block hash
First, verify if the powershell.file.script_block_hash field already exists and is populated in your logs-windows.powershell_operational-* data stream.Windows integration before 1.45.0 may require you to generate this field manually. If the field is missing, upgrade your integration or replicate the process in the logs-windows.powershell_operational@custom ingest pipeline.
Step 1: Set up the lookup index
The first step is to create the templates for our lookup index. This includes a component template with minimal mapping and an index template that sets the crucial index.mode to lookup. Using an alias and an index lifecycle management (ILM) policy from the start will automate size management later.
Set up the component template with minimal mapping (see screenshot below) using the following request: PUT _component_template/logs-windows.powershell_operational_lookup@package with the contents from this artifact in the GitHub repository or the code block below.
PUT _component_template/logs-windows.powershell_operational_lookup@package
{
  "template": {
    "settings": {
      "index": {
        "lifecycle": {
          "name": "logs-powershell_script_block"
        },
        "default_pipeline": "logs-windows.powershell_operational-3.0.0",
        "mapping": {
          "total_fields": {
            "limit": "1000"
          }
        },
        "analysis": {
          "analyzer": {
            "powershell_script_analyzer": {
              "pattern": "[\\W&&[^-]]+",
              "type": "pattern"
            }
          }
        }
      }
    },
    "mappings": {
      "properties": {
        "@timestamp": {
          "ignore_malformed": false,
          "type": "date"
        },
        "ecs": {
          "type": "object",
          "properties": {
            "version": {
              "ignore_above": 1024,
              "type": "keyword"
            }
          }
        },
        "error": {
          "type": "object",
          "properties": {
            "code": {
              "ignore_above": 1024,
              "type": "keyword"
            }
          }
        },
        "event": {
          "type": "object",
          "properties": {
            "sequence": {
              "type": "long"
            },
            "ingested": {
              "type": "date"
            },
            "code": {
              "ignore_above": 1024,
              "type": "keyword"
            },
            "provider": {
              "ignore_above": 1024,
              "type": "keyword"
            },
            "created": {
              "type": "date"
            },
            "kind": {
              "ignore_above": 1024,
              "type": "keyword"
            },
            "module": {
              "type": "constant_keyword",
              "value": "windows"
            },
            "action": {
              "ignore_above": 1024,
              "type": "keyword"
            },
            "category": {
              "ignore_above": 1024,
              "type": "keyword"
            },
            "type": {
              "ignore_above": 1024,
              "type": "keyword"
            },
            "dataset": {
              "type": "constant_keyword",
              "value": "windows.powershell_operational"
            },
            "outcome": {
              "ignore_above": 1024,
              "type": "keyword"
            }
          }
        },
        "file": {
          "properties": {
            "directory": {
              "ignore_above": 1024,
              "type": "keyword"
            },
            "name": {
              "ignore_above": 1024,
              "type": "keyword"
            },
            "path": {
              "ignore_above": 1024,
              "type": "keyword",
              "fields": {
                "text": {
                  "type": "match_only_text"
                }
              }
            }
          }
        },
        "host": {
          "properties": {
            "os": {
              "properties": {
                "type": {
                  "ignore_above": 1024,
                  "type": "keyword"
                }
              }
            }
          }
        },
        "message": {
          "type": "match_only_text"
        },
        "powershell": {
          "type": "object",
          "properties": {
            "file": {
              "type": "object",
              "properties": {
                "script_block_text": {
                  "analyzer": "powershell_script_analyzer",
                  "type": "text"
                },
                "script_block_hash": {
                  "ignore_above": 1024,
                  "type": "keyword"
                }
              }
            }
          }
        },
        "user": {
          "properties": {
            "id": {
              "ignore_above": 1024,
              "type": "keyword"
            }
          }
        }
      }
    }
  }
}Set up the index template that references the component template above, and ensure the index.mode is set to lookup using the following request: PUT _index_template/logs-windows.powershell_operational_lookup with the contents from this artifact in the GitHub repository or the code block below.
PUT _index_template/logs-windows.powershell_operational_lookup
{
  "index_patterns": [
    "logs-windows.powershell_operational_lookup-*"
  ],
  "template": {
    "settings": {
      "index": {
        "mode": "lookup"
      }
    }
  },
  "composed_of": [
    "logs@mappings",
    "logs@settings",
    "logs-windows.powershell_operational_lookup@package",
    "logs@custom",
    "ecs@mappings",
    ".fleet_globals-1",
    ".fleet_agent_id_verification-1",
    "logs-windows.powershell_operational@custom"
  ],
  "priority": 300,
  "ignore_missing_component_templates": [
    "logs@custom",
    "logs-windows.powershell_operational@custom"
  ]
}Set up the ILM referenced in the component template above using the following request: PUT _ilm/policy/logs-powershell_script_block with the contents from this artifact in the GitHub repository or the code block below.
PUT _ilm/policy/logs-powershell_script_block
{
  "policy": {
    "phases": {
      "hot": {
        "min_age": "0ms",
        "actions": {
          "rollover": {
            "min_primary_shard_size": "1gb",
            "max_age": "90d",
            "max_docs": 200000000,
            "max_primary_shard_size": "30gb"
          },
          "set_priority": {
            "priority": 100
          }
        }
      },
      "delete": {
        "min_age": "30d",
        "actions": {
          "delete": {}
        }
      }
    },
    "_meta": {
      "description": "sample policy for the logs-windows.powershell_operational_lookup index template"
    }
  }
}Optional
Bootstrap the lookup index with an alias and configure ILM policy to automate rollover.
Note: Our example component template includes a custom ILM policy: logs-powershell_script_block.
PUT %3Clogs-windows.powershell_operational_lookup-default2-%7Bnow%2Fd%7D-000001%3E
{
  "aliases": {
    "logs-windows.powershell_operational_lookup-default": {
      "is_write_index": true
    }
  },
  "settings": {
      "index.lifecycle.rollover_alias": "logs-windows.powershell_operational_lookup-default"
  }
}Expert insight: Exclude the lookup index from Kibana under normal usage
You might want to exclude the lookup index to ensure the lookup documents are only visible when you’re using ES|QL LOOKUP JOIN so that other analyses are not skewed by the documents. Set up a data view with ,-*lookup*, such as logs-windows.powershell*,-*lookup*, in the index pattern to exclude this from your normal Kibana experience in the Classic Discovery mode. Exclude the tag when using ES|QL in other scenarios with WHERE `tags`!="powershell_scriptblock_reduction"
Step 2: Event processing in Logstash
Next, intercept PowerShell script block logs (Event ID 4104) in your Logstash pipeline, and create a duplicate using the clone filter.
In this filter block, we target only the relevant PowerShell script block events that haven’t been segmented. The clone filter creates a copy and adds the tag powershell_scriptblock_reduction to it. The original event is flagged with fields.duplicated: true for downstream processing. We also update the data stream namespace to route it to our new data stream (optional).
filter {
  if ([event][module] == "powershell" or [event][provider] == "Microsoft-Windows-PowerShell") and [event][code] == "4104" and [winlog][event_data][MessageTotal] == "1" {
    clone {
      clones => ["powershell_scriptblock_reduction"]
      ecs_compatibility => v8
    }
    ## Indicate the event has been cloned
    if !("powershell_scriptblock_reduction" in [tags]) {
      mutate {
        ## Send data to a custom datastream via renaming the namespace for demonstration
        update => { "[data_stream][namespace]" => "default_reduced" }
        add_field => {
          "[fields][duplicated]" => true
        }
      }
    }
  }
}Expert insight: Understanding your source data
You might notice that a single large PowerShell script can generate multiple 4104 events. This is expected behavior from our source data, which segments large scripts to fit within event size limits and even randomizes the chunk size to hinder evasion techniques (see the code). Our hashing technique skips these randomized chunks to reduce the growth in the lookup index for data that could be from the same script.
Step 3: Routing to separate destinations
With events cloned and tagged, the Logstash output configuration below routes them to different destinations. The original event goes to a standard data stream while the clone is directed to the dedicated lookup index.
This configuration uses a simple conditional:
If the powershell_scriptblock_reduction tag is present, the event is a clone destined for our lookup index. We explicitly name this index (logs-windows.powershell_operational_lookup-default) and use the index action (lookup indices are not data streams and are single-shard only).
- Otherwise, it's the original event, which is sent to its data stream as usual (in this case, it’s logs-windows.powershell_operational-default_reduced).
output {
  if "powershell_scriptblock_reduction" in [tags]{
    elasticsearch {
      cloud_id => "..."
      index => "logs-windows.powershell_operational_lookup-default"
      action => "index"
      api_key => "${ES_API}"
      ssl_enabled => true
    }
  }
  else {
    elasticsearch {
      cloud_id => "..."
      data_stream => "true"
      api_key => "${ES_API}"
      ssl_enabled => true
    }
  }
}Expert insight: The index action is a delete-and-add operation
You may notice the lookup index increasing in size and then shrinking back down. This is because the index action is a delete-and-add operation, rather than an in-place update under the hood.
Step 4: Processing with ingest pipelines
Based on Elastic integration’s ingest processing flow, both events are processed by a custom ingest pipeline that uses conditional logic to apply different processors based on the flags added in Logstash.
The following table breaks down the processing paths for clarity.
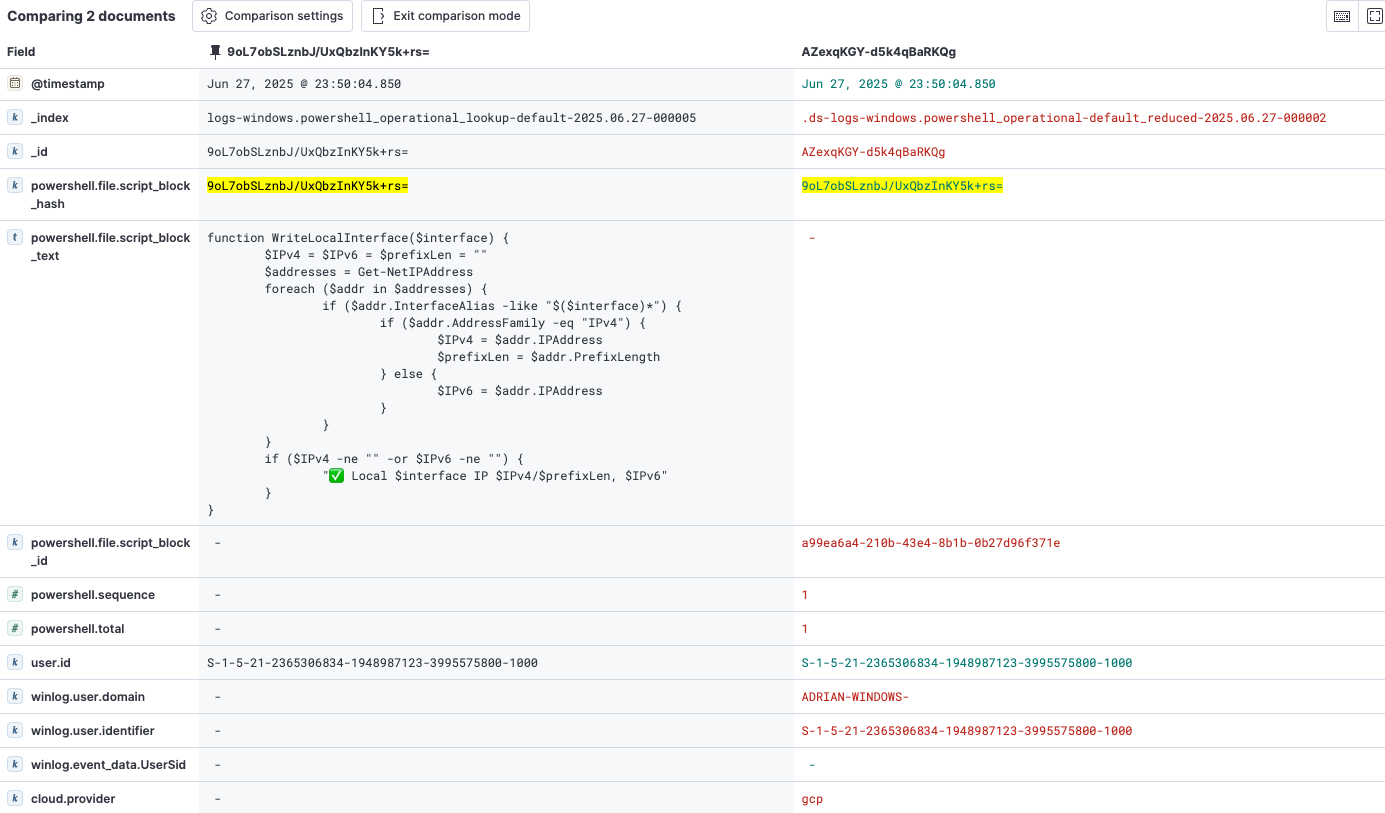
| Event path | Identifying flag | Key processors applied | Resulting document |
| Original event | fields.duplicated == true | 1. Remove (message field) 2. Remove (powershell.file.script_block_text field) | An optimized event containing all original metadata (host, user, etc.) but without the bulky script text |
| Cloned event | tags contain powershell_scriptblock_reduction | 1. Script (retain host.os.type field to enable detection rule matching) 2. Script (retain user.id field to enable detection rule matching or filtering) 3. Script (retain file.name, file.path, and file.directory fields for detection rule matching or filtering) 4. Remove (all other nonessential metadata) 5. Script (set _id to the hash) | A minimal lookup document containing only the critical metadata fields for detection (script text and its hash) with the document ID set to the hash for automatic deduplication |
This method of setting the _id to the script hash is architecturally superior and far more performant at scale than the alternative (running a "search-then-insert" query for every single incoming log event). While cloning events in Logstash and processing them twice in the ingest pipeline adds some overhead, it is a deliberate trade-off for the storage reduction.
Set up the ingest pipeline using the following request: PUT _ingest/pipeline/logs-windows.powershell_operational@custom with the contents from this artifact in the GitHub repository or the code block below.
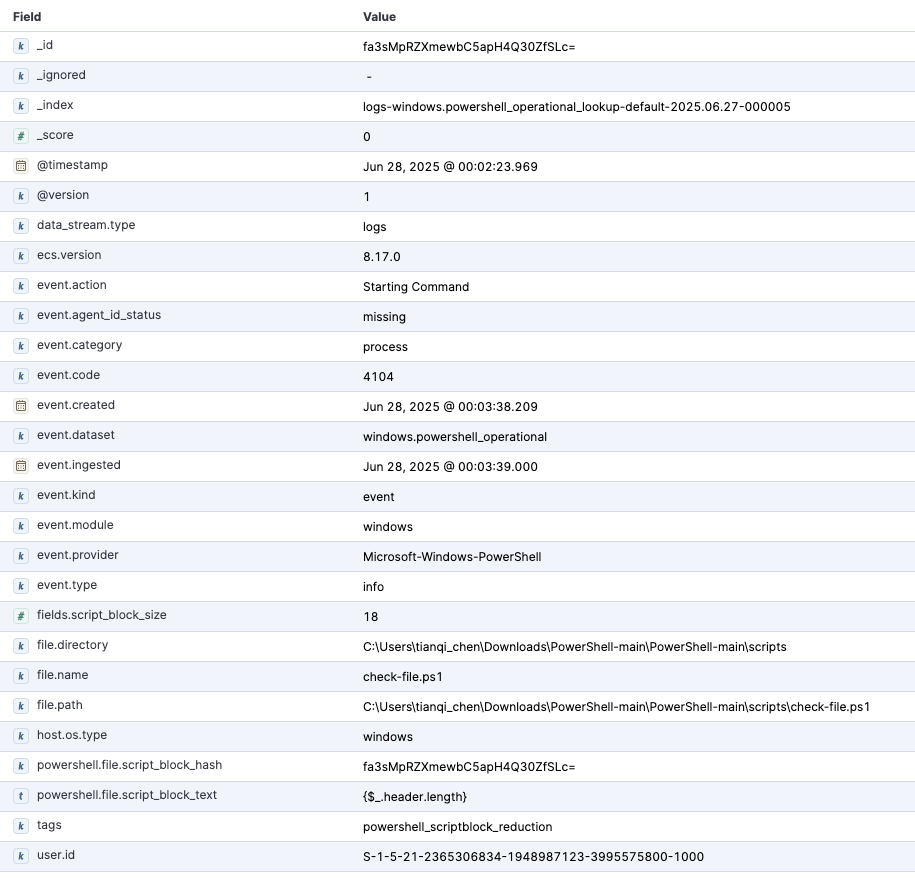
This will result in two documents: the minimal lookup document (on the left) and the optimized event document (on the right).
{
  "processors": [
    {
      "remove": {
        "ignore_missing": true,
        "field": "message",
        "if": "ctx.powershell?.file?.script_block_hash!= null && ctx.fields?.duplicated!= null && (ctx.fields?.duplicated == true || ctx.fields?.duplicated == 'true')",
        "description": "Remove message for lean event"
      }
    },
    {
      "remove": {
        "ignore_missing": true,
        "field": "powershell.file.script_block_text",
        "if": "ctx.powershell?.file?.script_block_hash!= null && ctx.fields?.duplicated!= null && (ctx.fields?.duplicated == true || ctx.fields?.duplicated == 'true')",
        "description": "Remove script_block_text for lean event"
      }
    },
    {
      "script": {
        "if": "ctx.tags!= null && ctx.tags.contains('powershell_scriptblock_reduction') && (ctx.host?.os?.type != null)",
        "source": """
ctx._temp = ctx._temp != null ? ctx._temp : new HashMap();
if (ctx.host?.os?.type != null) {
ctx._temp.os_type = ctx.host.os.type;
ctx.remove('host');
ctx.host = [:]; ctx.host.os = [:];
ctx.host.os.type = ctx._temp.os_type;
ctx.remove('_temp');
} """,
        "description": "Example 1 to retain a field for the lookup index - host.os.type"
      }
    },
    {
      "script": {
        "if": "ctx.tags!= null && ctx.tags.contains('powershell_scriptblock_reduction') && (ctx.user?.id != null)",
        "source": """
if (ctx.user instanceof Map) {
def userFieldsToKeep = ['id']; ctx.user.keySet().removeIf(key -> !userFieldsToKeep.contains(key));
}""",
        "description": "Example 2 to retain a field for the lookup index - user.id"
      }
    },
    {
      "script": {
        "if": "ctx.tags!= null && ctx.tags.contains('powershell_scriptblock_reduction') && (ctx.file?.name != null || ctx.file?.path != null || ctx.file?.directory != null)",
        "source": """
if (ctx.file instanceof Map) {
def fileFieldsToKeep = ['name', 'path', 'directory']; ctx.file.keySet().removeIf(key -> !fileFieldsToKeep.contains(key));
}""",
        "description": "Retain field for the lookup index - file.name, file,path, file.directory"
      }
    },
    {
      "remove": {
        "ignore_missing": true,
        "field": [
          "winlog",
          "log",
          "agent",
          "powershell.sequence",
          "powershell.total",
          "cloud",
          "elastic_agent",
          "data_stream",
          "message",
          "_temp",
          "input",
          "powershell.file.script_block_id"
        ],
        "if": "ctx.tags!= null && ctx.tags.contains('powershell_scriptblock_reduction')",
        "description": "Remove unnecessary fields from the lookup index"
      }
    },
    {
      "script": {
        "if": "ctx.tags!= null && ctx.tags.contains('powershell_scriptblock_reduction') && ctx.powershell?.file?.script_block_hash!= null",
        "source": "ctx._id = ctx.powershell.file.script_block_hash",
        "description": "Specific the id for the unique script_block_text based on hash"
      }
    },
    {
      "remove": {
        "ignore_missing": true,
        "field": "fields.duplicated",
        "if": "ctx.fields?.duplicated!= null",
        "description": "Remove metadata used to indicate the original event"
      }
    }
  ]
}Expert insight: Logstash processing
You may know that Logstash can perform the same processing as the ingest pipeline. This solution used the @custom ingest pipeline to automatically target PowerShell operational logs and inherit the hashing operations and other data processing from the Windows integration. If you want to perform the processing with Logstash instead, ensure that you perform the hashing process in a consistent way so that the data can match (hashing algorithm, output format, etc.).
Step 5: Reconstructing context with ES|QL
After implementation, your primary data stream contains lean events, and the lookup index holds a unique set of nonsegmented PowerShell scripts. The final step is bringing this context together during analysis. This is where ES|QL LOOKUP JOIN shines.
An analyst can now run a simple piped query to investigate PowerShell activity, seamlessly enriching the lean events with the full script text from the lookup index.
Let's break down what we will do with the query:
FROM logs-windows.powershell_operational-default_reduced*: We start by querying our primary lean event data.
LOOKUP JOIN... ON powershell.file.script_block_hash: This is the key operation. For each event, it looks for a document in our lookup index where the _id (which we set to the hash) matches the event's hash — powershell.file.script_block_hash.
When a match is found, all fields from the lookup document — most importantly, powershell.file.script_block_text — are added to the results.
The duplicated metadata fields from the data stream are renamed to prevent them from being overwritten and renamed back to their original names.
FROM logs-windows.powershell_operational-default_reduced*
| WHERE powershell.file.script_block_hash IS NOT NULL
| RENAME @timestamp AS original_timestamp, user.id AS original_user.id, file.name AS original_file.name, file.path AS original_file.path, file.directory AS original_file.directory
| LOOKUP JOIN logs-windows.powershell_operational_lookup-default-2025.06.26-000004 ON powershell.file.script_block_hash
| RENAME @timestamp AS lookup_timestamp, original_timestamp AS @timestamp, original_user.id AS user.id, original_file.name AS file.name, original_file.path AS file.path, original_file.directory AS file.directoryExample query result below:
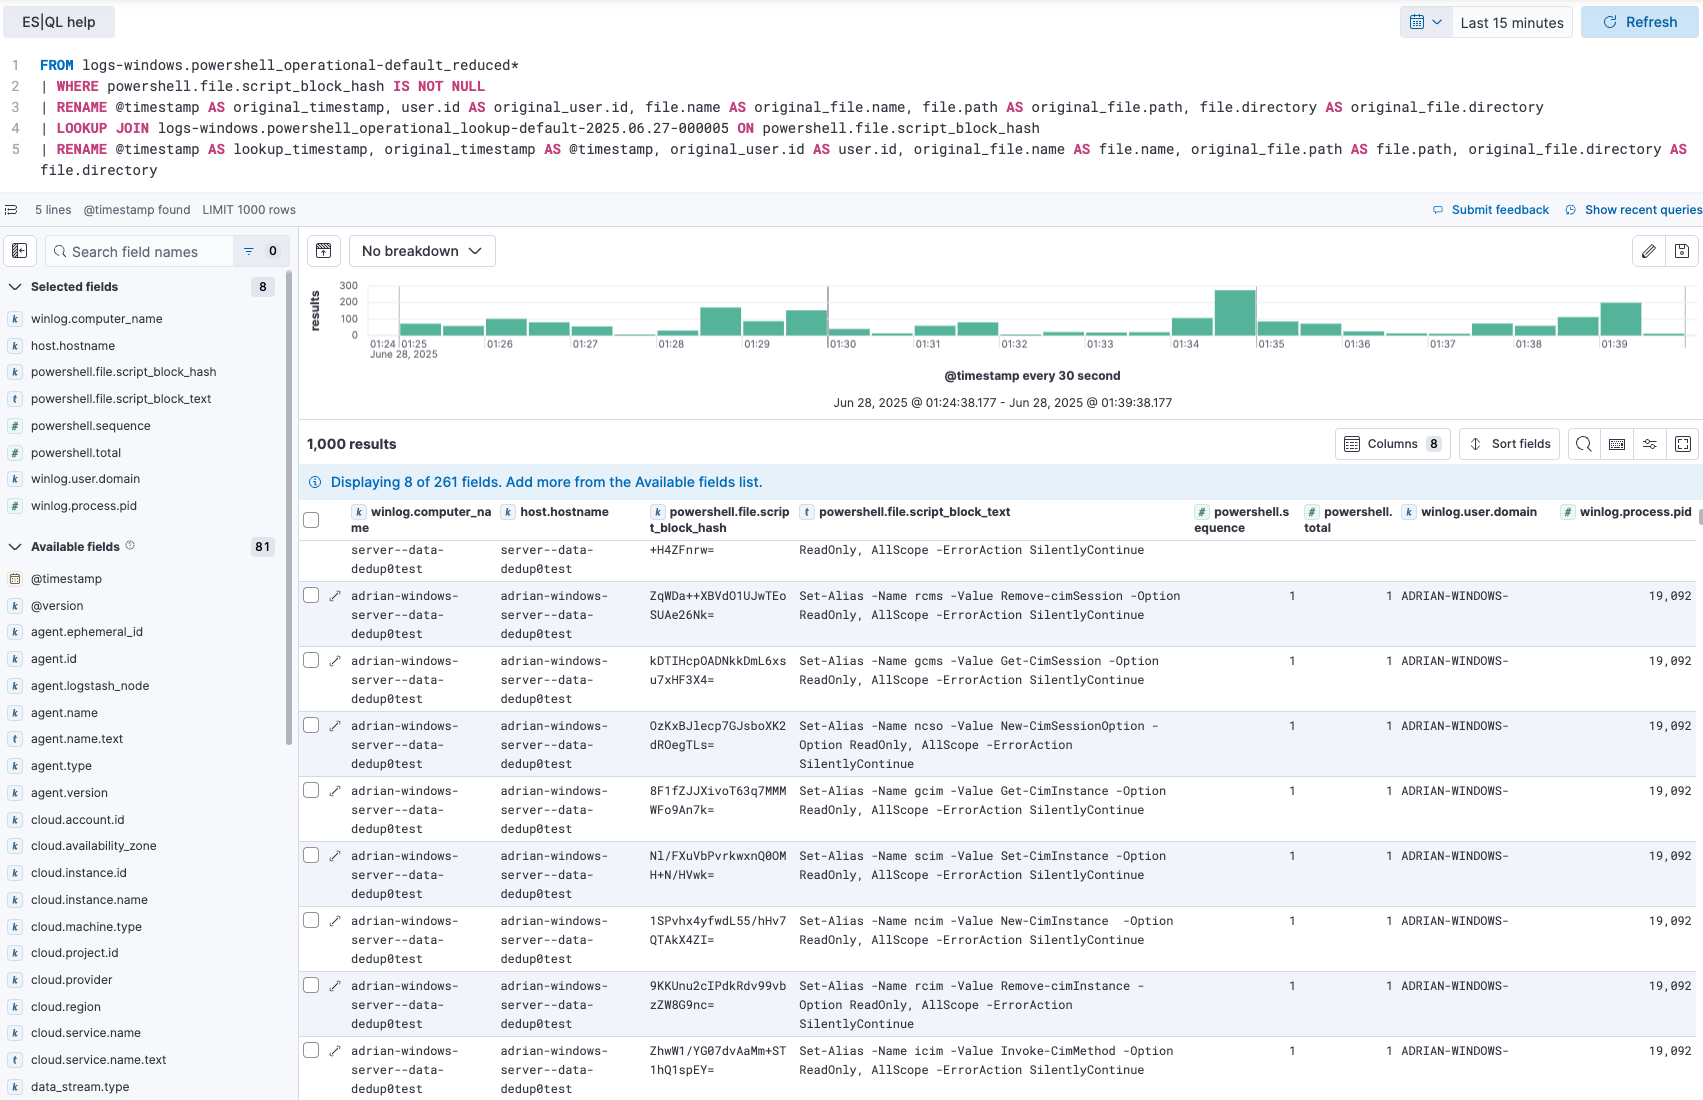
This capability is invaluable for both security analysts and site reliability engineers (SREs). An SRE troubleshooting a system can see the exact script that was executed during an incident. A security analyst investigating a detection alert can instantly retrieve the full, deobfuscated malicious script for forensic analysis just as they would have before but now with a much more cost-effective data store.
A particularly powerful aspect of this design is the naming convention of the lookup index: logs-windows.powershell_operational_lookup-default. Elastic Security's prebuilt detection rules are designed to run against specific index patterns, such as logs-windows.powershell*. Because our lookup index name matches this pattern, the detection rules will automatically scan it. This means that rules looking for suspicious content in PowerShell scripts will continue to function perfectly, analyzing the complete, deduplicated set of script bodies. This clever design choice ensures that we achieve massive data reduction without creating a blind spot for our automated security analytics.
A common concern with data reduction is the risk of creating blind spots. This architecture cleverly avoids that risk.
This design has a key implication for the analyst's workflow. The timestamp on a document in the lookup index reflects the last time that the script was seen. If a detection rule alerts on malicious content in the lookup index, the analyst has the “what” (the script text). Their next step is to use the powershell.file.script_block_hash from the alert to pivot to the primary ...-default_reduced data stream. There, they will find every single execution of that script with the correct original timestamp, host, and user context, enabling a complete forensic investigation. This two-step process — detecting unique content and investigating across all executions — is incredibly powerful.
A glimpse into smarter logging
This "hash, store, join" pattern demonstrates a powerful way to break the stalemate between security visibility and data costs. It should be viewed as a reusable blueprint for any high-volume log source with bulky or repetitive data, such as API payloads or application stack traces.
For teams looking to take their data optimization to the next level, this technique can be layered with other Elastic Stack features. After using this method to remove high-volume, repetitive content, you can enable Elasticsearch logsdb index mode index mode on your primary data stream (this is enabled by default on clusters 9.0 and later). Logsdb index mode is a specialized storage mode that further reduces the disk footprint of structured log data through advanced compression and data structuring techniques. By combining content-aware deduplication with logsdb index mode and a sound ILM policy, architects can build a sophisticated, multilayered data management strategy that balances cost, performance, and accessibility for the modern, data-driven enterprise.
Take the first step today
Review and understand your data to see if this solution is applicable in your environment and explore the amazing data storage and analytics options from Elastic like ES|QL query engine, time series data stream (TSDS), and logsdb index mode.
The release and timing of any features or functionality described in this post remain at Elastic's sole discretion. Any features or functionality not currently available may not be delivered on time or at all.
Share
- Share on Twitter
Share on Twitter
- Share on LinkedIn
Share on LinkedIn
- Share on Facebook
Share on Facebook
- Share by Email
Share by Email
- Print this page
Print