Prometheus monitoring
Scale Prometheus without the operational debt — 30x faster, 2.5x less storage
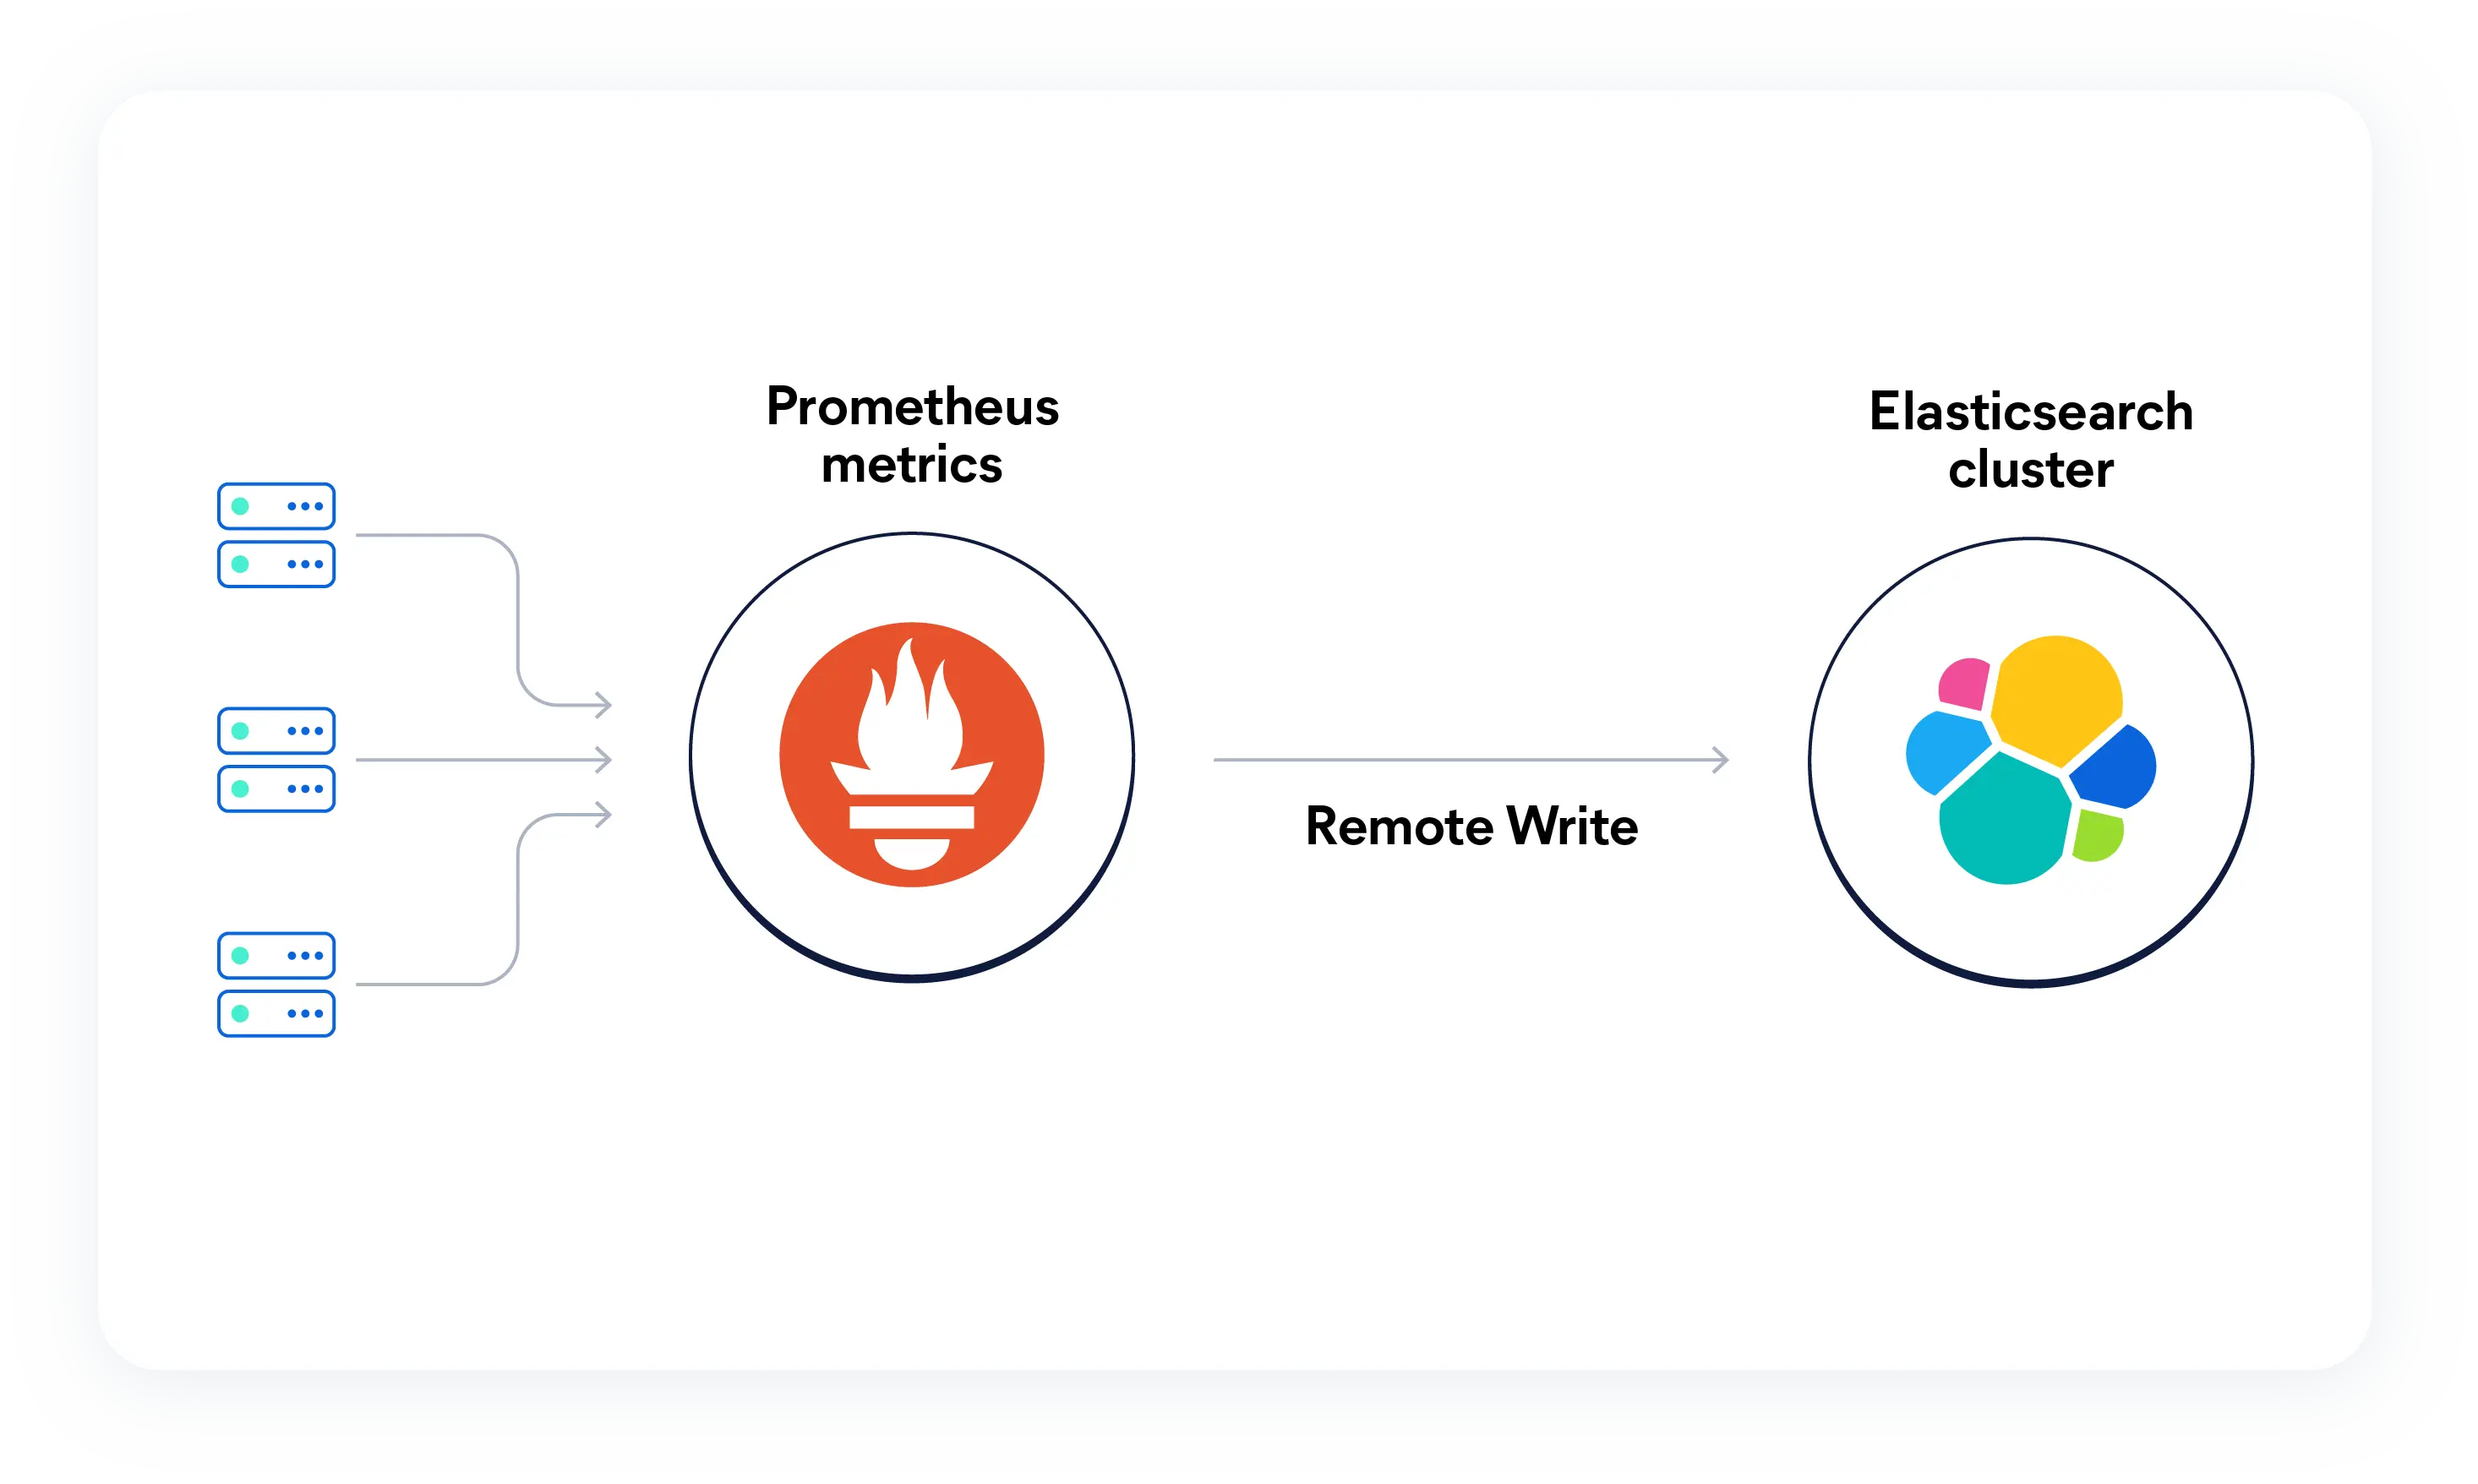
Natively ingest Prometheus metrics into Elasticsearch and run PromQL queries directly in Kibana. Unify high-cardinality time series data with logs and traces for full stack observability that's AI-driven, scalable, and open by design.
Elasticsearch: Best-in-class efficiency for metrics
Our TSDB outpaces Prometheus in ingestion and query speed at any scale.
Prometheus + Elasticsearch
Elastic pairs your Prometheus metrics with the industry's richest log analytics solution. Keep the PromQL workflows you love, but boost them with log correlation and agentic AI. Instead of manual dashboard-diving, let AI interrogate your metrics and logs to surface answers in seconds.
Stop duct-taping your observability stack
SREs are tired of the operational overhead of scaling Prometheus and the context‑switching required to resolve incidents using siloed signals. Elastic brings it all together in a single, high‑performance platform.


The Prometheus tax is officially optional
Managing and scaling Prometheus shouldn't feel like a second job. Elastic's unified datastore enables long-term retention without trading off performance for cost.
Elasticsearch
Prometheus / Mimir / ClickHouse
Native Prometheus and PromQL means no lock-in, rewrites, or months-long migration project.
Long-term storage and scaling for Prometheus often requires additional backends like Mimir and Clickhouse.
While Mimir supports PromQL, ClickHouse requires a translation layer.
Natively stores Prometheus and OTel in a single high-performance time series datastore. No semantic changes, no proprietary layers.
Prometheus requires an OTel Collector with explicit conversion.
ClickHouse supports OTel but requires custom schema work and pipeline configuration.
Correlate metrics, logs, and traces in one platform with one query language (ES|QL), without switching tabs or context. PromQL statements can be included as part of ES|QL queries.
Metrics and logs live in separate backends, requiring context-switching between tools and query languages during incidents.
ClickHouse can store all three signal types but requires significant custom schema and pipeline work to get there.
Columnar on-disk storage means no in-memory cardinality ceiling. Scale to high-cardinality Kubernetes and cloud environments without OOM walls.
Prometheus and Mimir use an in-memory inverted index — cardinality spikes cause OOM crashes at the worst possible time.
Outperforms Prometheus and Mimir by 10x–25x+ across most query types, at both low and high cardinality.
ClickHouse handles cardinality better but requires significant tuning at scale.
Built-in automatic downsampling. Full-resolution data stays searchable. Superior compression reduces your storage footprint without any manual work or data loss.
Mimir has no built-in downsampling. Managing long-term retention requires manual recording rules that permanently destroy granularity.
ClickHouse requires custom TTL and aggregation pipelines.
Predictable pricing with long-term retention at full resolution — no cardinality penalties, no forced roll-ups.
Scaling Prometheus and Mimir means trading cost for performance: pay more to retain data longer, or downsample and lose granularity.
ClickHouse requires constant tuning to balance query speed against storage spend.
Full capability across Elastic Cloud, self-managed, and hybrid deployments.
Prometheus and Mimir are self-managed only, with significant operational overhead at scale.
ClickHouse requires substantial infrastructure expertise to operate.
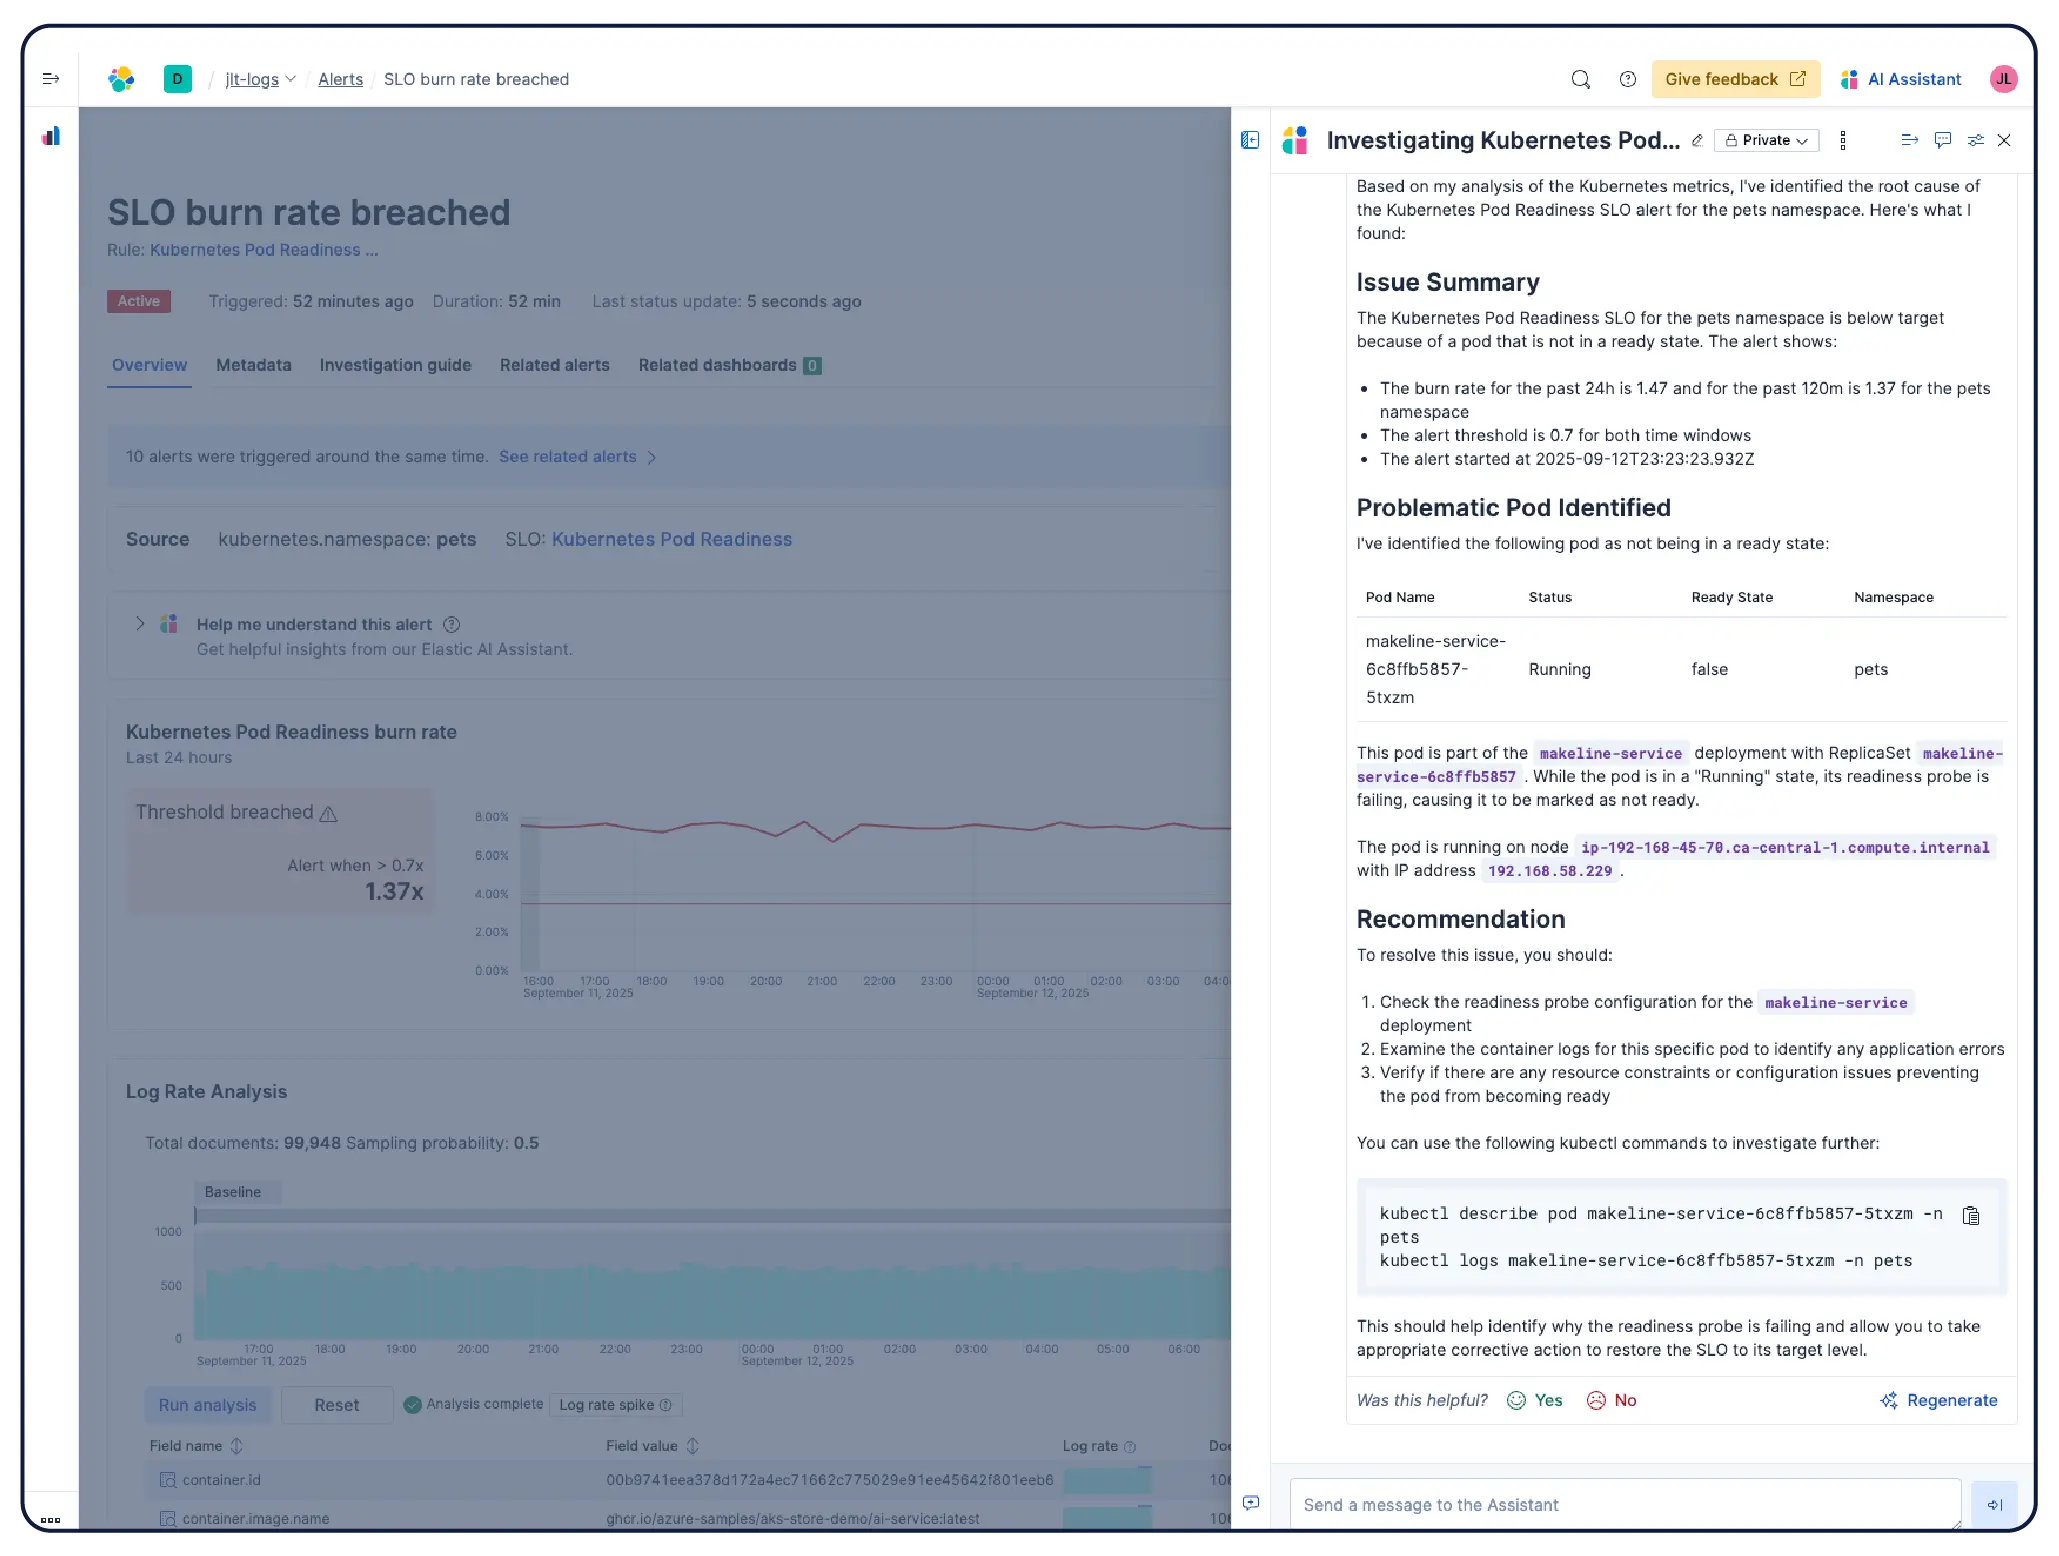
AI analyzes your metrics, logs, and traces to quickly surface root causes and guide remediation — no manual dashboard-diving required.
Grafana's AI assistant operates across fragmented backends, rather than a single unified datastore.
ClickHouse has no native agentic AI. Investigation depends on correlation across disconnected tools and data silos.
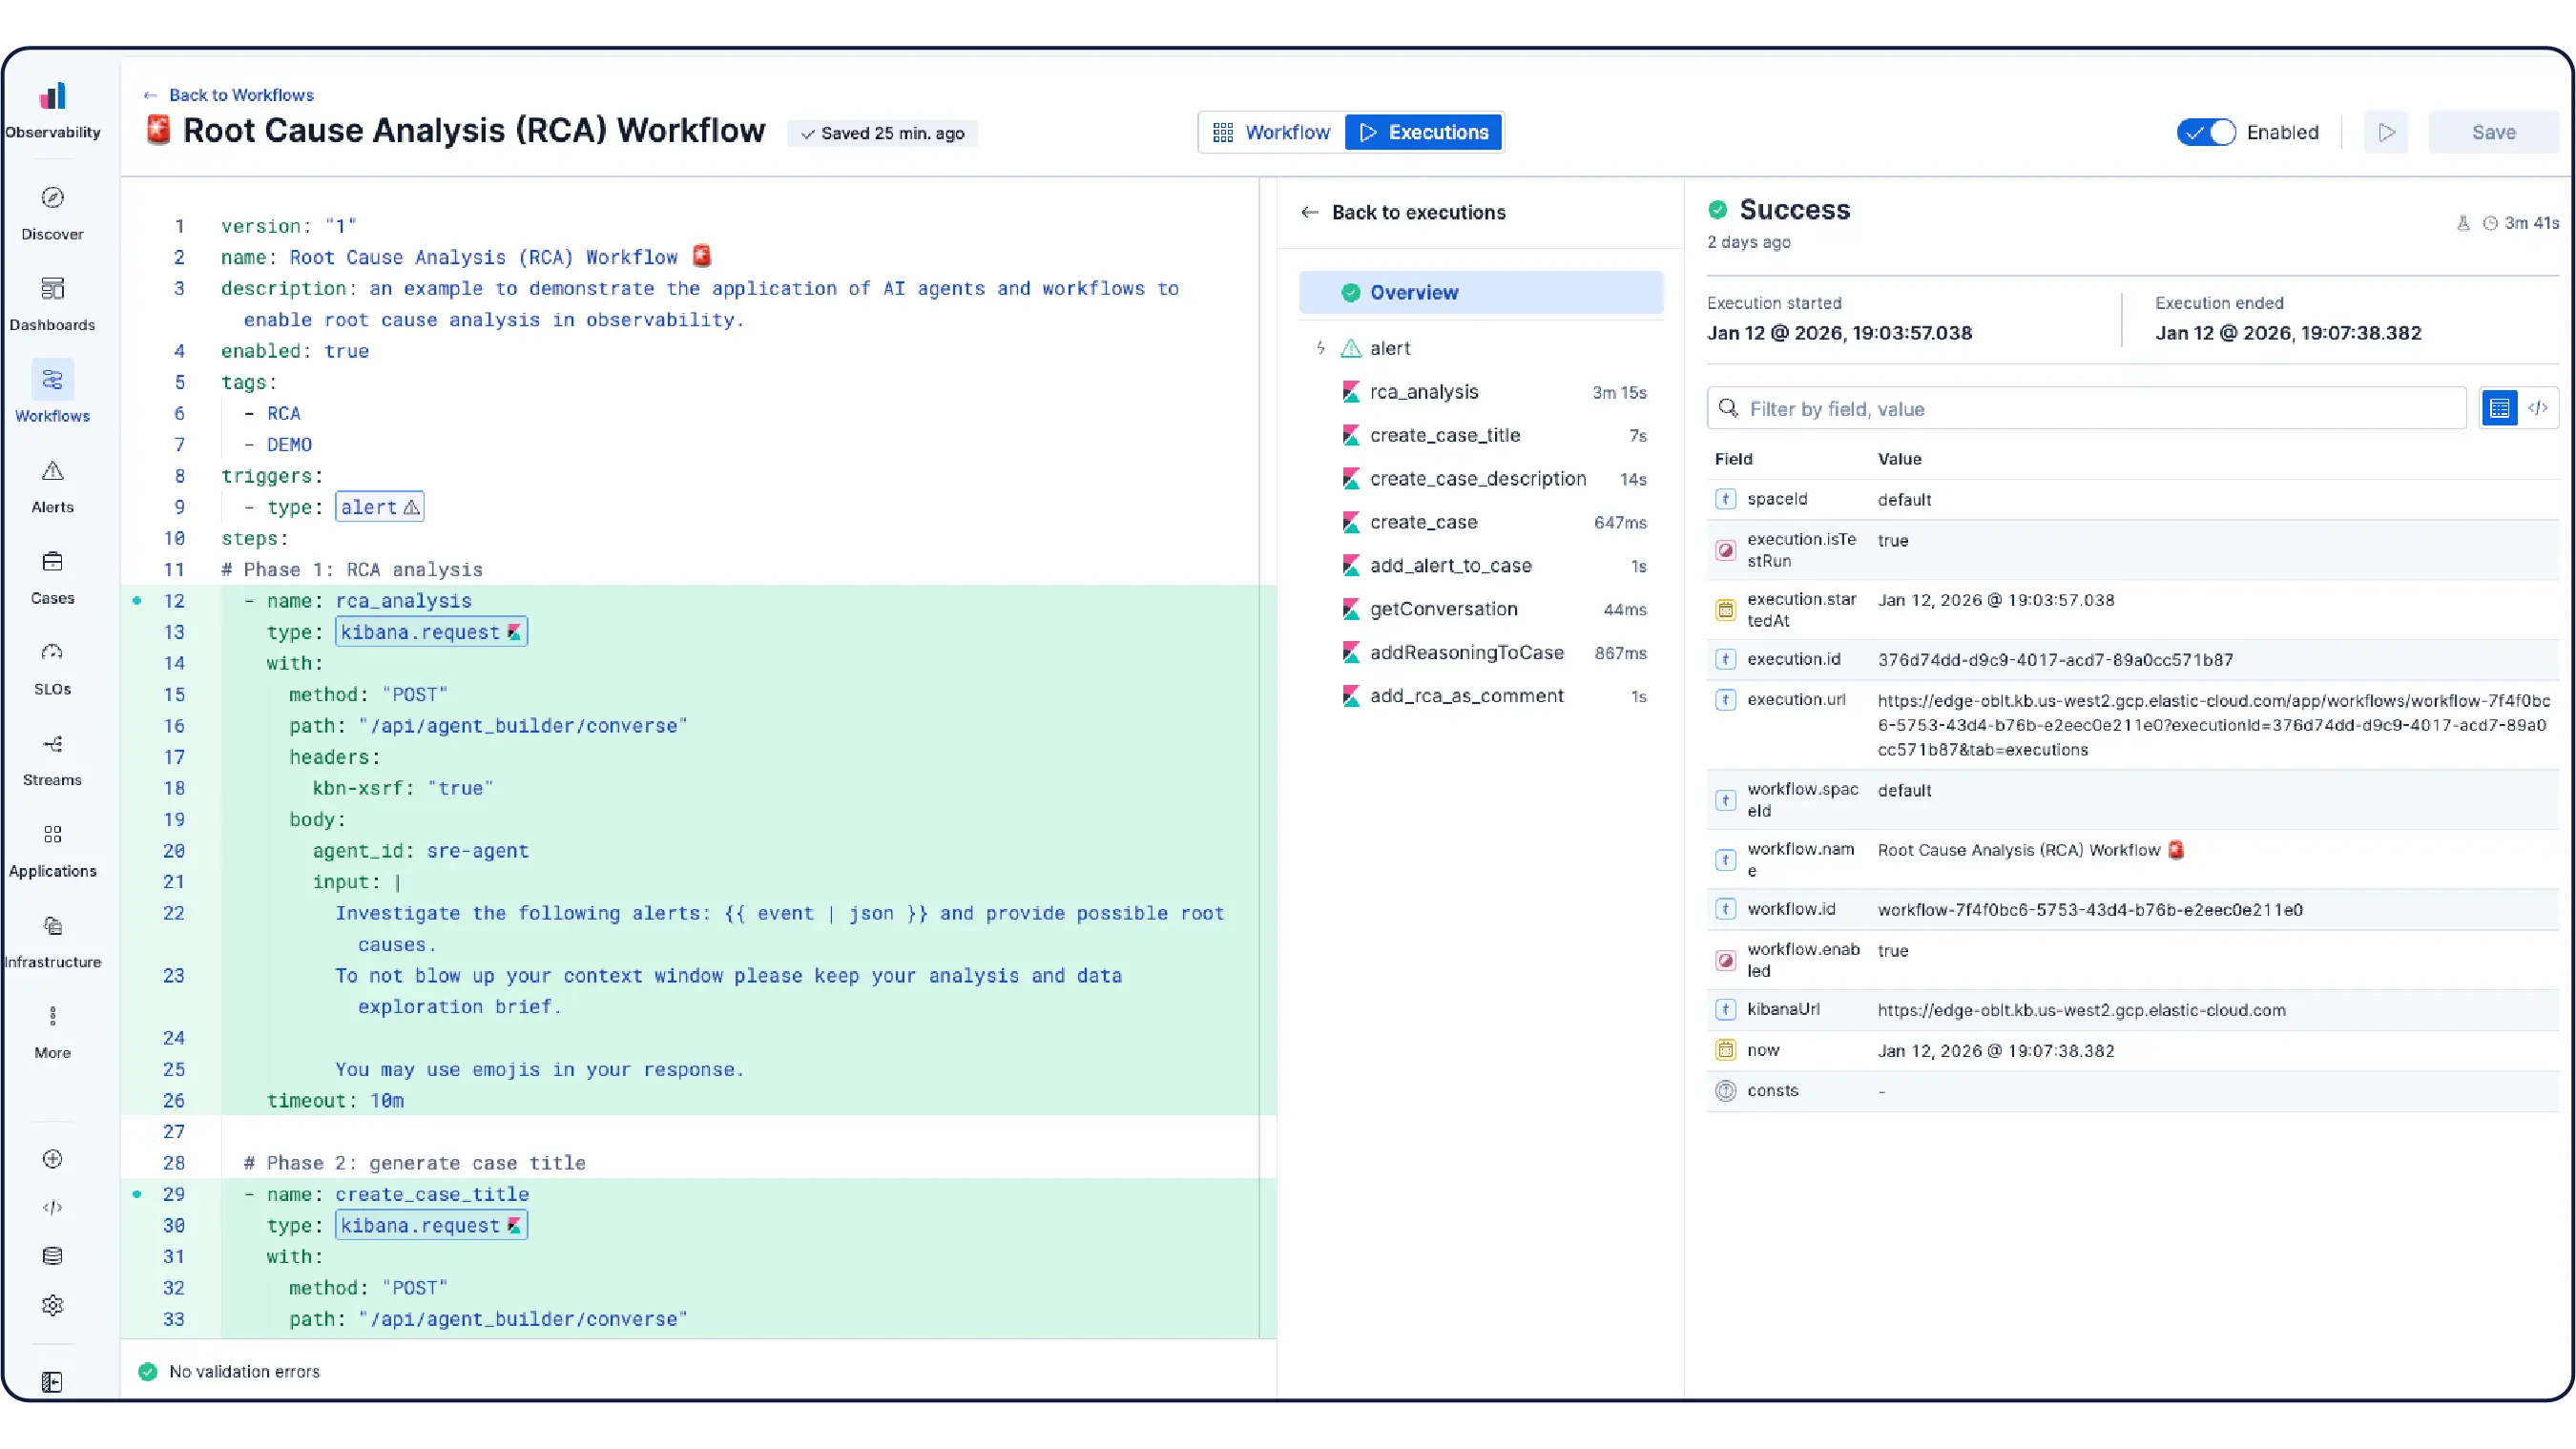
Turn infrastructure data into action
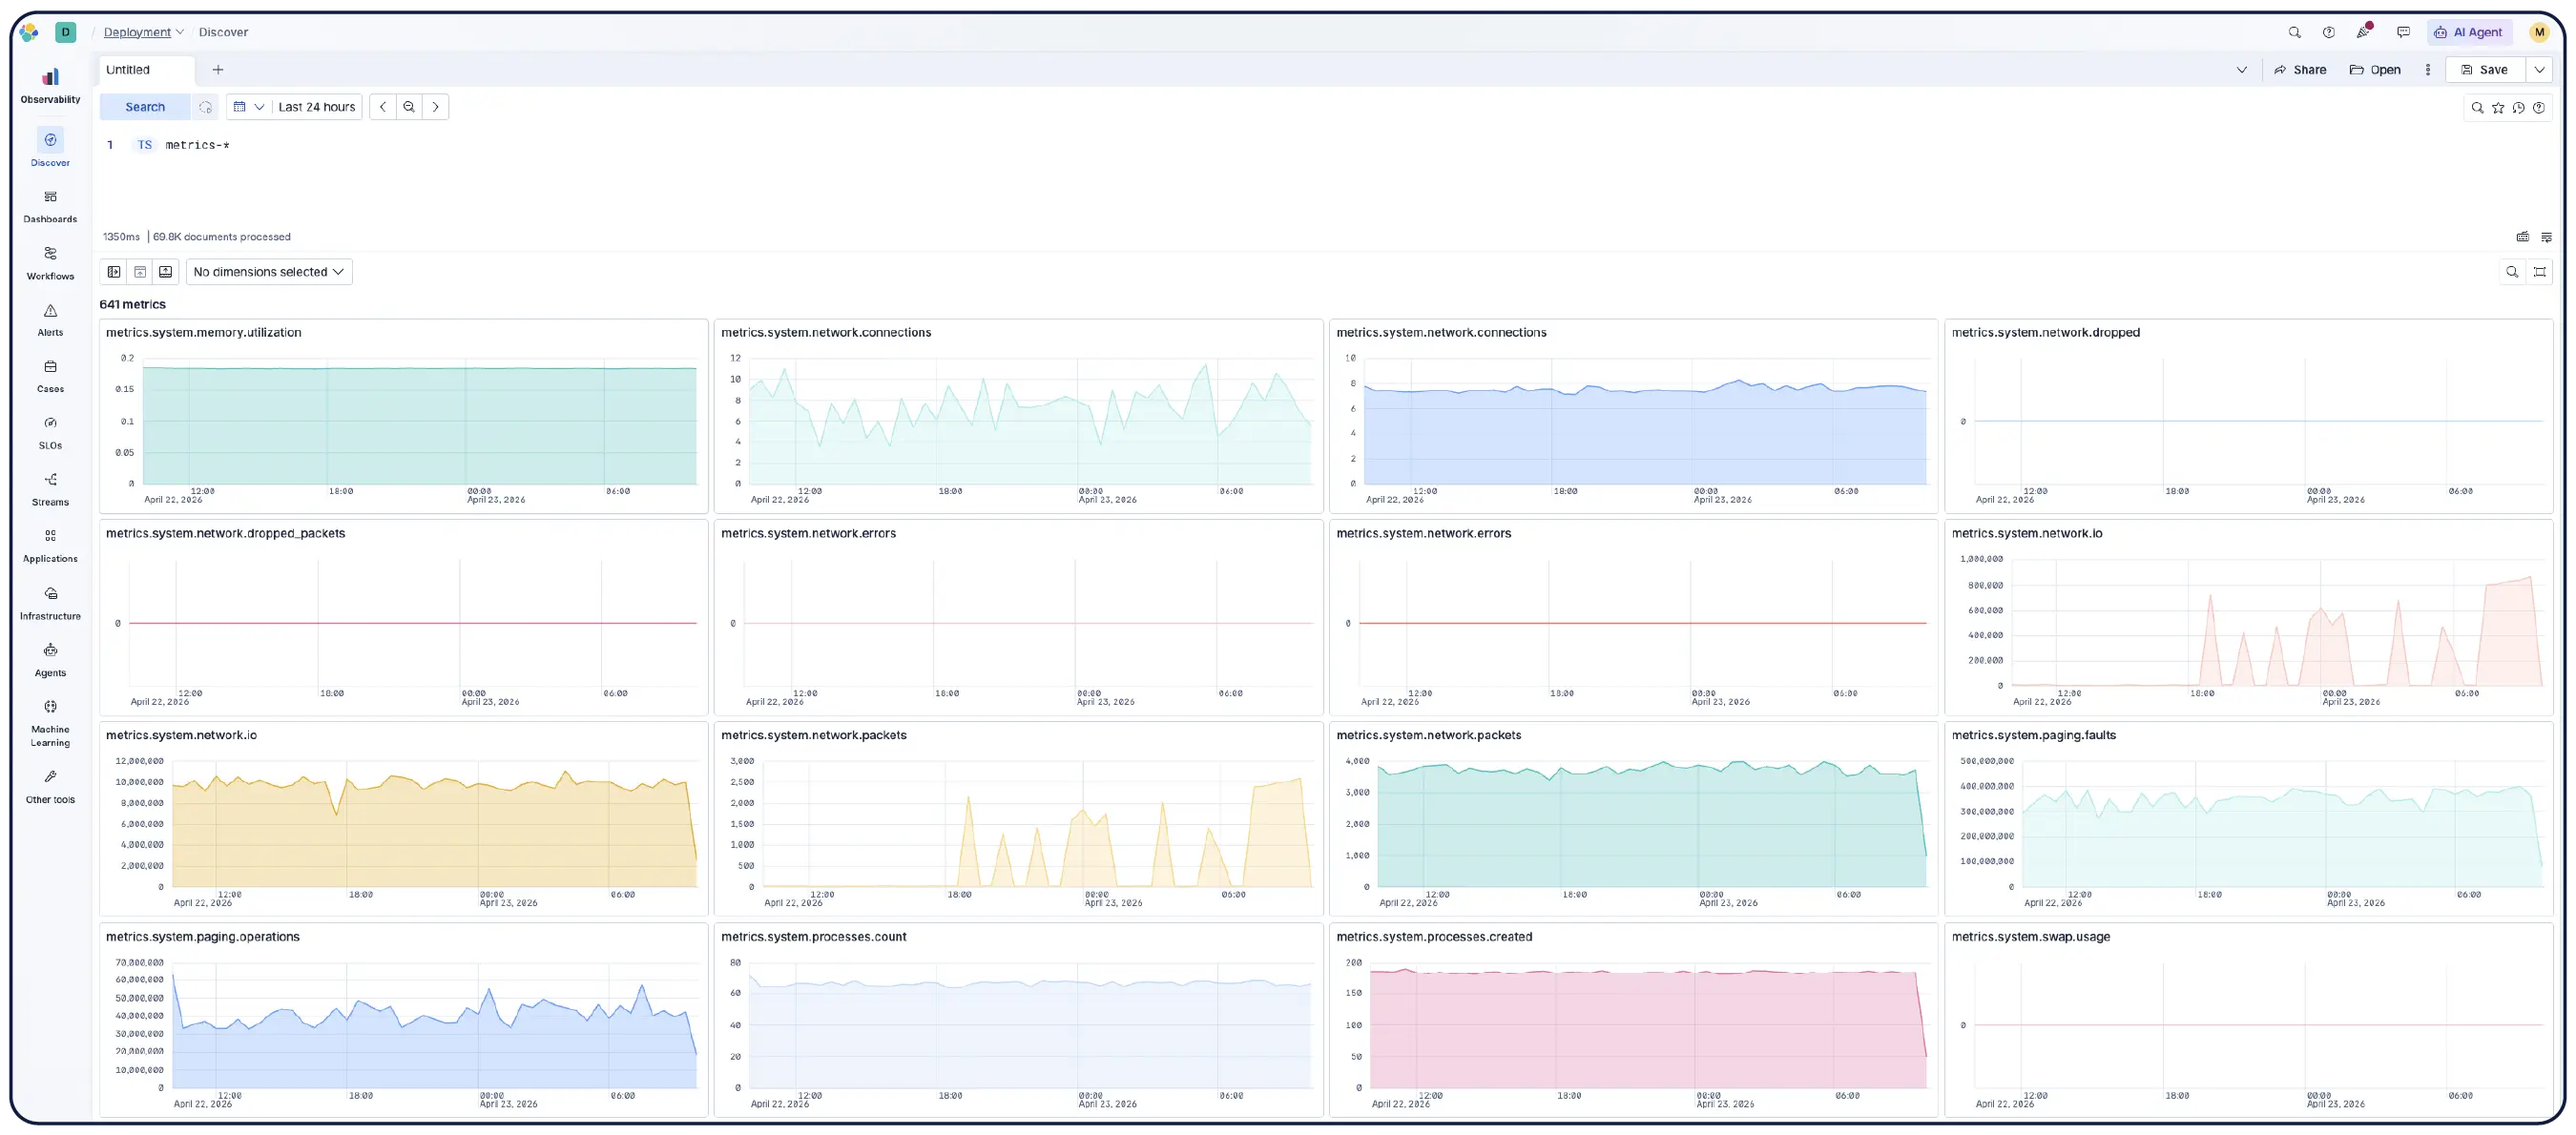
Monitor your infrastructure at scale. AI-led investigations highlight anomalies, uncover trends, and automate remediation — so you can plan capacity and resolve issues faster.
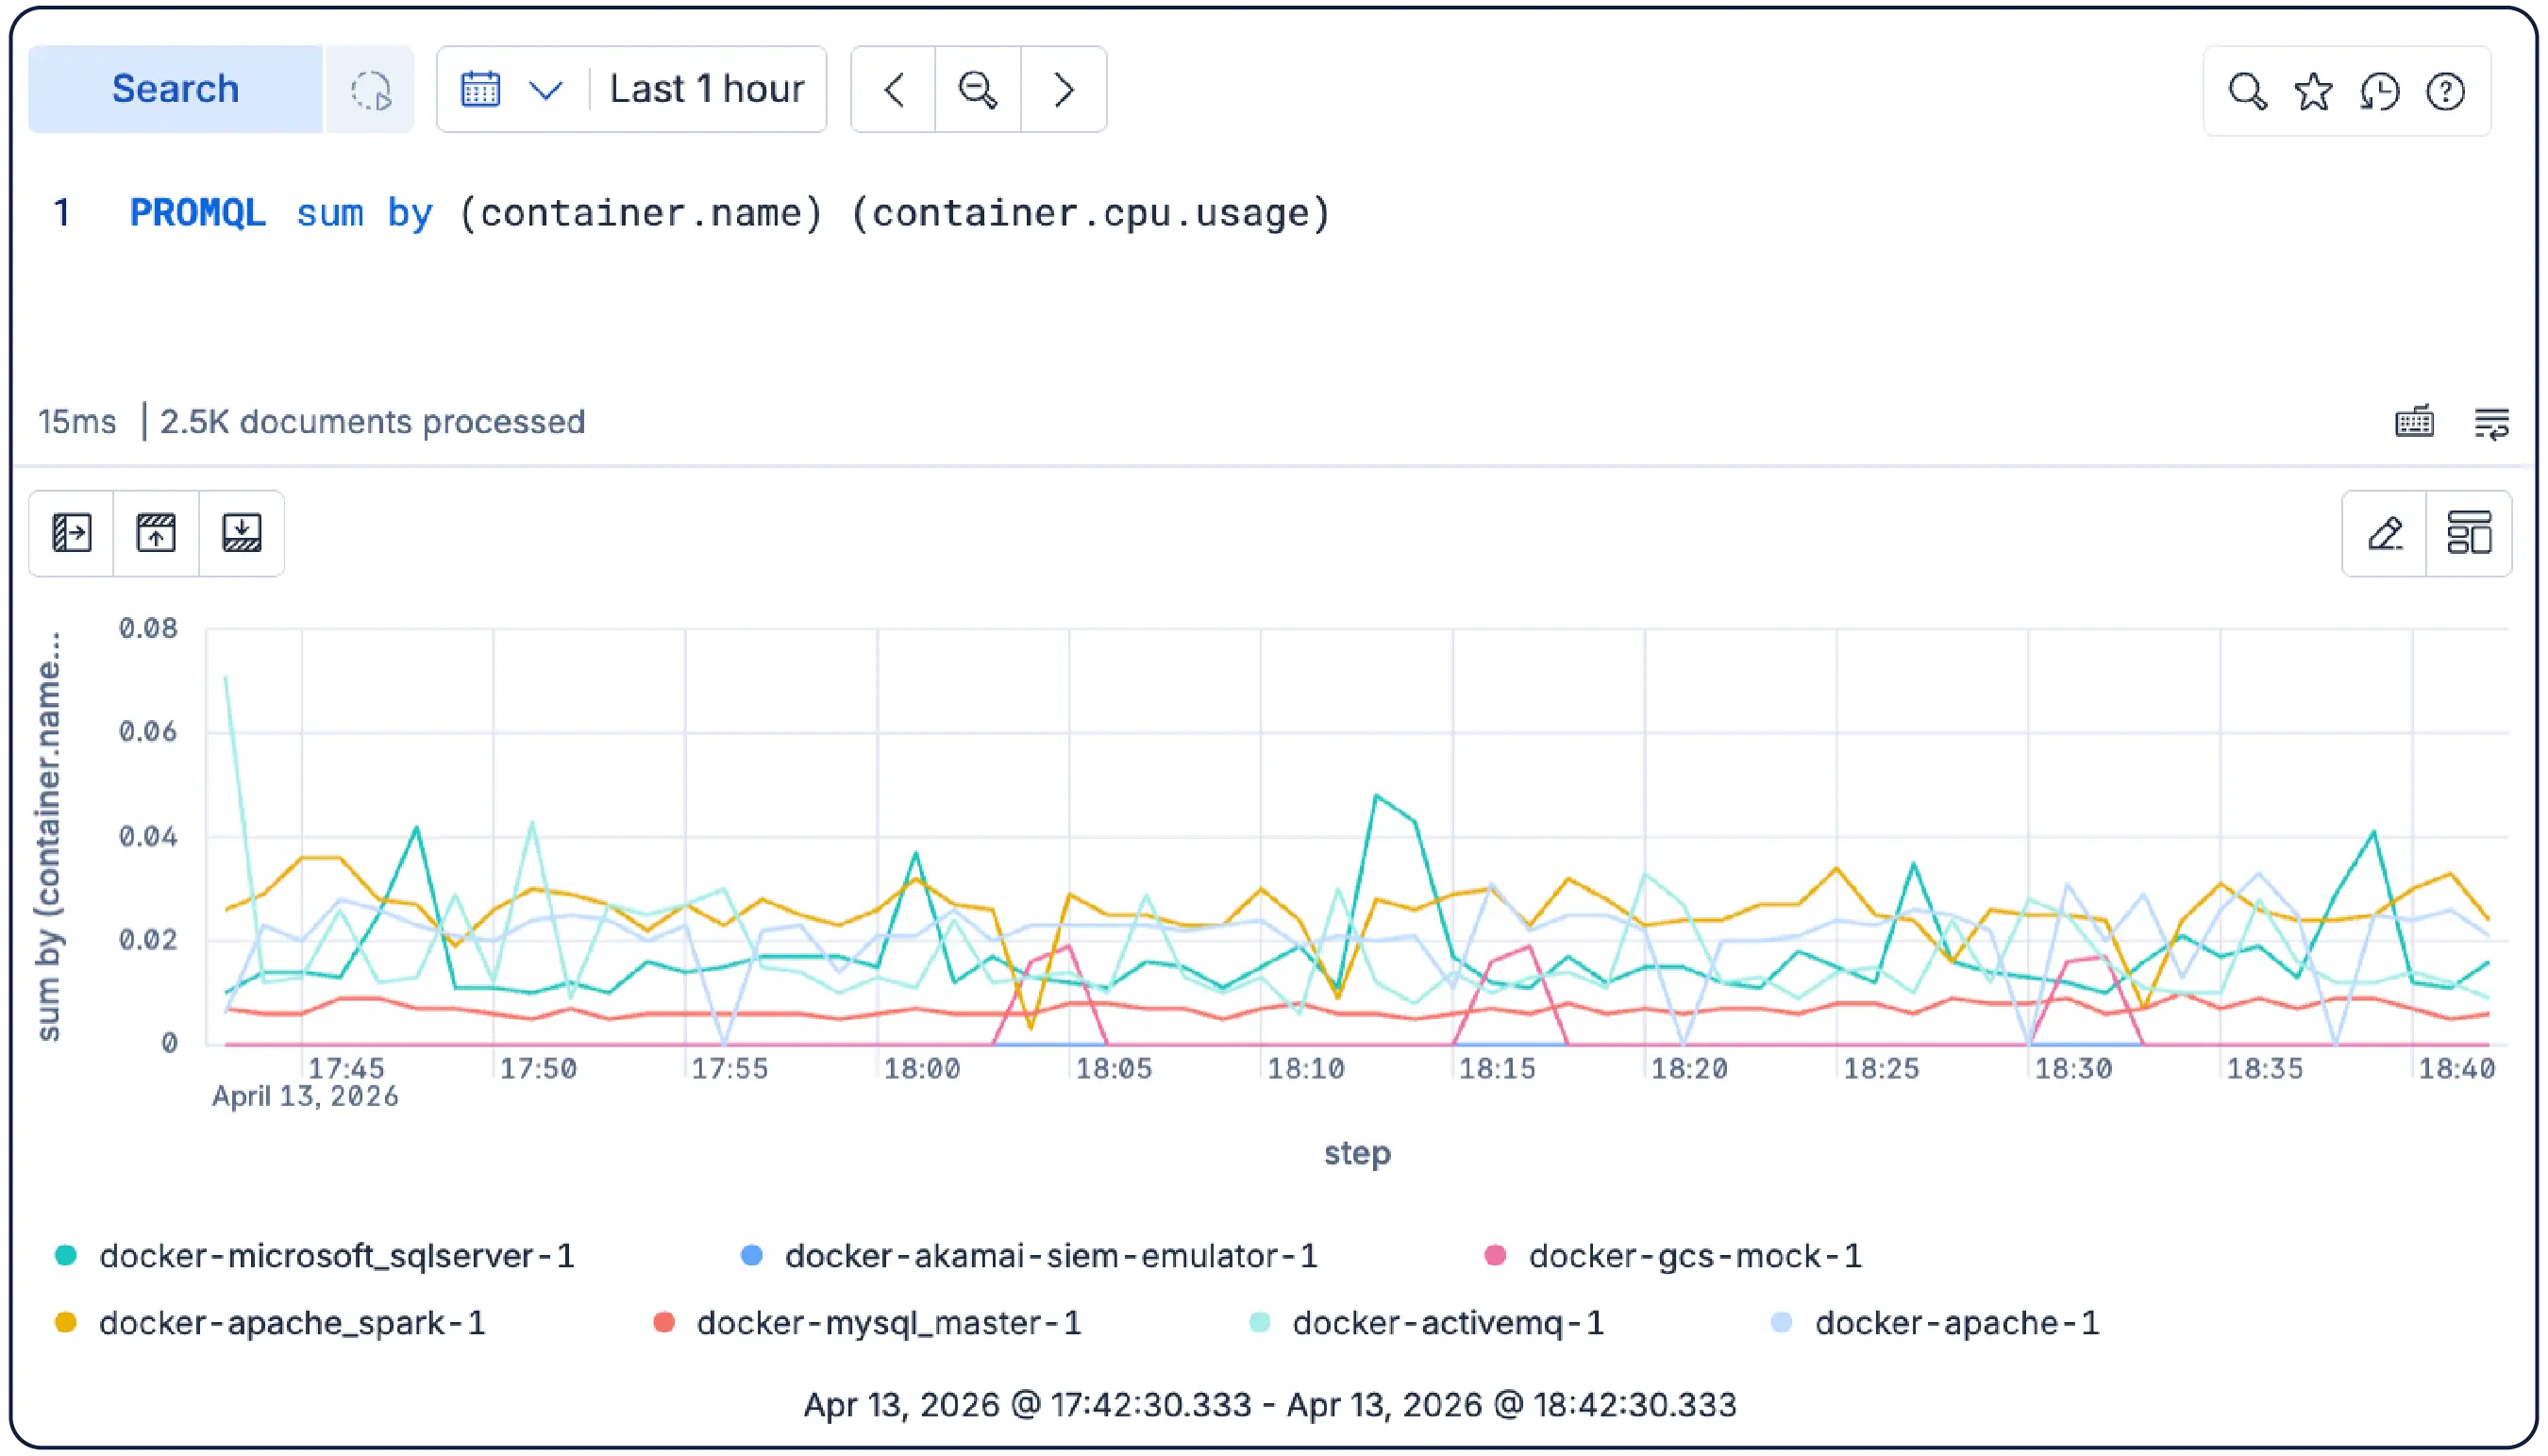
Run PromQL queries directly in Kibana — no translation layer or rewrites necessary. Rate, sum by, max_over_time, and other common functions work as-is alongside ES|QL.
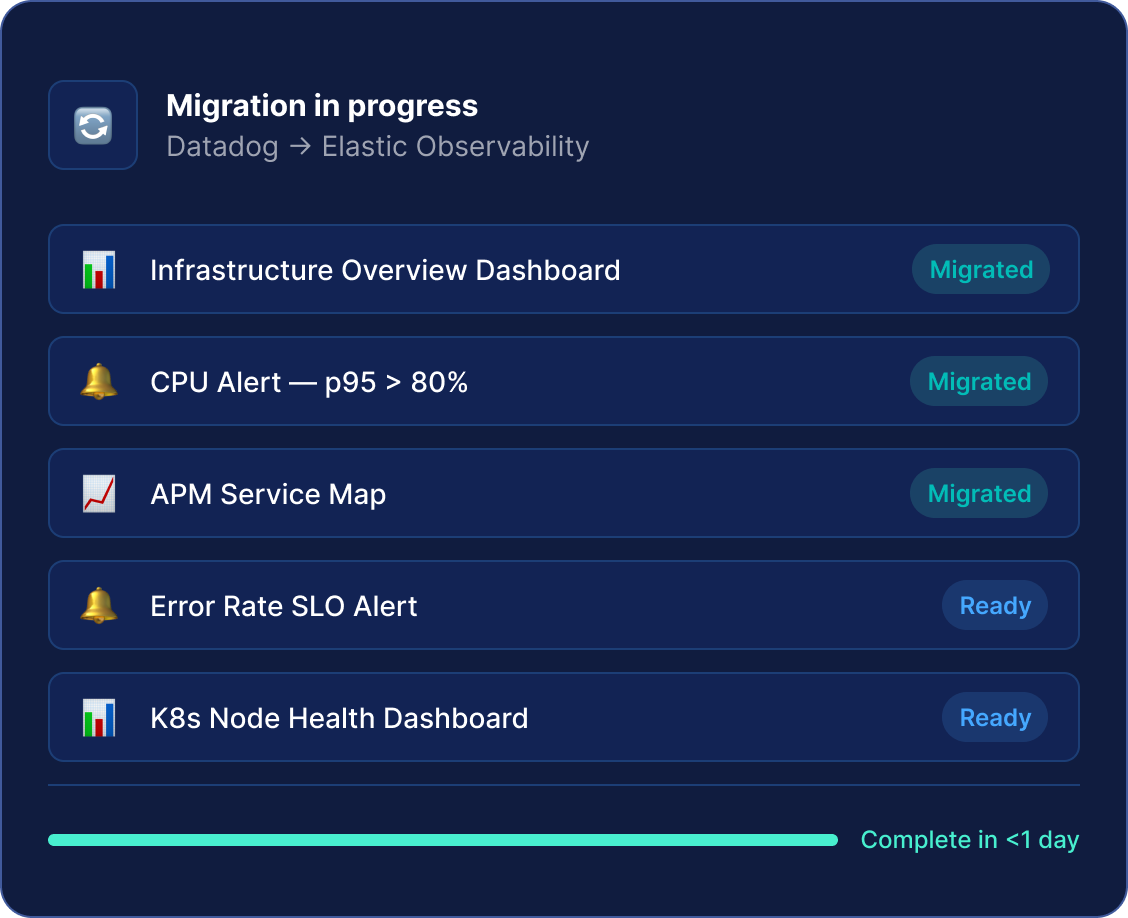
Migration tool — tech preview
Migrate from Grafana overnight
Automatically convert dashboards and alerting rules from Grafana into Elastic, dramatically reducing the cost and complexity of switching platforms.
Frequently asked questions
What is Prometheus and Prometheus monitoring?
What is Prometheus and Prometheus monitoring?
Prometheus is an open source monitoring toolkit. Widely adopted in cloud-native and containerized environments, Prometheus is a popular tool for collecting time series data from instrumented jobs using an open, vendor-neutral, text-based exposition format.
Why should I move away from self-managed Prometheus?
Why should I move away from self-managed Prometheus?
Scaling Prometheus requires operational overhead that compounds over time. Managing backends like Mimir adds complexity without solving the underlying problem. Elastic handles the scaling so you don't have to. Plus, our columnar storage and vectorized processing deliver query speeds that outperform Prometheus and Mimir by 10x–25x+ across most query types.
Why store Prometheus metrics in Elasticsearch?
Why store Prometheus metrics in Elasticsearch?
Prometheus local storage is designed for short retention, typically 15 to 30 days. The Elasticsearch TSDB gives you efficient long-term storage (up to 2.5x more efficient than Prometheus) with automatic rollover, compression, and downsampling as data ages. Your existing scrape configs stay the same.
Do my existing Prometheus-native dashboards, alerts, and queries still work?
Do my existing Prometheus-native dashboards, alerts, and queries still work?
Yes. Native PromQL support means your existing Prometheus workflows carry over easily. No query rewrites or long transition projects are necessary.
How does Elastic reduce storage costs?
How does Elastic reduce storage costs?
Superior downsampling and compression slashes your storage footprint. Predictable, resource-based pricing means your bill doesn't spike when cardinality grows or when you add new labels. Keep every metric you need, at full resolution, for as long as you need it.
How does log correlation work with my metrics?
How does log correlation work with my metrics?
Elastic stores metrics and logs in the same platform, so you can query both together with ES|QL, without context-switching between different tools or tabs.
How does Agentic AI help with incident resolution?
How does Agentic AI help with incident resolution?
Instead of manually diving through dashboards, Elastic's agentic AI analyzes your observability data to guide investigations, surface root causes, and execute remediation workflows.
What does migration actually look like?
What does migration actually look like?
There is no months-long migration project. Native PromQL and OTel support means your existing ingest architecture, dashboards, and queries can be migrated overnight. Ask about our migration tools (currently in technical preview).
Join the chat
Connect to Elastic's global community and participate in open conversations and collaboration.


.jpg)