View field statistics
editView field statistics
editExplore the fields in your data with the Field statistics view in Discover and answer such questions as:
- What does the latency look like when one of the containers is down on a Sunday?
- Is the field type and format in the data view appropriate for the data and its cardinality?
Field statistics aren’t available when Discover is in ES|QL mode.
This example explores the fields in the sample web logs data, or you can use your own data.
- Go to Discover.
- Expand the data view dropdown, and select Kibana Sample Data Logs.
- If you don’t see any results, expand the time range, for example, to Last 7 days.
-
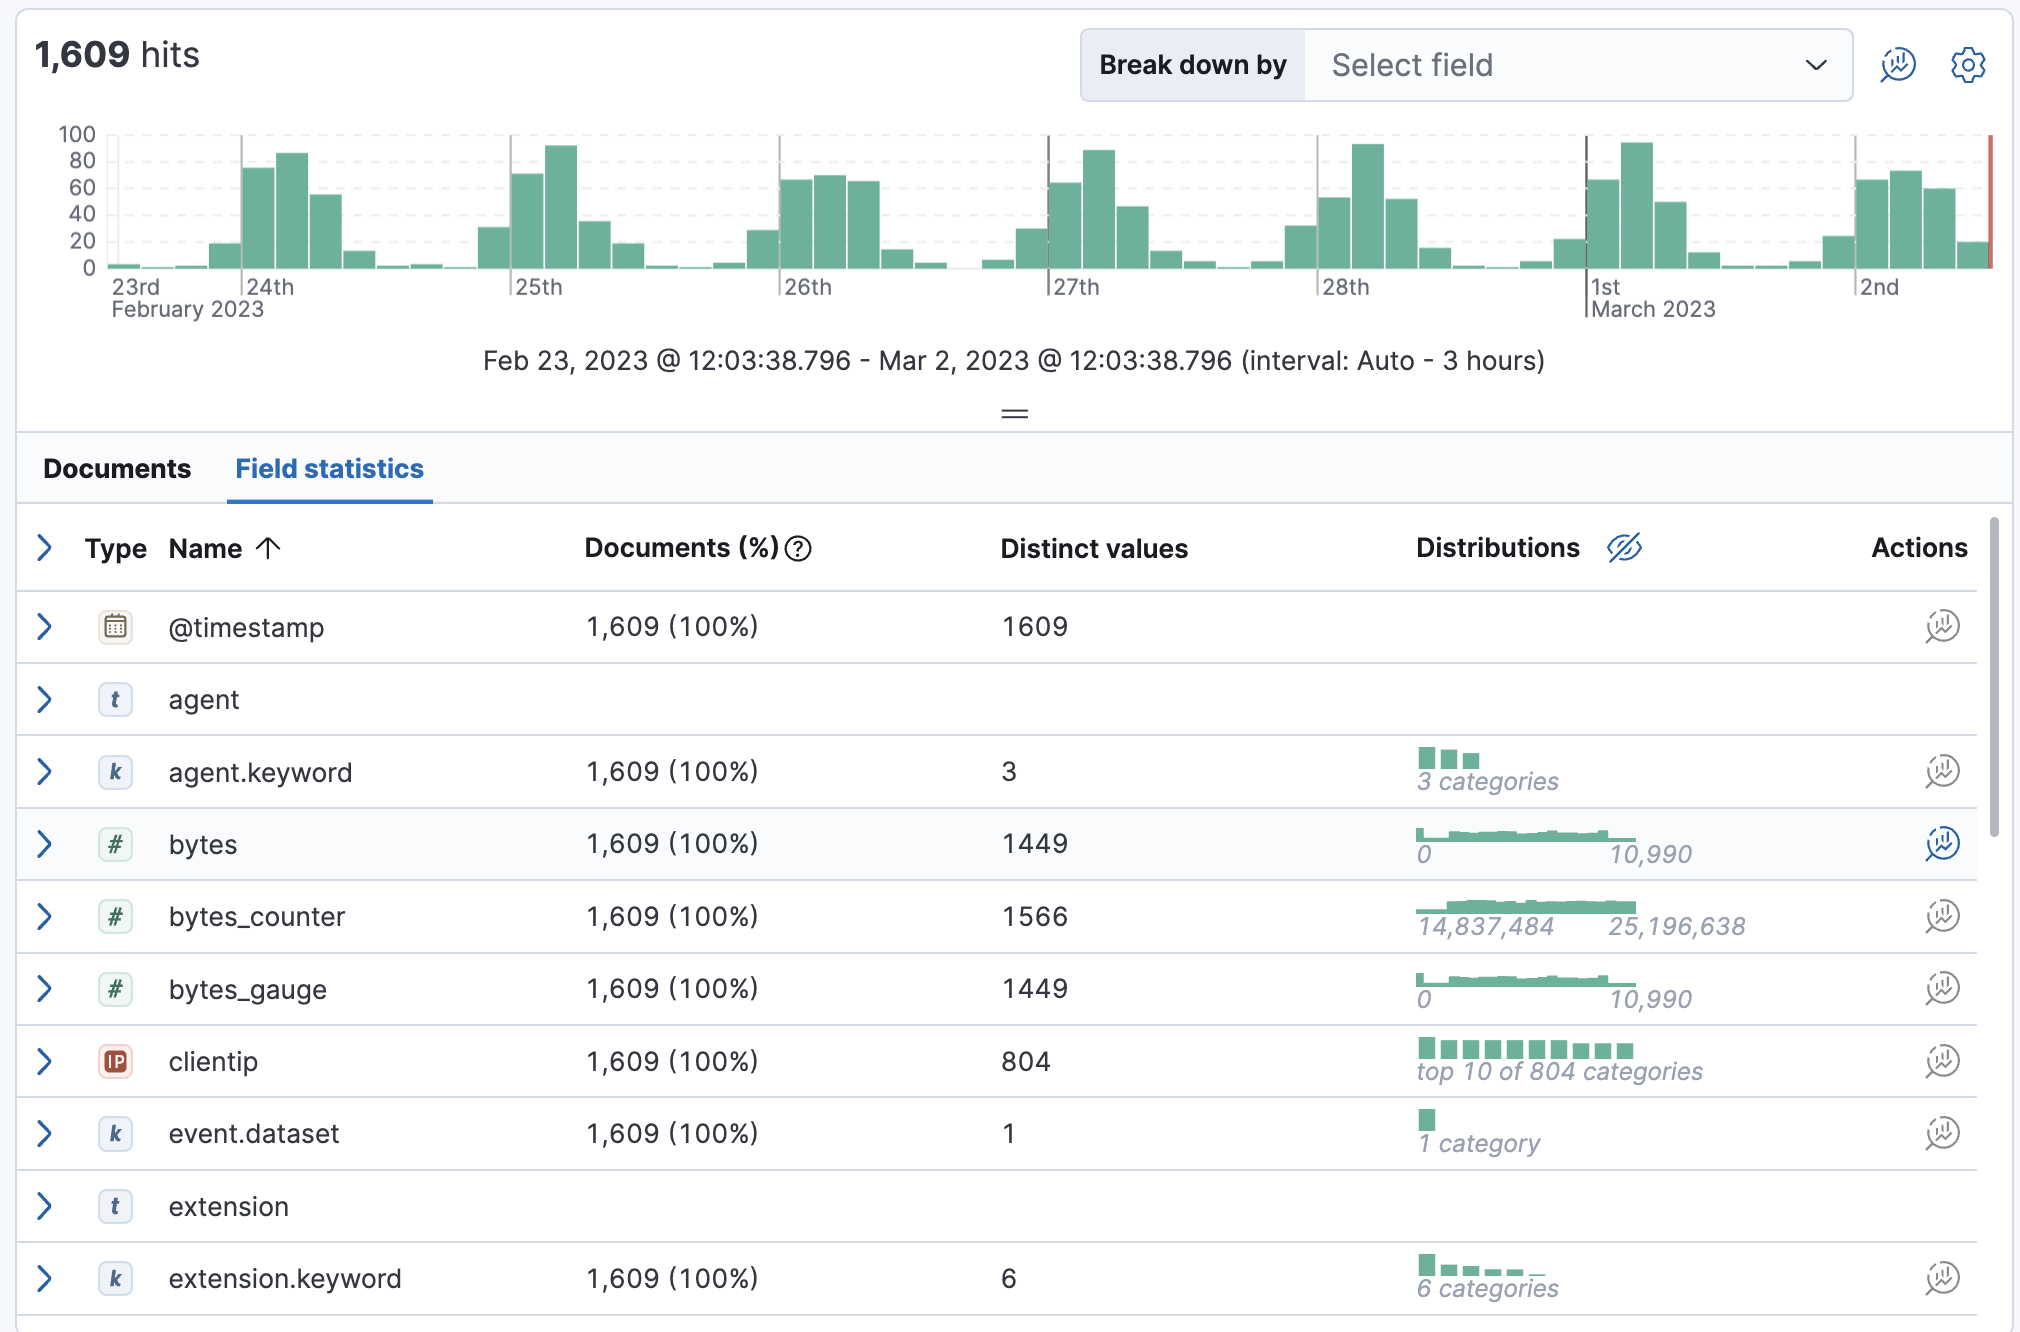
Click Field statistics.
The table summarizes how many documents in the sample contain each field for the selected time period the number of distinct values, and the distribution.
-
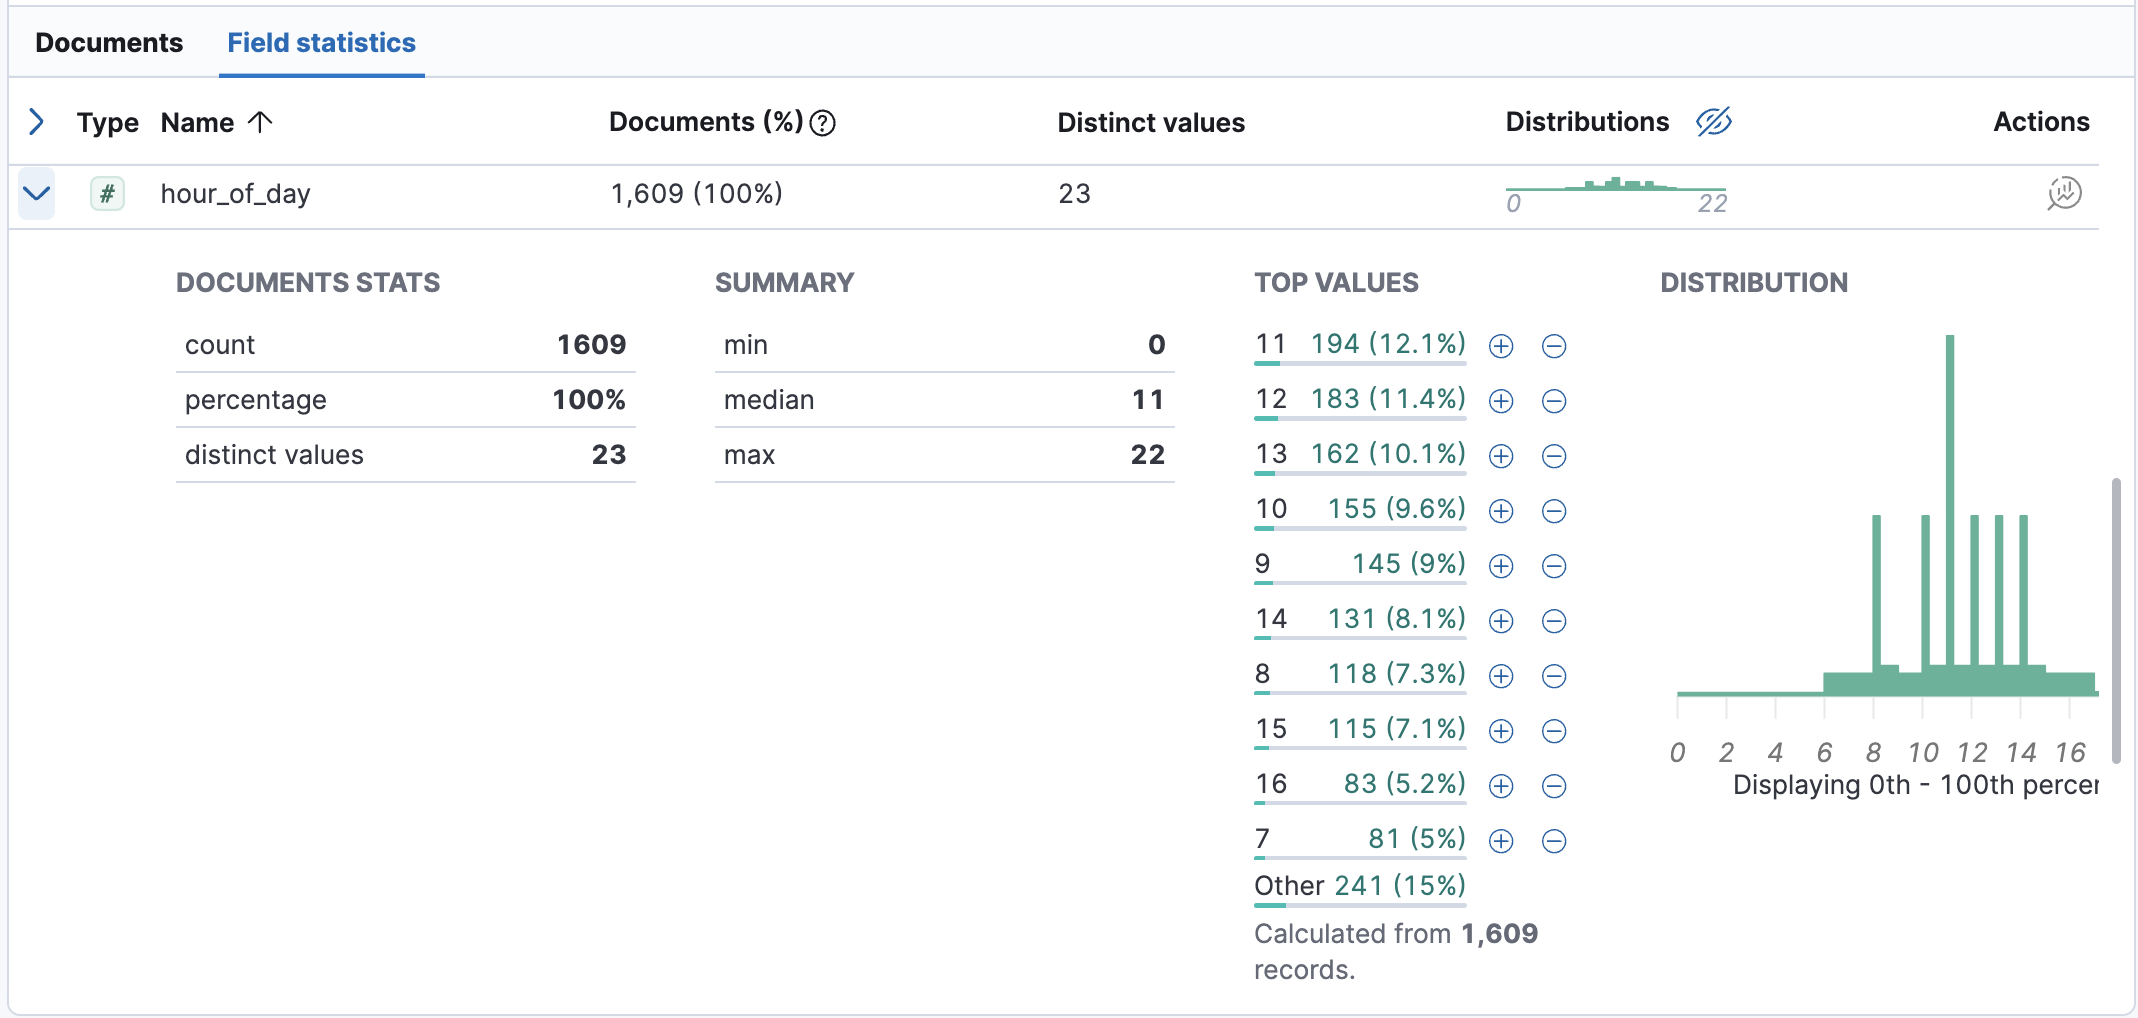
Expand the
hour_of_dayfield.For numeric fields, Discover provides the document statistics, minimum, median, and maximum values, a list of top values, and a distribution chart. Use this chart to get a better idea of how the values in the data are clustered.
-
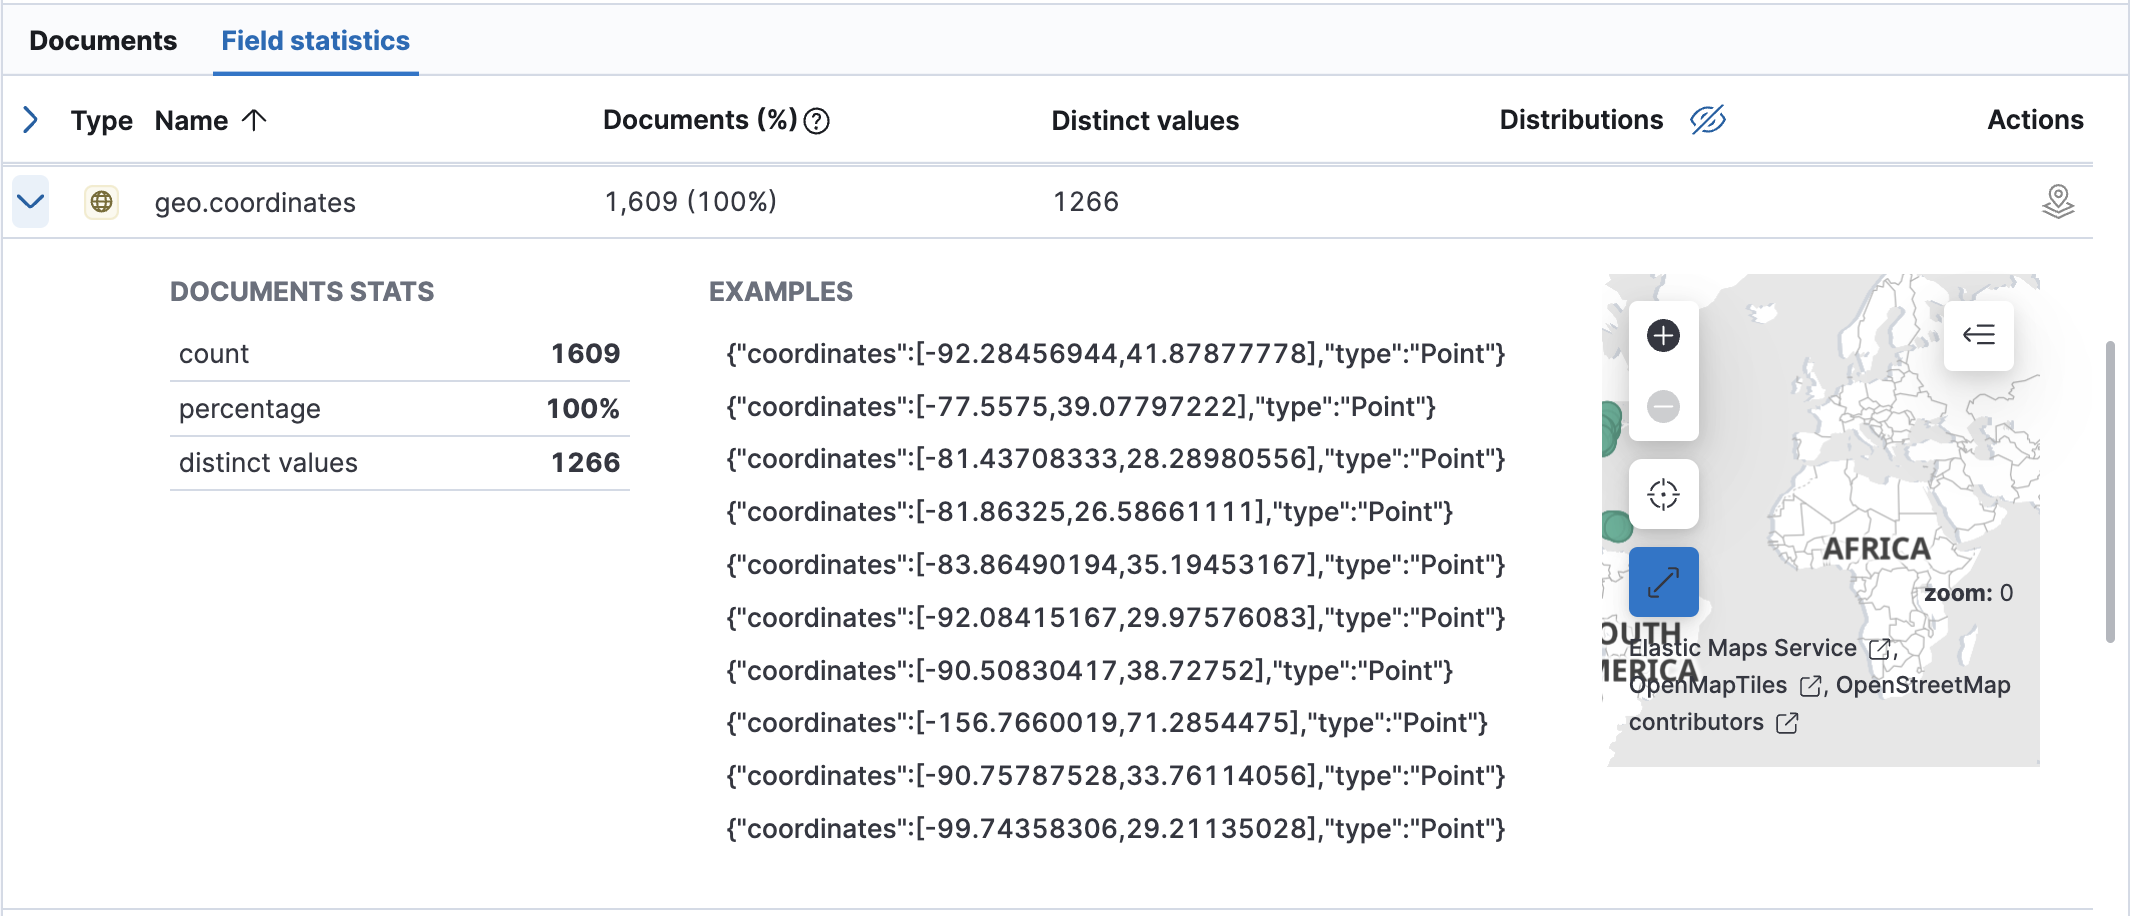
Expand the
geo.coordinatesfield.For geo fields, Discover provides the document statistics, examples, and a map of the coordinates.
- Explore additional field types to see the statistics that Discover provides.
-
To create a Lens visualization of the field data, click
 or
or
 in the Actions column.