What’s new in 8.19
editWhat’s new in 8.19
editHere are the highlights of what’s new and improved in 8.19. For detailed information about this release, check the release notes.
Previous versions: 8.18 | 8.17 | 8.16 | 8.15 | 8.14 | 8.13 | 8.12 | 8.11 | 8.10 | 8.9 | 8.8 | 8.7 | 8.6 | 8.5 | 8.4 | 8.3 | 8.2 | 8.1 | 8.0
Discover and ES|QL
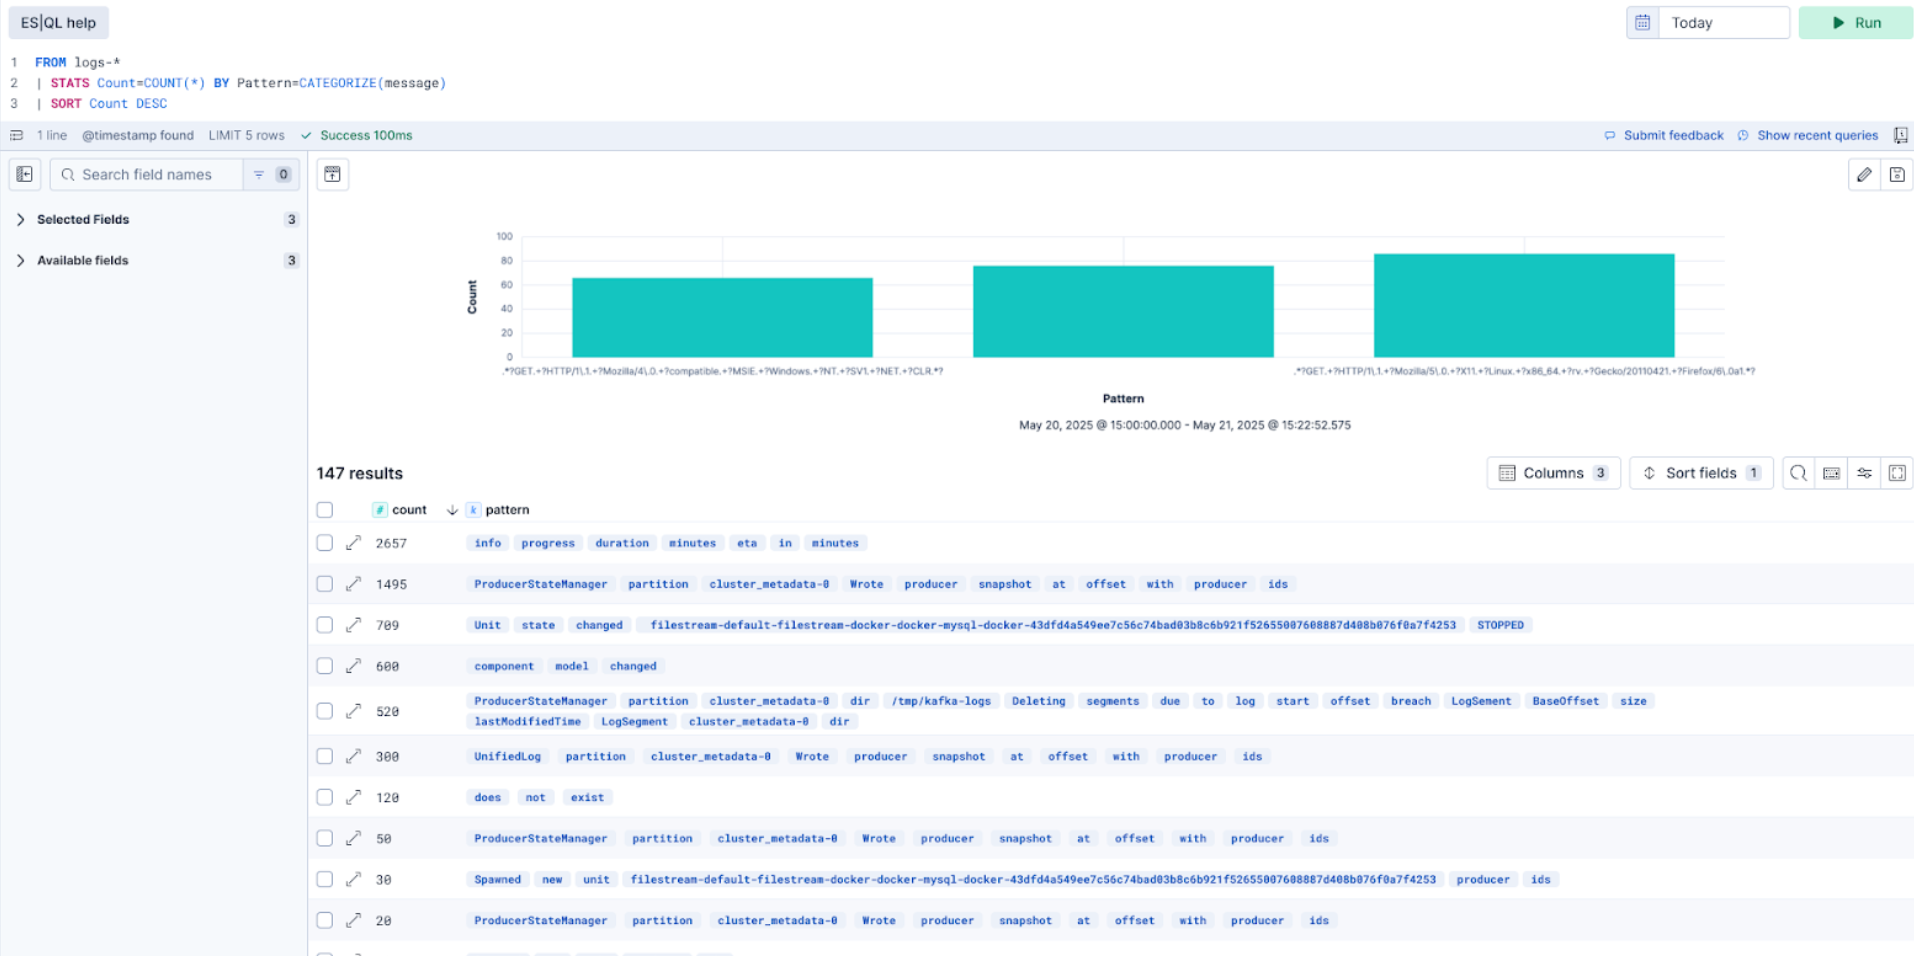
editSpot patterns in your logs instantly with ML-powered CATEGORIZE
editYou can now easily spot patterns in your logs with CATEGORIZE in ES|QL, which automatically groups recurring log patterns and surfaces meaningful insights directly in Discover.
This ML-powered feature helps you detect anomalies, common error messages, and repeating behavior across large volumes of data without writing complex queries. The new table rendering presents patterns in a clear and contextual way, making it easy to scan, interpret, and act on what you see.
Whether you’re troubleshooting issues or monitoring system behavior, CATEGORIZE speeds up your log analysis and gives you ML-powered insights in just a few clicks without any special setup.
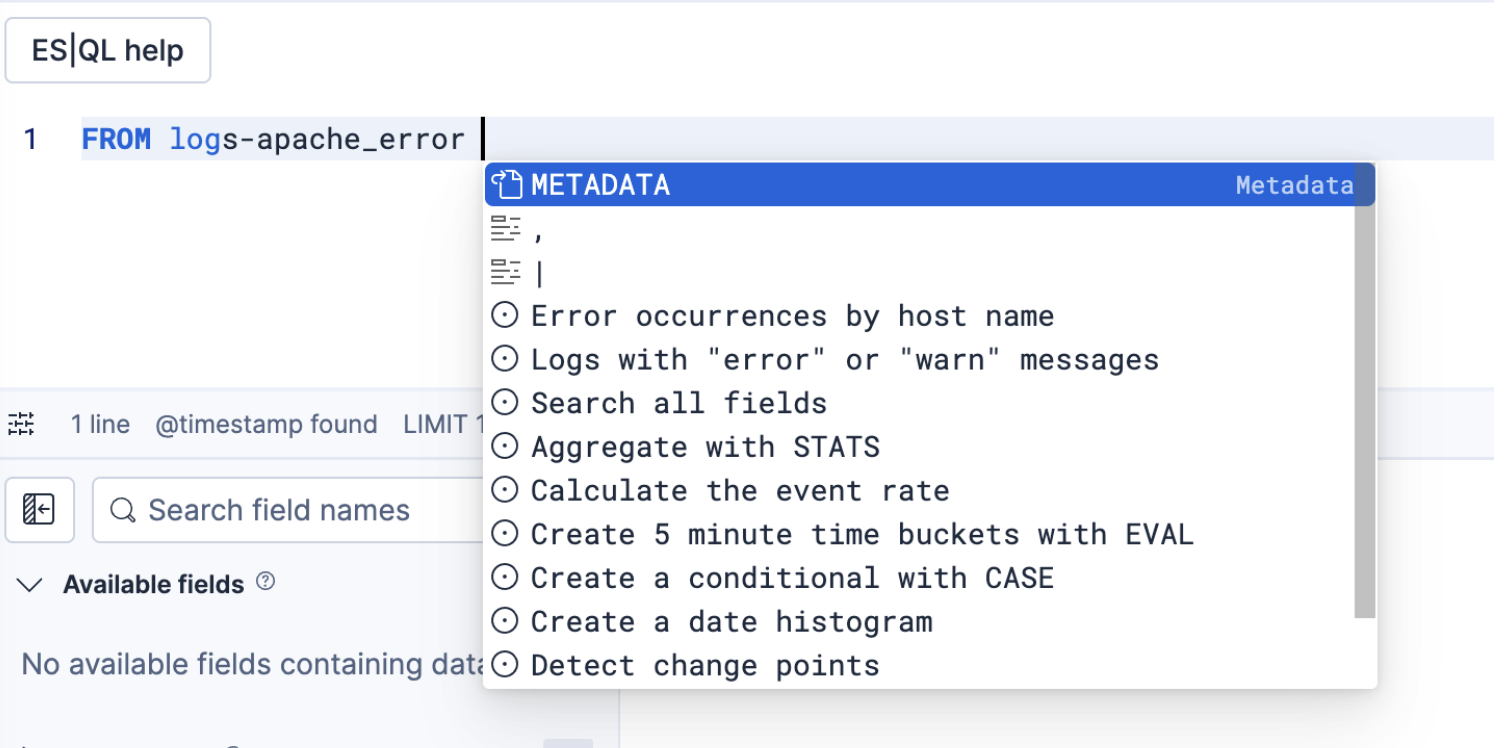
Smarter ES|QL suggestions, tailored to your context
editWe’ve made getting started with ES|QL a whole lot easier and smarter. Building on the static Recommended Queries feature introduced in 8.16, we’re now moving towards context-aware query suggestions that adapt to what you’re working on.
The ES|QL editor now suggests relevant ES|QL queries based on your current solution area (like Observability or Security) and the data source you’re querying. Whether you’re exploring logs, building alerts, or creating dashboards, the suggestions match your task and data.
These context-aware suggestions help you write better queries faster, without needing to know the syntax upfront.
Unified Trace experience in Discover
editWe’ve brought distributed tracing front and center in the new trace experience in Discover. When you open a trace or span document, you’ll see key service and span attributes presented clearly, with improved formatting for duration and latency. A compact waterfall chart is now embedded right in the flyout, letting you instantly visualize trace timing and dependencies without leaving the page. You can expand the chart for a detailed view, complete with direct links to related errors and full APM context. The interface is optimized for OTel fields, supports fast filtering with ES|QL, and has been streamlined for clarity and speed. All of this makes troubleshooting complex, distributed systems in Discover faster and more intuitive than ever.
Dashboards and Visualizations
editCollapsible sections in dashboards
editYou can now organize your dashboards into sections. These collapsible rows enable you to create fewer and more powerful dashboards by grouping relevant content. You can load dashboards faster by saving with sections collapsed, because only content that’s expanded gets loaded.
ES|QL controls and variables, create from anywhere
editWe’ve improved ES|QL variables and dashboard controls in this release. You can now create variables and controls before using them in visualizations. It’s simpler to create a new control by just typing ? in your ES|QL query, enabling you to use controls in more places. You can also substitute variables for function names, field names, field values, and ES|QL configurations all at the same time. The controls editing experience is enhanced, featuring better handling of common situations such as no data returning from a query.
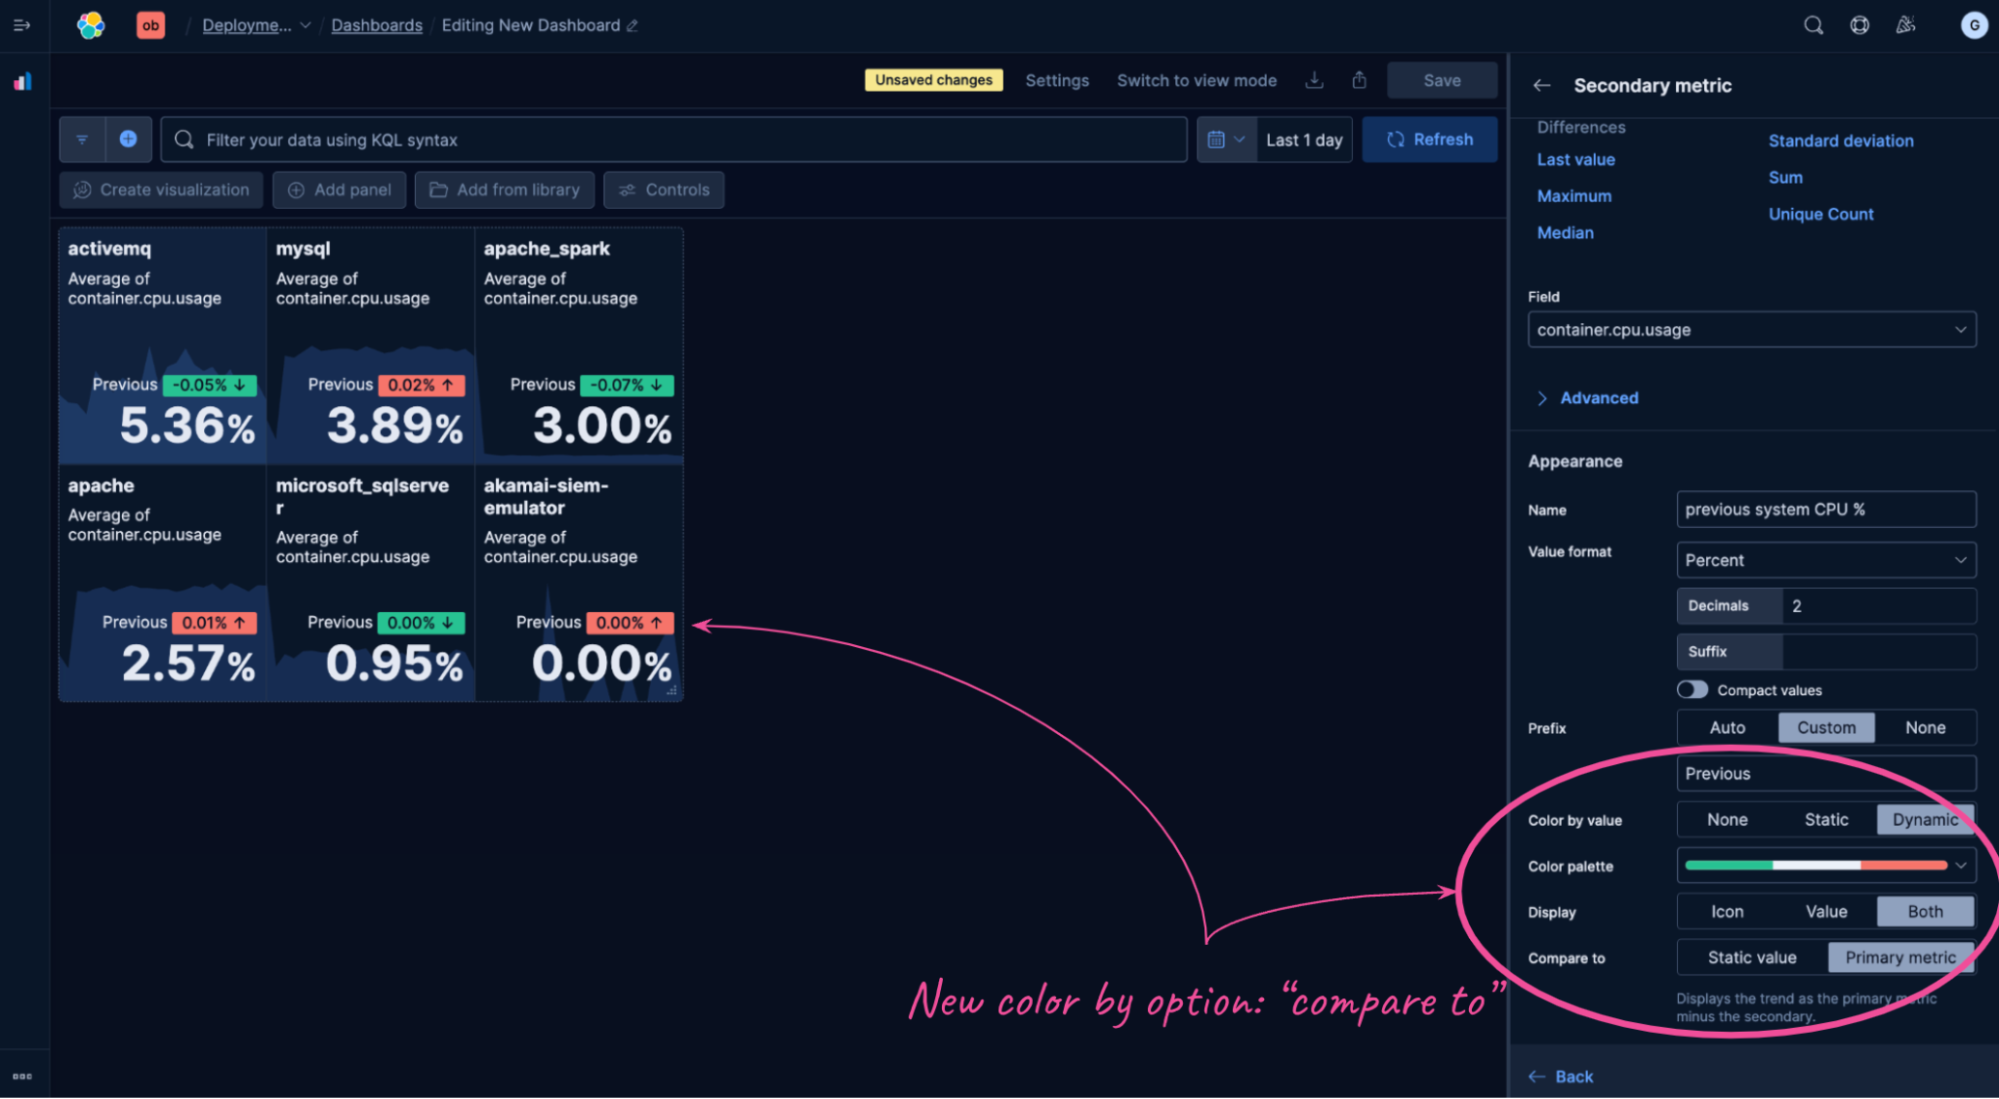
Compare by trend in metric visualizations
editWith this release, you can enable a new Compare to option in metric visualizations, which dynamically compares the value of the secondary metric to the primary metrics. This makes it easy for you to visually spot values that are improving.
New visual options for Lens tables
editYou can now render tables in Lens in Compact or Expanded mode depending on your visual preference.
View chart configuration for read-only dashboards
editAs a non-admin dashboard viewer, you can now view and temporarily adjust dashboard panel configuration, improving your ability to search for similar data in other places in Kibana.
Globe projection in Maps
editThe Elastic Basemaps Service now provides an accurate globe projection when you zoom out.
Kibana Alerting and Cases
editOne Click Monitoring: Create Alerting rules from visualizations
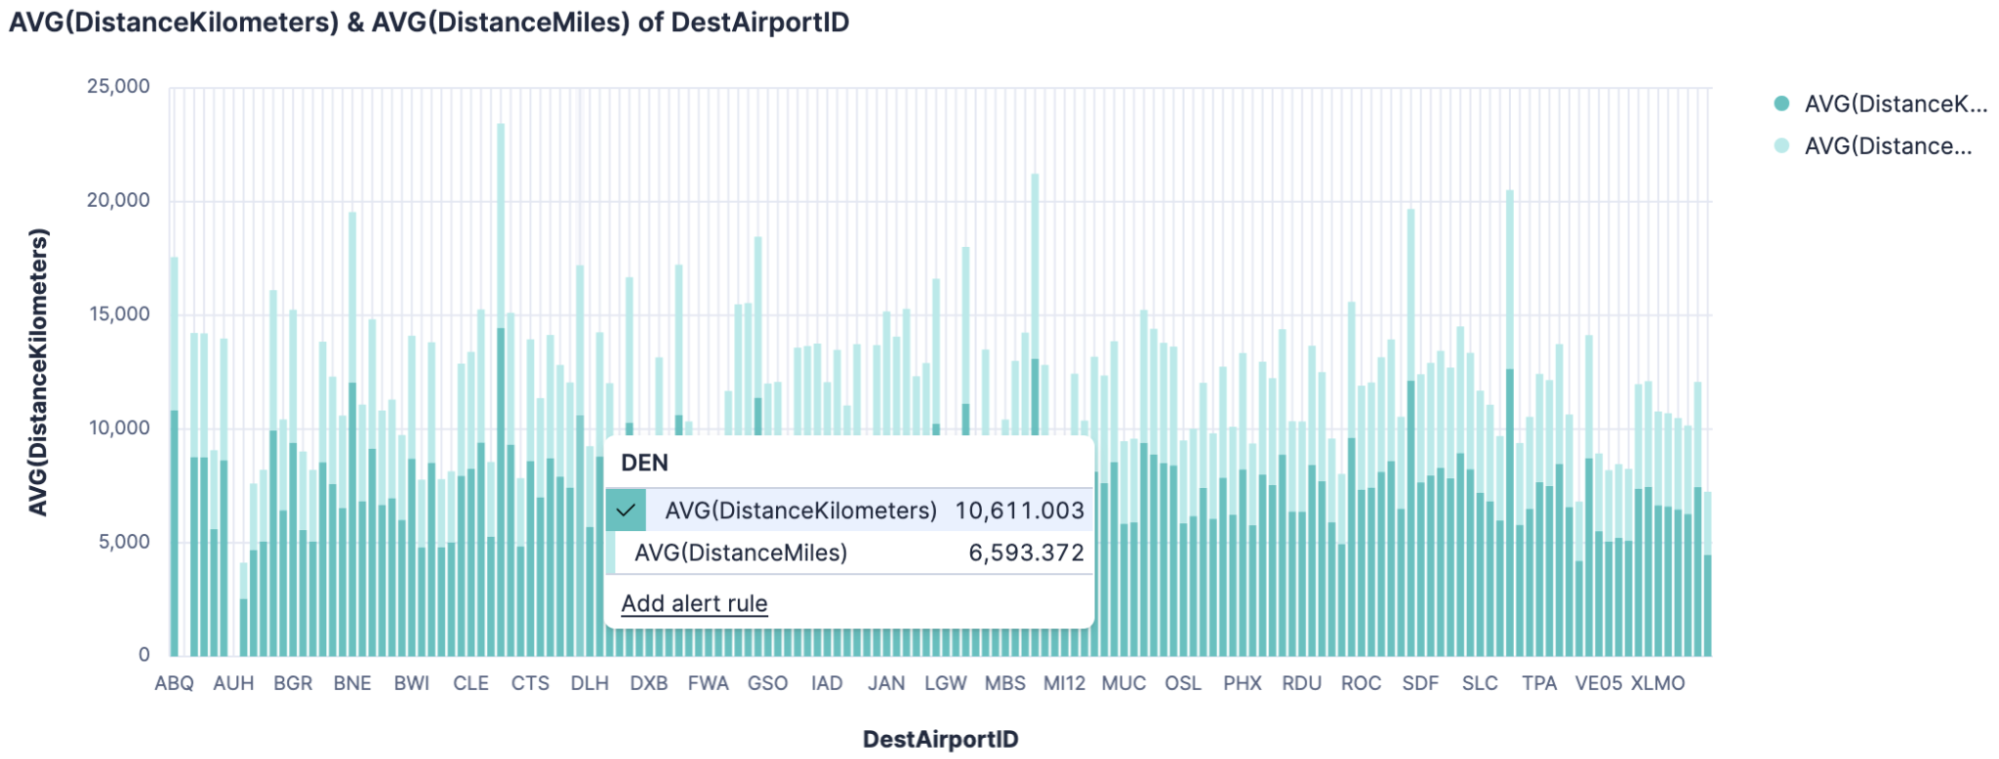
editYou no longer need to go from page to page to create alerting rules from a data point of interest in visualizations. You can now right-click on a data point from any visualization and use the newly introduced Add alert rule option to create an alerting rule with an ES|QL query automatically generated to tailor alerting rules with minimal manual input.
This context-aware rule creation shortcut helps you improve monitoring while staying informed by data.
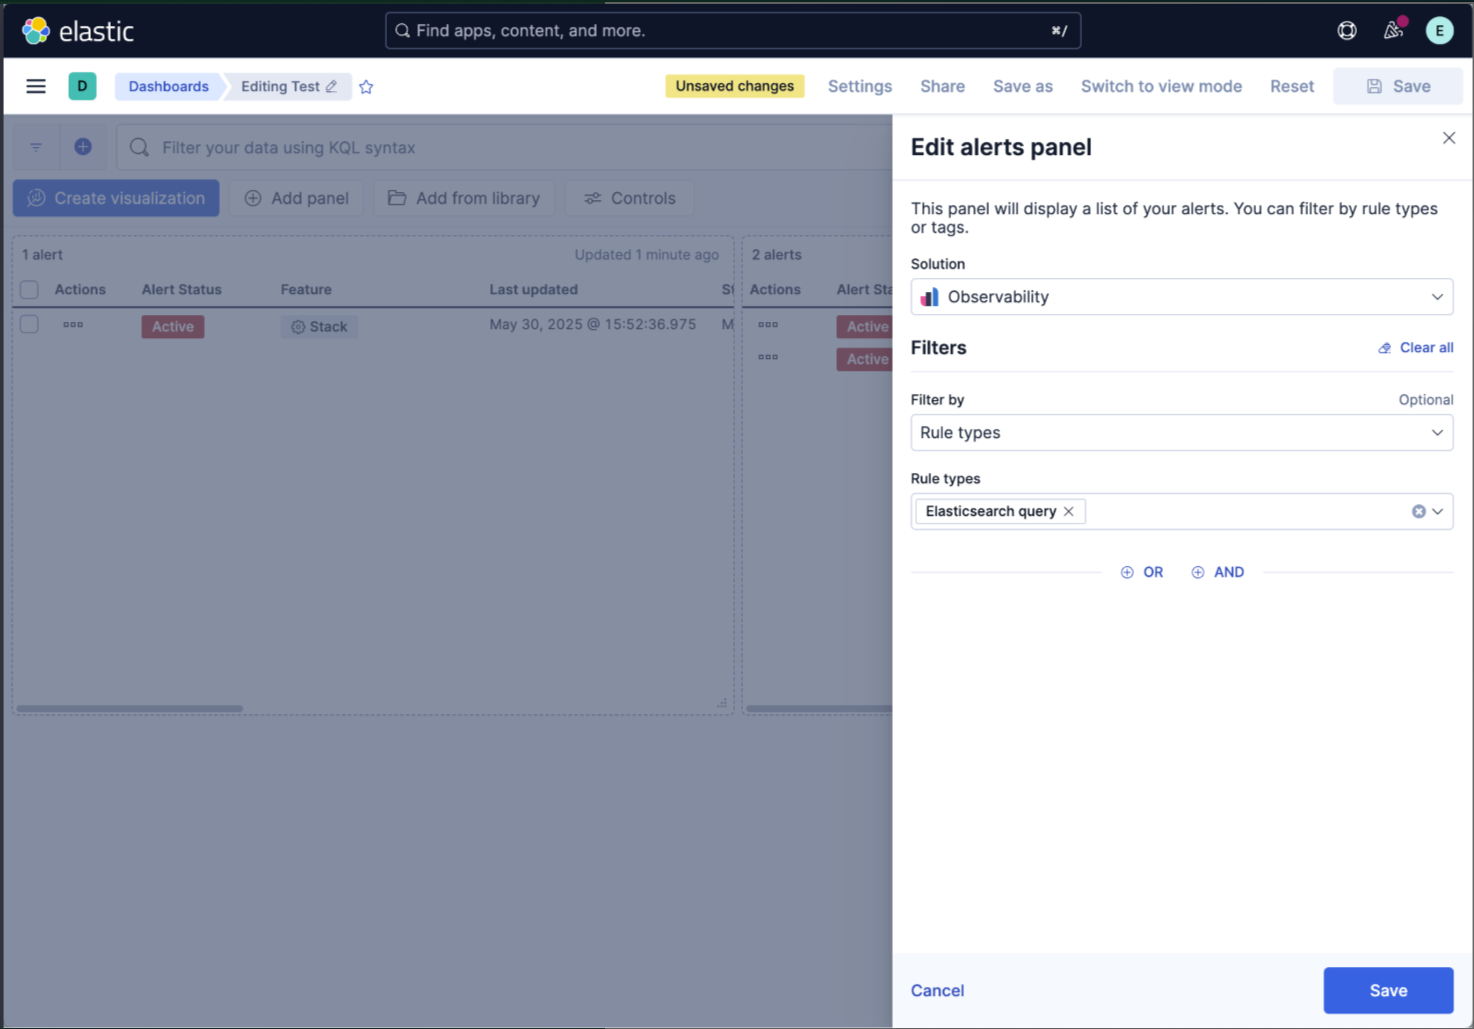
Alerts panel in dashboards
editYou can now include Alerts tables as panels in dashboards. Alerts panels provide real-time visibility into system-triggered alerts alongside other visualizations. You can correlate alerts with other dashboard components, such as logs, metrics, Discover sessions, or Lens visualizations, without needing to switch contexts.
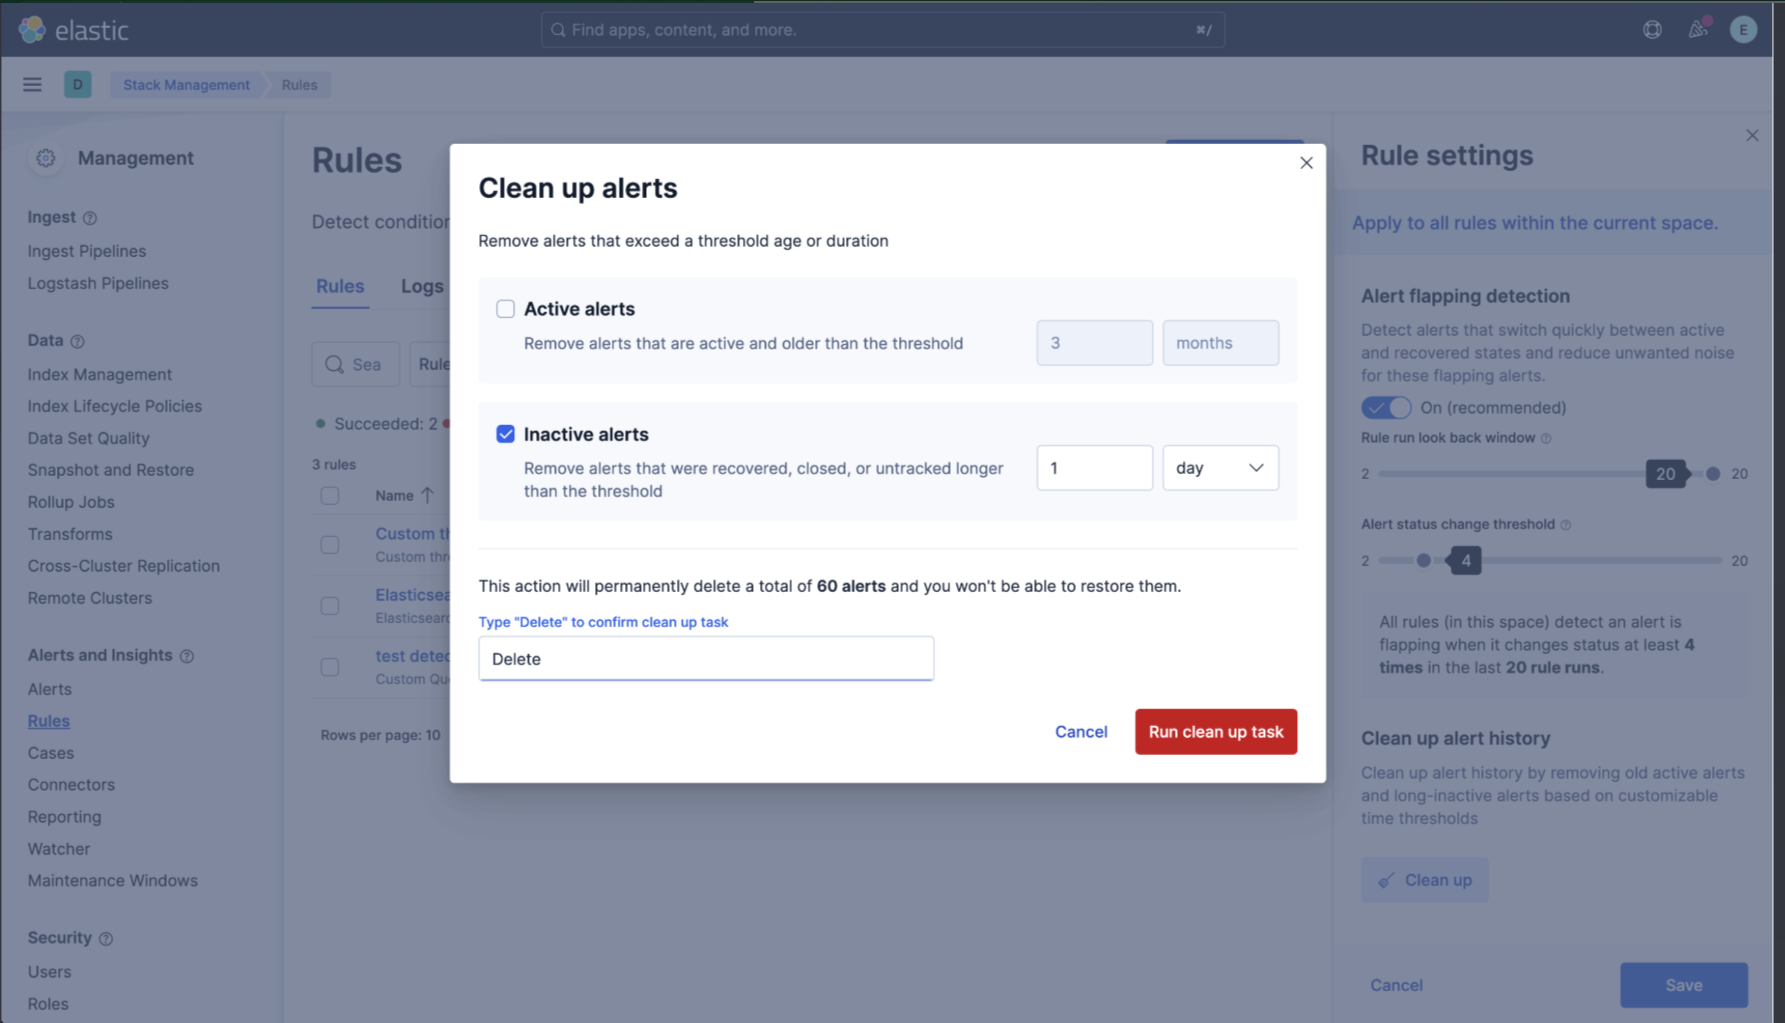
Alerts history clean-up available in Technical Preview
editYou can now manually trigger alerts deletion in bulk. This new feature starts a cleanup task that runs asynchronously in the background. You can specify a threshold for alert age or duration and choose to delete active alerts, inactive alerts, or both. This feature is currently only available under Stack Management.
Maintenance windows public APIs
editMaintenance windows now have public HTTP APIs, enabling programmatic management. You can leverage these APIs to perform Create, Read, Update, and Delete (CRUD) operations on maintenance windows, giving you greater control.
ES|QL rule type ungrouped alerts
editWe’re introducing an ungrouped alerts option to configure alerts for the ES|QL rule type. The ES|QL rule type now allows you to generate an alert for each row in the query results using a unique alert identifier.
Kibana Reporting
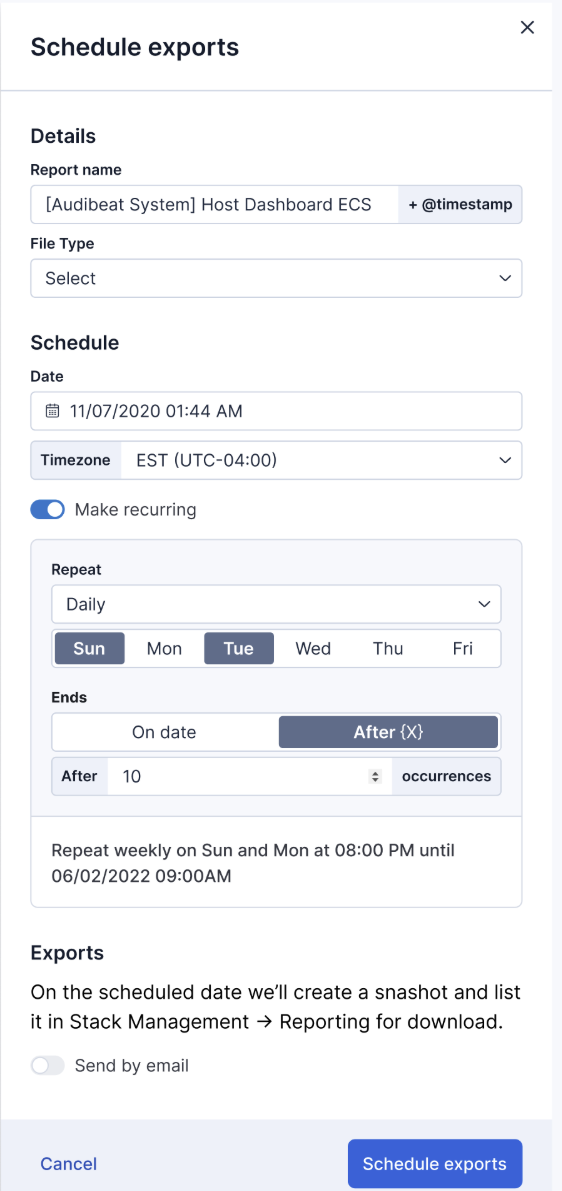
editScheduled exports
editKibana’s reporting feature now enables you to schedule one-time or recurring exports in PDF, PNG, and CSV formats. This allows you to easily capture and share snapshots of dashboard visualizations or Discover results. With scheduled exports, you can configure your export settings once and Kibana will automatically generate exports on a regular schedule. With proper permissions, you can also schedule exports to be shared with others through email, streamlining your export process.