Attack Discovery
editAttack Discovery
editAttack Discovery leverages large language models (LLMs) to analyze alerts in your environment and identify threats. Each "discovery" represents a potential attack and describes relationships among multiple alerts to tell you which users and hosts are involved, how alerts correspond to the MITRE ATT&CK matrix, and which threat actor might be responsible. This can help make the most of each security analyst’s time, fight alert fatigue, and reduce your mean time to respond.
For a demo, refer to the following video.

Role-based access control (RBAC) for Attack Discovery
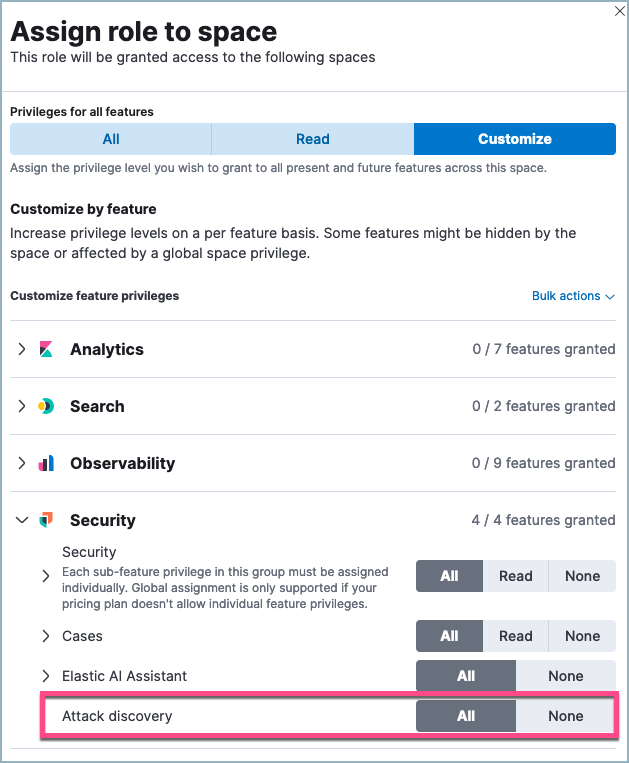
editYou need the Attack Discovery: All privilege to use Attack Discovery.
Your role must also have the following privileges:
| Action | Indices | Elasticsearch privileges |
|---|---|---|
Read Attack Discovery alerts |
|
|
|
Read and modify Attack Discovery alerts. This includes:
|
|
|
Set up Attack Discovery
editBy default, Attack Discovery analyzes up to 100 alerts from the last 24 hours, but you can customize how many and which alerts it analyzes using the settings menu. To open it, click the settings icon next to the Run button.
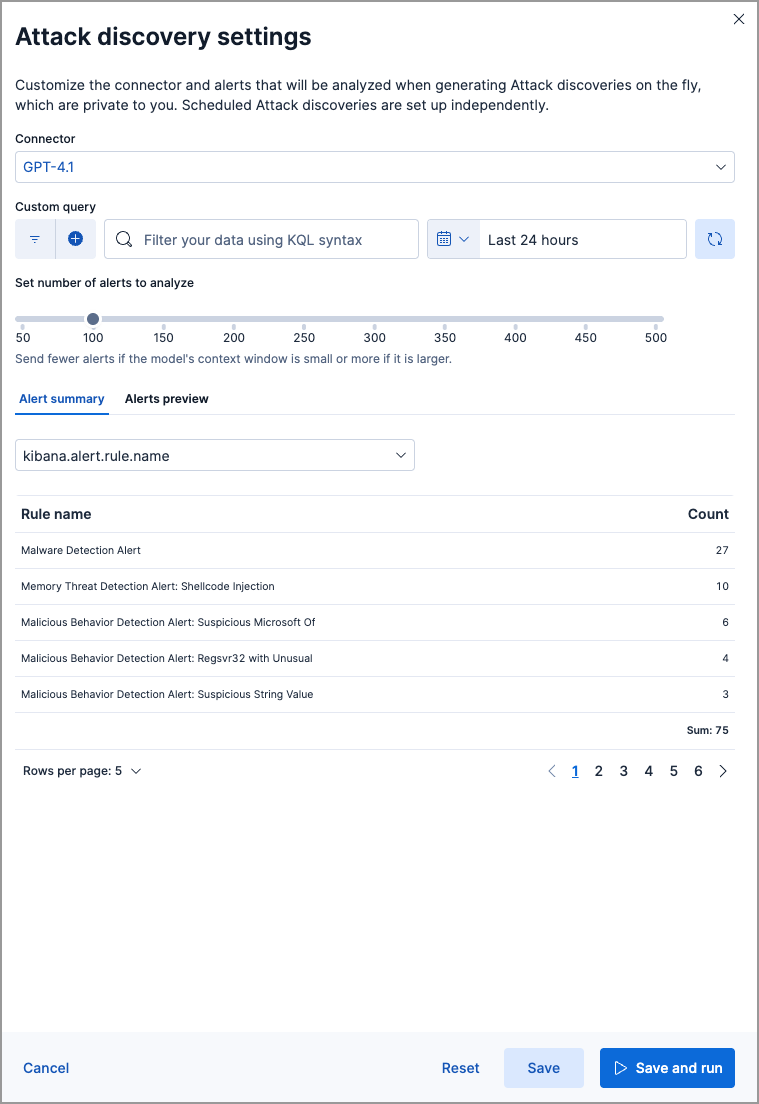
You can select which alerts Attack Discovery will process by filtering based on a KQL query, the time and date selector, and the Number of alerts slider. Note that sending more alerts than your chosen LLM can handle may result in an error. Under Alert summary you can view a summary of the selected alerts grouped by various fields, and under Alerts preview you can see more details about the selected alerts.
How to add non-ECS fields to Attack Discovery
Attack Discovery is designed for use with alerts based on data that complies with ECS, and by default only analyses ECS-compliant fields. However, you can enable Attack Discovery to review additional fields by following these steps:
- Select an alert with some of the non-ECS fields you want to analyze, and go to its details flyout. From here, use the Ask AI Assistant button to open AI Assistant.
- At the bottom of the chat window, the alert’s information appears. Click Edit to open the anonymization window to this alert’s fields.
- Search for and select the non-ECS fields you want Attack Discovery to analyze. Set them to Allowed.
The selected fields can now be analyzed the next time you run Attack Discovery.
Generate discoveries manually
editYou’ll need to select an LLM connector before you can analyze alerts. Attack Discovery uses the same LLM connectors as AI Assistant. To get started:
- Click the Attack Discovery page from Elastic Security’s navigation menu.
-
Click the settings icon next to the Run button, then in the settings menu, select an existing connector from the dropdown menu, or add a new one.
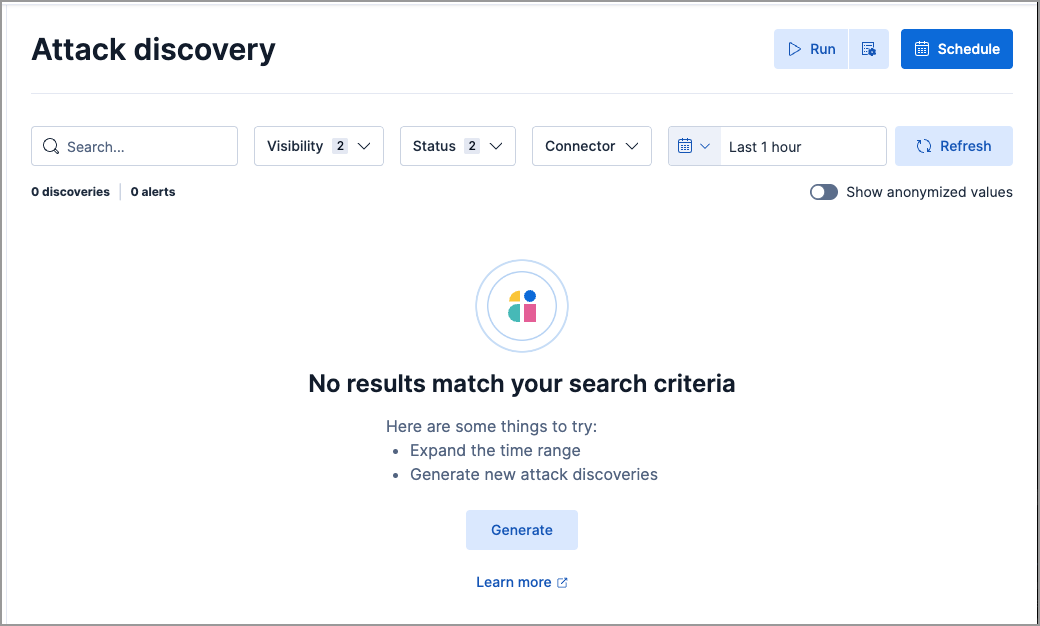
- Once you’ve selected a connector, click Save and run to start the analysis.
It may take from a few seconds up to several minutes to generate discoveries, depending on the number of alerts and the model you selected. Once the analysis is complete, any threats it identifies will appear as discoveries. Click each one’s title to expand or collapse it. Click Run at any time to start the Attack Discovery process again with the selected alerts.
Attack Discovery uses the same data anonymization settings as Elastic AI Assistant. To configure which alert fields are sent to the LLM and which of those fields are obfuscated, use the Elastic AI Assistant settings. Consider the privacy policies of third-party LLMs before sending them sensitive data.
What information does each discovery include?
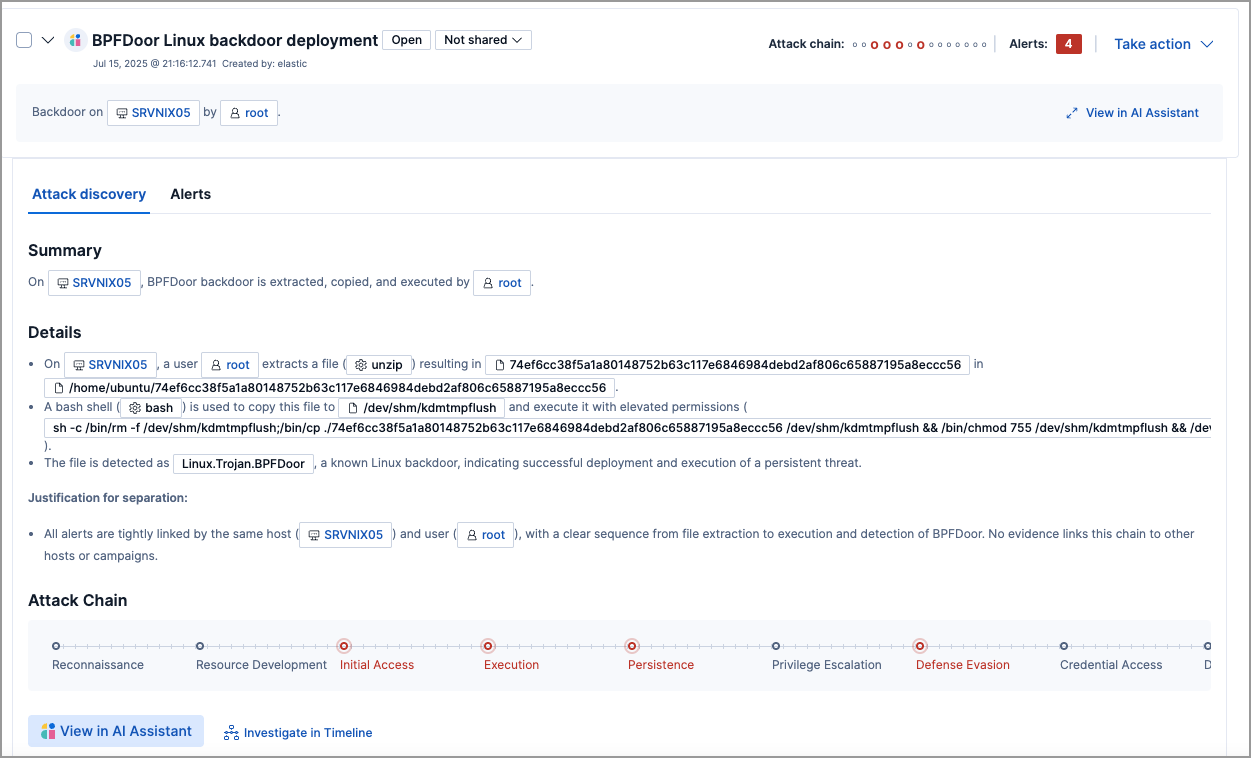
editEach discovery includes the following information describing the potential threat, generated by the connected LLM:
- A descriptive title and a summary of the potential threat.
- The number of associated alerts and which parts of the MITRE ATT&CK matrix they correspond to.
- The implicated entities (users and hosts), and what suspicious activity was observed for each.
Incorporate discoveries with other workflows
editThere are several ways you can incorporate discoveries into your Elastic Security workflows:
- Click an entity’s name to open the entity details flyout and view more details that may be relevant to your investigation.
-
Hover over an entity’s name to either add the entity to Timeline (
 ) or copy its field name and value to the clipboard (
 ).
).
- Click Take action, then select Add to new case or Add to existing case to add a discovery to a case. This makes it easy to share the information with your team and other stakeholders.
- Click Investigate in timeline to explore the discovery in Timeline.
- Click View in AI Assistant to attach the discovery to a conversation with AI Assistant. You can then ask follow-up questions about the discovery or associated alerts.
Schedule discoveries
editYou can define recurring schedules (for example, daily or weekly) to automatically generate attack discoveries without needing manual runs. For example, you can generate discoveries every 24 hours and send a Slack notification to your SecOps channel if discoveries are found. Notifications are sent using configured connectors, such as Slack or email, and you can customize the notification content to tailor alert context to your needs.
You can still generate discoveries manually at any time, regardless of an active schedule.
To create a new schedule:
- In the top-right corner, select Schedule.
- In the Attack discovery schedule flyout, select Create new schedule.
- Enter a name for the new schedule.
- Select the LLM connector to use for generating discoveries, or add a new one.
- Use the KQL query bar, time filter, and alerts slider to customize the set of alerts that will be analyzed.
- Define the schedule’s frequency (for example, every 24 hours).
- Optionally, select the connectors to use for receiving notifications, and define their actions.
- Click Create & enable schedule.
After creating new schedules, you can view their status, modify them or delete them from the Attack discovery schedule flyout.
Scheduled discoveries are shown with a Scheduled Attack discovery icon. Click the icon to view the schedule that created it.
View saved discoveries
editAttack discoveries are automatically saved on the Attack Discovery page each time you generate them. Once saved, discoveries remain available for later review, reporting, and tracking over time. This allows you to revisit discoveries to monitor trends, maintain audit trails, and support investigations as your environment evolves.
Change a discovery’s status
editYou can set a discovery’s status to indicate that it’s under active investigation or that it’s been resolved. To do this, click Take action, then select Mark as acknowledged or Mark as closed.
You can choose to change the status of only the discovery, or of both the discovery and the alerts associated with it.
Share attack discoveries
editBy default, scheduled discoveries are shared with all users in a Kibana space.
Manually generated discoveries are private by default. To share them, change Not shared to Shared next to the discovery’s name.
Once a discovery is shared, its visibility cannot be changed.
Take bulk actions
editYou can take bulk actions on multiple discoveries, such as bulk-changing their status or adding them to a case. To do this, select the checkboxes next to each discovery, then click Selected x Attack discoveries and choose the action you want to take.
Search and filter saved discoveries
editYou can search and filter saved discoveries to help locate relevant findings.
- Use the search box to perform full-text searches across your generated discoveries.
- Visibility: Use this filter to, for example, show only shared discoveries.
- Status: Filter discoveries by their current status.
- Connector: Filter discoveries by connector name. Connectors that are deleted after discoveries have been generated are shown with a Deleted tag.
- Time filter: Adjust the time filter to view discoveries generated within a specific timeframe.