New to Elasticsearch? Join our getting started with Elasticsearch webinar. You can also start a free cloud trial or try Elastic on your machine now.
In this article, we’ll show you how to capture and analyze user analytics data using the UBI (User Behavior Insights) standard in Elasticsearch.
You can learn more about UBI in this article.
Data collected with the UBI collector can be used on Kibana to build dashboards that open the window to users’ behavior in our application. In this blog, we will explore how to analyze UBI data in Kibana to gain insights into how our app is being used.
Demo set up
We can easily reproduce the demo in this blog following these steps:
1. Clone the repository
2. Install required libraries:
3. Run the setup script. Make sure to have the following environment variables set beforehand
- ES_HOST
- API_KEY
- KIBANA_HOST
That’s all you need to do. If everything went well, you should see this output from the script execution:
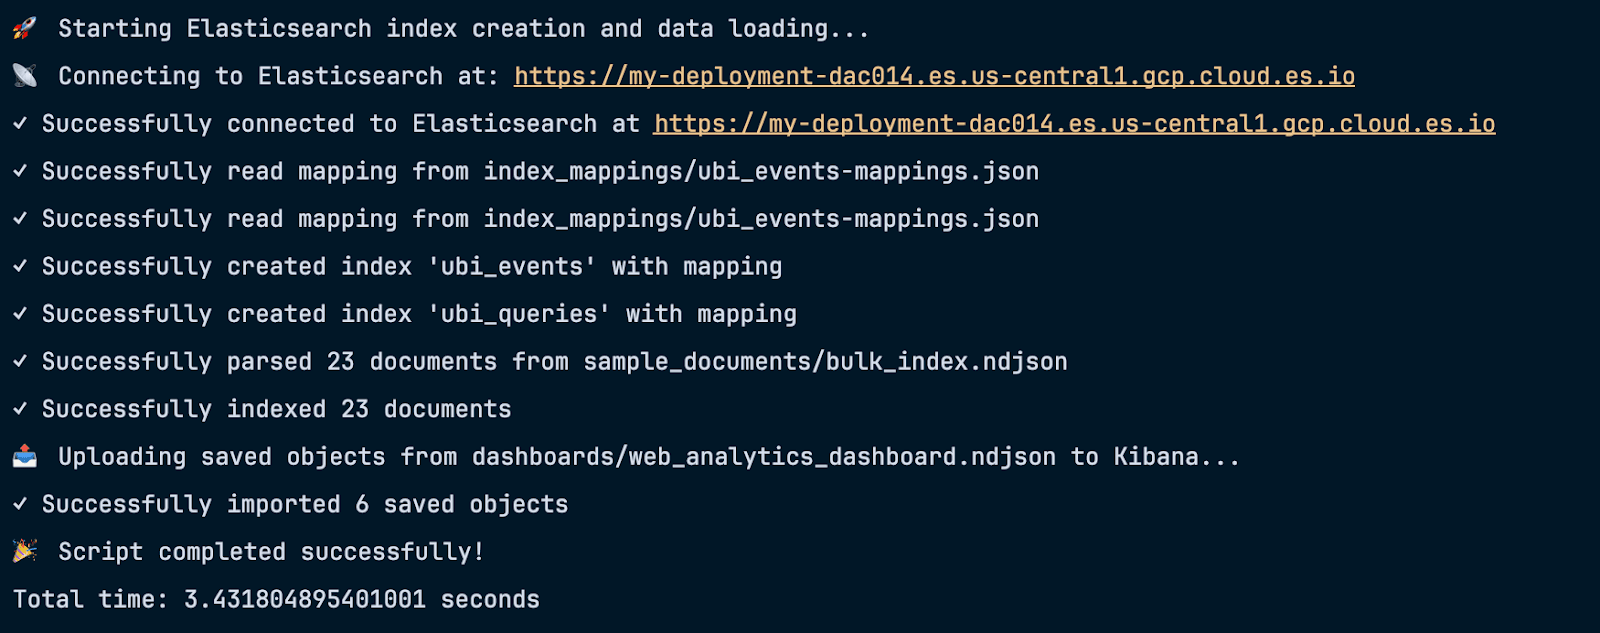
As we can see the script:
- Created two indices with the appropriate mappings
- Indexed 23 documents to these indices
- Uploaded some saved objects to Kibana
Now, let’s take a look at what exactly this script did behind the scenes.
Understanding the uploaded data
First, we put some data in Elasticsearch before creating our visualizations.
You can reproduce the process manually in Kibana DevTools, copying the mappings and sample data and using the PUT <index> and PUT _bulk APIs, respectively.
Ubi_events index
User action data, documents are generated for every click (in this case), and it includes:
- application: The client application that generated the event ("search-ui")
- action_name: Type of user action performed ("click")
- query_id: Links this event to the corresponding search query session
- client_id: A generated, unique ID that represents a user or session without revealing personal data. It is generated instead of using identifiable data like email addresses or usernames. This approach allows us to have privacy advantages such as safe analytics capabilities and secure data sharing without exposing PII, while still having important functionality like session continuity, behavioral analysis, or A/B testing.
- timestamp: ISO 8601 formatted timestamp when the event occurred
- message_type: Category of the event for processing ("CLICK_THROUGH")
- message: Human-readable description of what happened ("Clicked Fahrenheit 451")
- user_query: The original search term that led to this event ("fahrenheit")
- event_attributes: Nested object containing detailed event context:
- object.device: Device type used by the user ("mobile")
- object.object_id: Unique identifier of the clicked item
- object.description: Details about the clicked item (book title, date, author)
- object.position.ordinal: Ranking position of the item in search results (1st)
- object.position.page_depth: Which page of results the item appeared on (1st page)
- object.user.ip: User's IP address
- object.user.city/region/country: Geographic location data
- object.user.location: Precise latitude/longitude coordinates
Sample document:
You can download the index mappings here
Ubi_queries index
Search data includes data relevant to each search executed by the users:
- query_response_id: Unique identifier for this specific query response instance
- user_query: The original search term entered by the user ("fahrenheit")
- query_id: Unique identifier for the search query session
- query_response_object_ids: Array of object IDs that were returned as search results (["3", "9"])
- query: The complete Elasticsearch query object in JSON format, including search parameters, fields to search, result size, sorting, and metadata
- client_id: A generated unique ID that represents a user or session without revealing personal data. It is generated instead of using identifiable data like email addresses or usernames. This approach allows us to have privacy advantages such as safe analytics capabilities and secure data sharing without exposing PII, while still having important functionality like session continuity, behavioral analysis, or A/B testing.
- timestamp: Unix timestamp in milliseconds when the query was executed (1753885225098)
Sample document:
You can download the index mappings here.
Sample data
We can use the _bulk API to index some sample data in both indices
This will create 6 documents in the ubi_queries index and 16 in the ubi_events index.
Dashboard object
Before going into details of the visualizations used in this example here, you can download the Saved Object of the full example dashboard and import it into your Kibana instance. This dashboard explores the most searched terms, when searches and events took place, and where they come from (in a map).
Visualize Insights
We are going to create a Kibana dashboard to analyze the most common metrics leveraging Kibana Lens. For a reference on available visualizations, visit this page.
Ubi_events
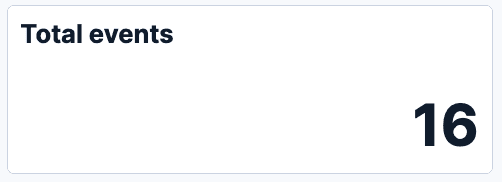
We will start with some simple Metric visualizations created with Lens: Total events: Counts how many events were triggered in the timeframe. Uses a simple count of the documents in the index, denoted by # Records in the field list.
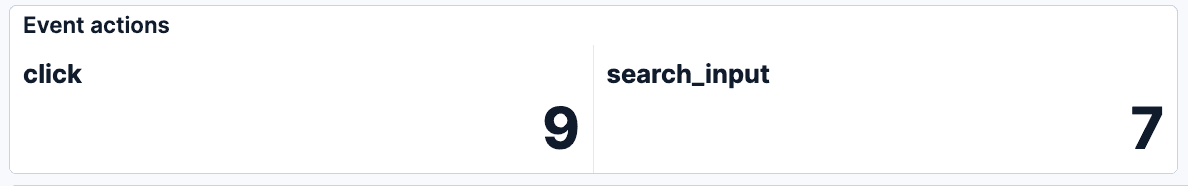
Event actions: Counts actions by action_name. This is a simple count of documents split by action_name.keyword. In our sample data, we have two types of actions:
- click: Generated when a user clicks in the book link
- search_input: Generated when a user enters text in the search box (debounce 300ms)
Now on table visualizations:
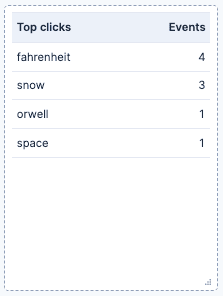
Top clicks: A table with a count of the number of events split by the query they come from. It uses a Top values function on the user_query.keyword. This can give us visibility on which queries generate more interactions on our webpage.
Finally, some other visualizations:
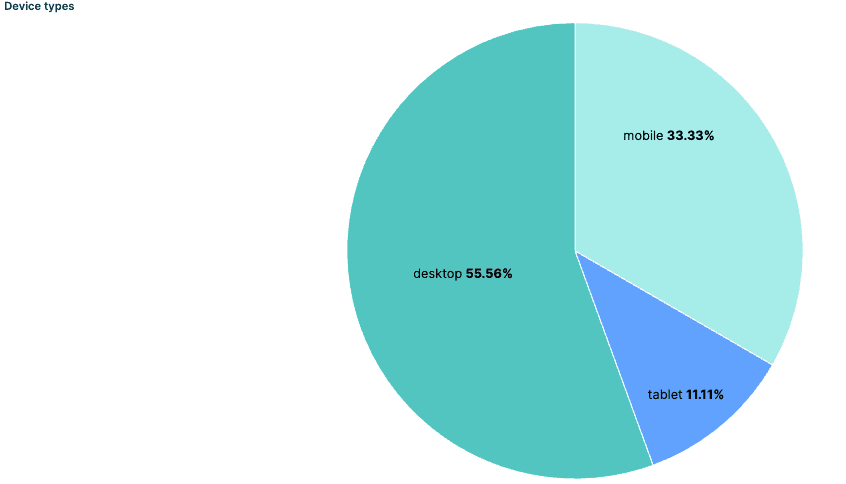
Device types: This visualization breaks down the percentage of events by the device they come from. The device can be one of three categories: Desktop, mobile, or tablet. This visualization is a pie that uses the top values of event_attributes.object.device.keyword, and can give us insights into which type of devices our users have. This can generate alerts if we detect an unexpected, sudden fall of events on a specific type of device, as this might indicate that a recent change in our app resulted in errors when accessing it from a device.
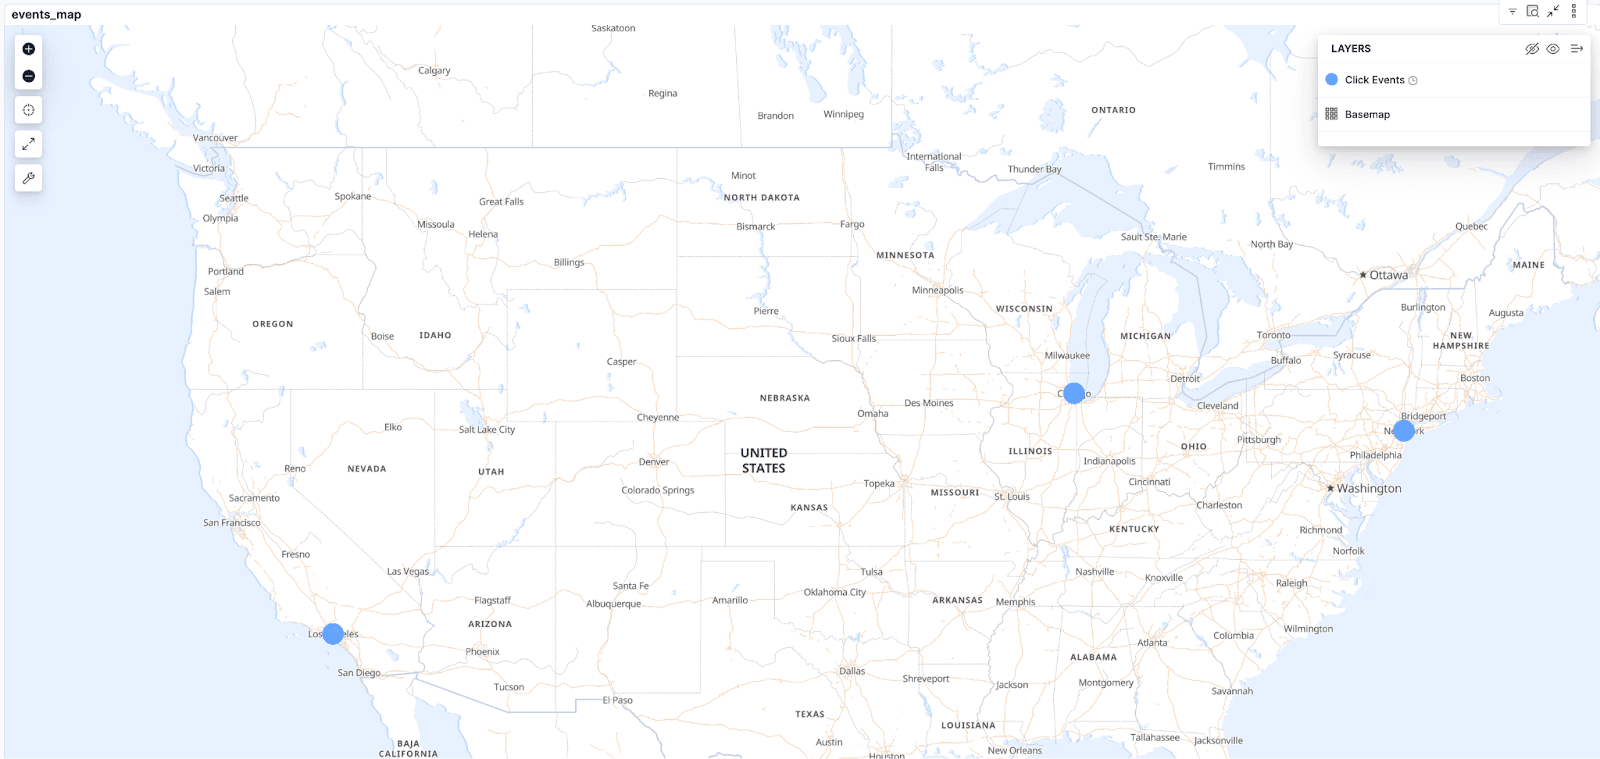
Events map: A map visualization that shows where the events are coming from, which allows us to see the geographical distribution of our users. Right now, this shows where individual documents come from, but this can also be used to see the density of users with a heatmap, for example.
This particular visualization can provide very interesting insights when used with different filters. For example, we can see where different search terms are coming from or where most of our clicks are originating. This can be useful information for making decisions on localization efforts or establishing differences across local markets. The map uses the location at event_attributes.object.user.location.
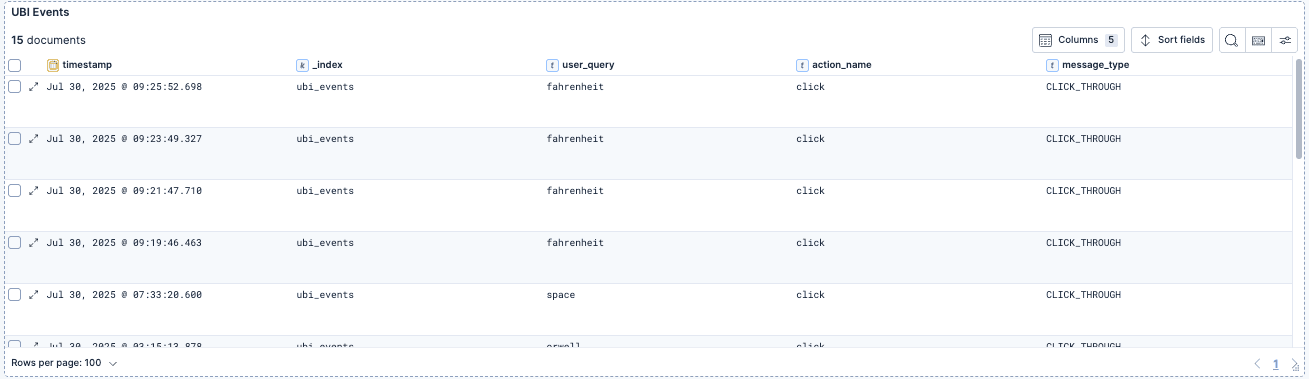
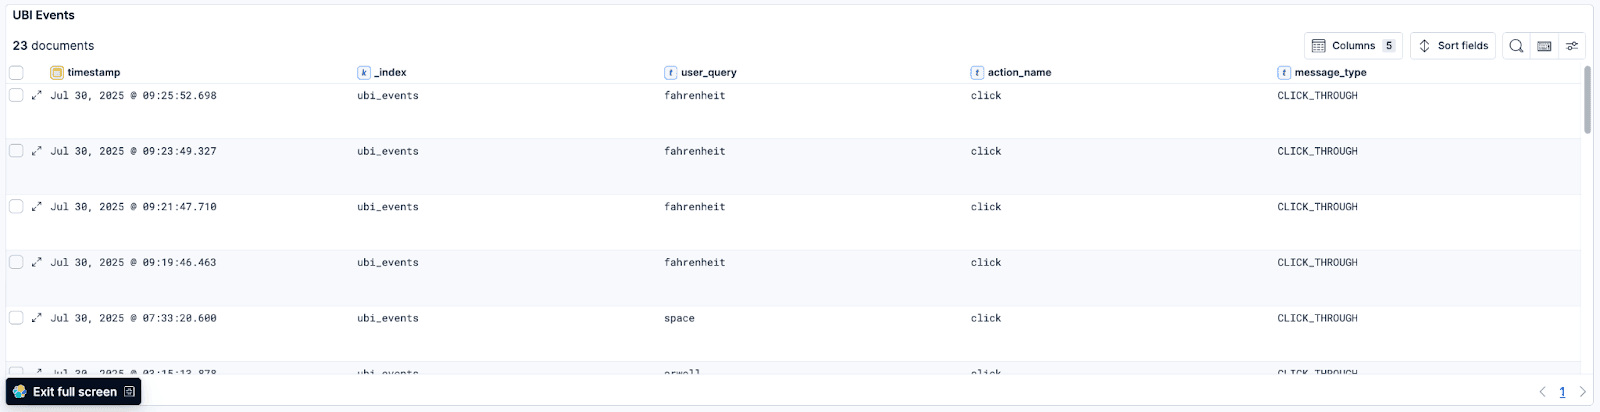
UBI Events: A saved search with the latest UBI events documents
Ubi_queries
Here we have visualizations from this index:
Total queries: A simple document count of the index to show how many queries have been received in total. This shows the big picture and answers the question of how many total queries we had in the selected time window.

Unique clients: A unique_count of the field client_id to show how many different clients have used our website.

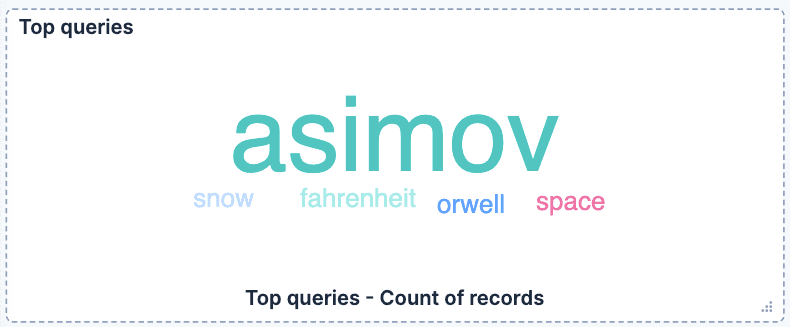
Top queries (tag cloud): A Tag cloud of the top 5 most searched terms. This visualization uses the field user_query.keyword and allows us to easily see the main terms that our users are looking for.
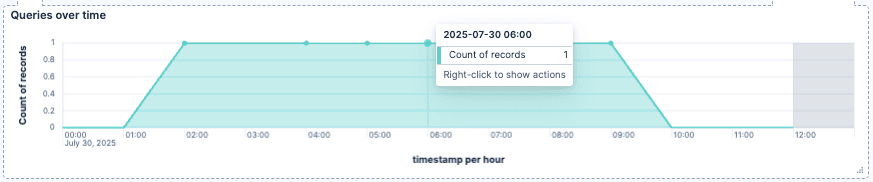
Queries over time: A line chart of queries per hour, which uses a simple count metric in a horizontal axis of the field timestamp
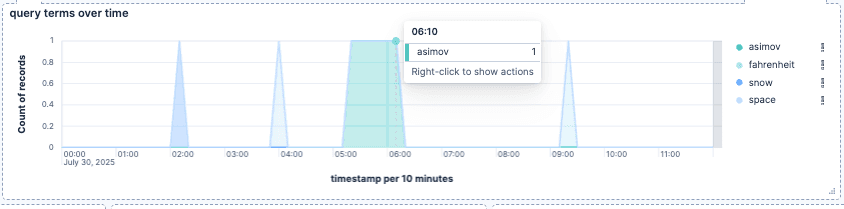
Query terms over time: Similar to the last one, but broken down by the user_query.keyword. This chart can show how many different terms are searched over time.
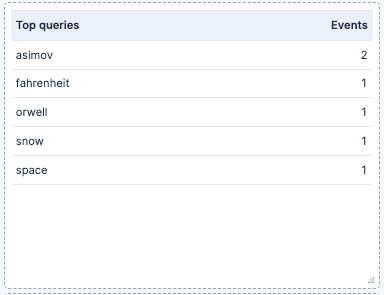
Top queries: A Top values table showing how many times a term was searched. It uses the user_query.keyword field.
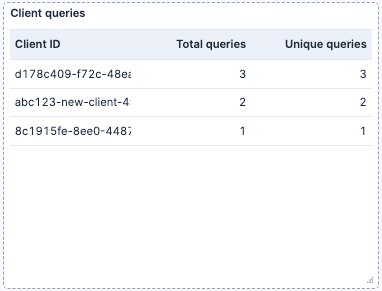
Client queries: A Top values table of the client_id field that counts the total queries and unique queries per client.
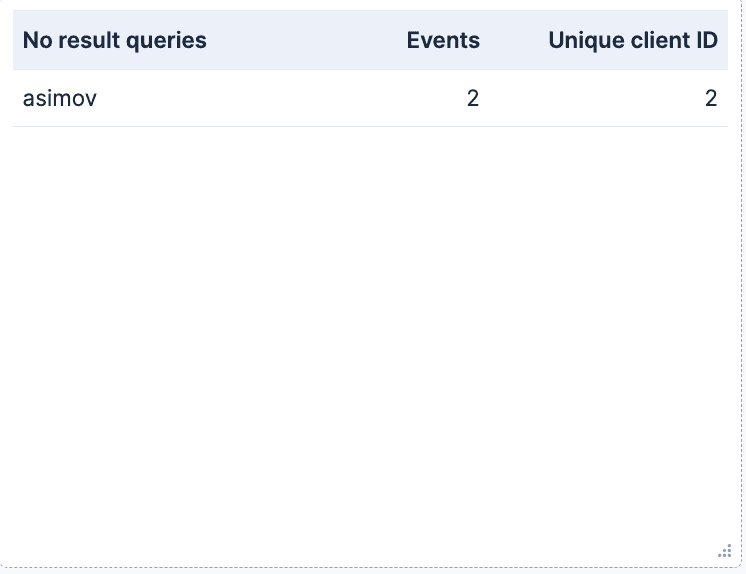
No result queries: A Top value table that shows the top query_terms that didn’t match any document, and a Unique Count of the field client_id. This can be very useful to determine what products our website is lacking. For example, in an e-commerce book store, seeing regular searches for a particular book title could lead us to buy copies to sell. Alternatively, it can also indicate shortcomings in our search implementation, for example, if people are using question-based searches that align better with semantic search approaches.
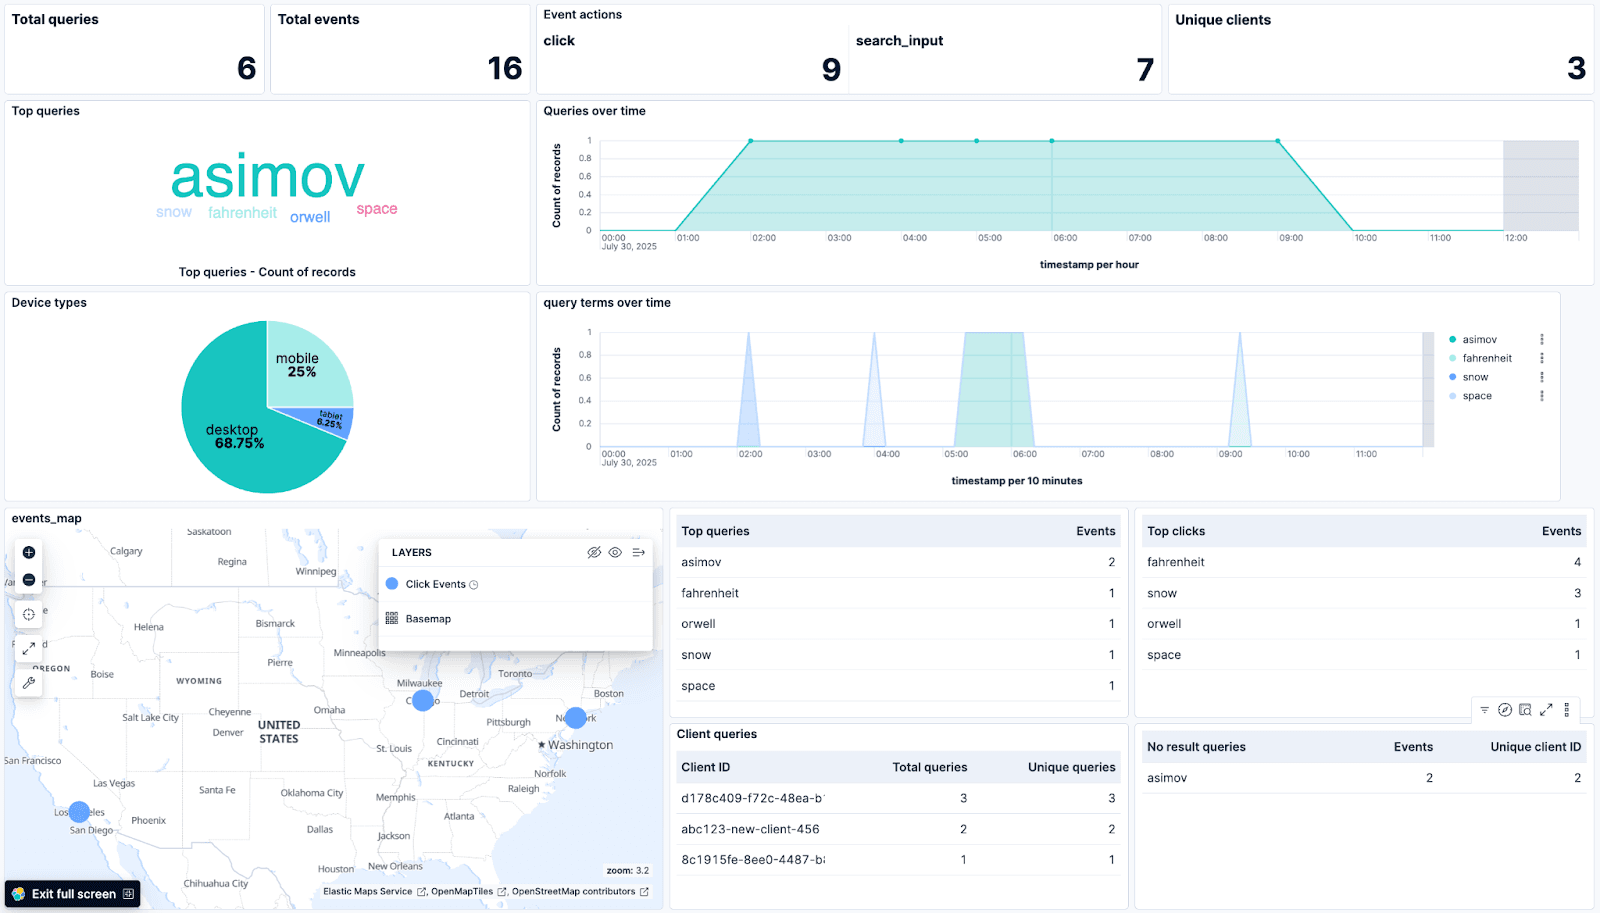
Here you can see the full dashboard:
Analysis of sample data
In our dashboard, we can get some insights:
- Traffic is coming from 3 different cities in the US
- Most of our users access our website from a desktop device, but we have a sizable number of users using a mobile device and even some using a tablet.
- We can see the top query is “asimov,” but at the same time, we do not have any results. This might be a good indicator of what products should be prioritized for stock acquisition.
To further this analysis, we could use Kibana’s Machine Learning capabilities to understand and predict behaviours on our website. Going even one step further, we can create alerts based on these behaviors using the different available connectors.
From a search relevance perspective, user behavior is a useful input for relevance engineering tools like LTR.
Conclusion
Data collected by the UBI collector can be easily used to have a better understanding of our users. The resulting dashboard becomes a live pulse of what our users are searching for and can point to data gaps to drive improvements in our search engine.
Note: The o19s User Behavior Insights (UBI) plugin mentioned in this article is a third-party, community-maintained plugin and is not officially supported by Elastic. For questions or issues related to this plugin, please refer to the o19s UBI project repository at https://github.com/o19s/ubi.
Related Content

The hash() Elasticsearch won't name and the 12 bytes that prove it's Murmur3
Elasticsearch's routing formula uses MurmurHash3, but the docs never say so. This post names the function, walks through the full shard calculation, and shows you how to reproduce it externally.
May 12, 2026
Elasticsearch query logs: One coordinator-level line per query for ES|QL, DSL, SQL, and EQL
Easily understand query impact on cluster performance with Elasticsearch query logs. One coordinator-level line records ES|QL, DSL, SQL, and EQL per request and provides full query text, tracing, optional user context, and CCS hints
April 6, 2026
How to compare two Elasticsearch indices and find missing documents
Exploring approaches for comparing two Elasticsearch indices and finding missing documents.

Testing Elasticsearch. It just got simpler.
Explaining how Elasticsearch integration tests have become simpler thanks to improvements in Elasticsearch 9.x, the modern Java client, and Testcontainers 2.x.

December 19, 2025
Elasticsearch Serverless pricing demystified: VCUs and ECUs explained
Learn how Elasticsearch Serverless pricing works for Elastic’s fully-managed deployment offering. We explain VCUs (Search, Ingest, ML) and ECUs, detailing how consumption is based on actual allocated resources, workload complexity, and Search Power.