Observe, protect, and search your data with a single solution. From application monitoring to threat detection, Kibana is your versatile platform for critical use cases. Start your free 14-day trial now.
In this blog we are going to discover how to enable Vega Sankey visualizations to create Kibana Filters.
Vega is a standout tool in the world of data visualization, allowing you to create detailed and interactive visual displays of your data. Using a simple JSON syntax, Vega allows you to define how your visualizations look and behave. It's a key part of the Kibana ecosystem, meaning you can use it alongside other Kibana visualizations within your dashboards. An in-depth exploration of how Vega works can be found in this blog.
Vega shines when you need more than what Kibana's standard visualization tools offer. It lets you build custom visualizations tailored to your specific needs, whether you're dealing with complex data relationships or want a unique visual style.
A few years back, we shared a blog on how to create a Sankey chart in Kibana. Sankey charts are great for illustrating the relationship between two data fields. While the chart worked well, as Kibana grew with new features, a limitation became clear: the inability to create a Kibana filter directly from the chart.

In this blog, we are going to discover how we enabled the Sankey visualization from the previous blog to create Kibana Filters.
NOTE: when the code is copied to Kibana, it may present you a warning message stating:The URL is big and Kibana might stop working. To resolve this error go to Kibana Advanced settings and enable Store in Session.
Adjust Vega code
Kibana Filter
When you use Vega within Kibana, you gain access to special functions that allow you to adjust Kibana's settings directly from your Vega visualizations. These functions let you modify the Kibana context settings, enhancing the interactivity of your dashboards.
Here, we'll focus on using the kibanaAddFilter function. This function allows you to add a filter to the Kibana dashboard where your visualization is displayed. Keep in mind that these functions are exclusive to Vega and are not available in Vega-Lite.
Add a Filter to Kibana
We’re using the kibanaAddFilter function to add a Filter to Kibana when a stack is clicked in the visualization. Since the two stacks are both based on different fields, we need to make sure we are actually filtering on the correct field. This requires a conditional expression to determine which stack was clicked.

In Vega, you can use conditional expressions with the pattern: { condition ? if value : else value }. For our condition, we check if the clicked stack is stk1. This stk1 has been defined in the data section of our Vega code, and is used for the left stack in the chart. If the condition is true, it means the left stack was clicked, and we should filter on the geo.src field. If false, we filter on the geo.dest field, which corresponds to the right stack. With this logic, we can update the groupSelector in the signals section to reflect the correct filtering behavior.
Simplify Vega visualization by removing unused code
Now that the filtering is handled at the Kibana level, we can simplify our Vega visualization by removing some unnecessary logic. First, we can eliminate the filter logic from the data section of the Vega specification.
Secondly, we can remove the logic to show the “show all”-button from the signals.
Finally, the “show all” button itself can also be removed.
Change dataset for Sankey visualization
To fully utilize the Sankey visualization, you need to apply it to your own dataset. In this guide, we'll adjust the visualization to work with the Logs Kibana sample dataset. Start by ensuring the Sample web logs are loaded. Then, modify the Vega code to fit the new dataset by changing the index to kibana_sample_data_logs.
If @timestamp isn't used as the timestamp field for your dataset, you'll need to update the %timefield% setting. Setting the %timefield% settings ensures we are able to use the Kibana time range. Therefore, the Kibana time range should correspond to the time range of your dataset. To change the field used for one of the stacks, make adjustments in two areas: data retrieval and filtering logic. Since the Logs Kibana sample dataset has only one geo.src value, we'll change the field to machine.os.keyword.

Conclusion
Lens is the go-to visualization editor in Kibana because it's both flexible and user-friendly. However, for certain visualization types, Vega offers the flexibility to create visuals that Lens doesn't support, like the Sankey chart we discussed in this blog. Initially, the Sankey visualization couldn't create Kibana filters, a feature available in Lens. This blog shows how you can create Kibana filters with Vega using the kibanaAddFilter function.
Vega Code
The resulting Vega configuration can be found here in the Github Repository.
Note: we have updated the vega version to version 5, since that is the latest version at time of writing.
Frequently Asked Questions
What is Vega?
Vega is a standout tool in the world of data visualization, allowing you to create detailed and interactive visual displays of your data.
What is Vega in Kibana?
Vega (a standout tool for data visualization) is a key part of the Kibana ecosystem, it lets you build custom visualizations tailored to your specific needs.
What are Sankey charts?
Sankey charts are great for illustrating the relationship between two data fields.
Related Content

June 4, 2026
137,000 people, zero human decisions: agentic disaster response with Elasticsearch
Find out how a Kibana detection rule, a workflow and an AI agent automatically relocated 137,000 military personnel across seven installations when a hurricane hit, no dispatcher required.

May 26, 2026
Kibana dashboards as code: GitOps, drift detection and Terraform for Kibana dashboards in Elastic 9.4
Elastic 9.4 ships a typed Dashboards API and a native Terraform resource that bring drift detection, PR-reviewable diffs and git-based rollback to Kibana dashboards for the first time.

May 22, 2026
Kibana cuts dashboard load time by up to 25% - here's the polling strategy behind it
Find out how Kibana uses continuous polling and browser-side HTTP/2 detection to cut dashboard load times by up to 25%, with automatic fallback on HTTP/1.
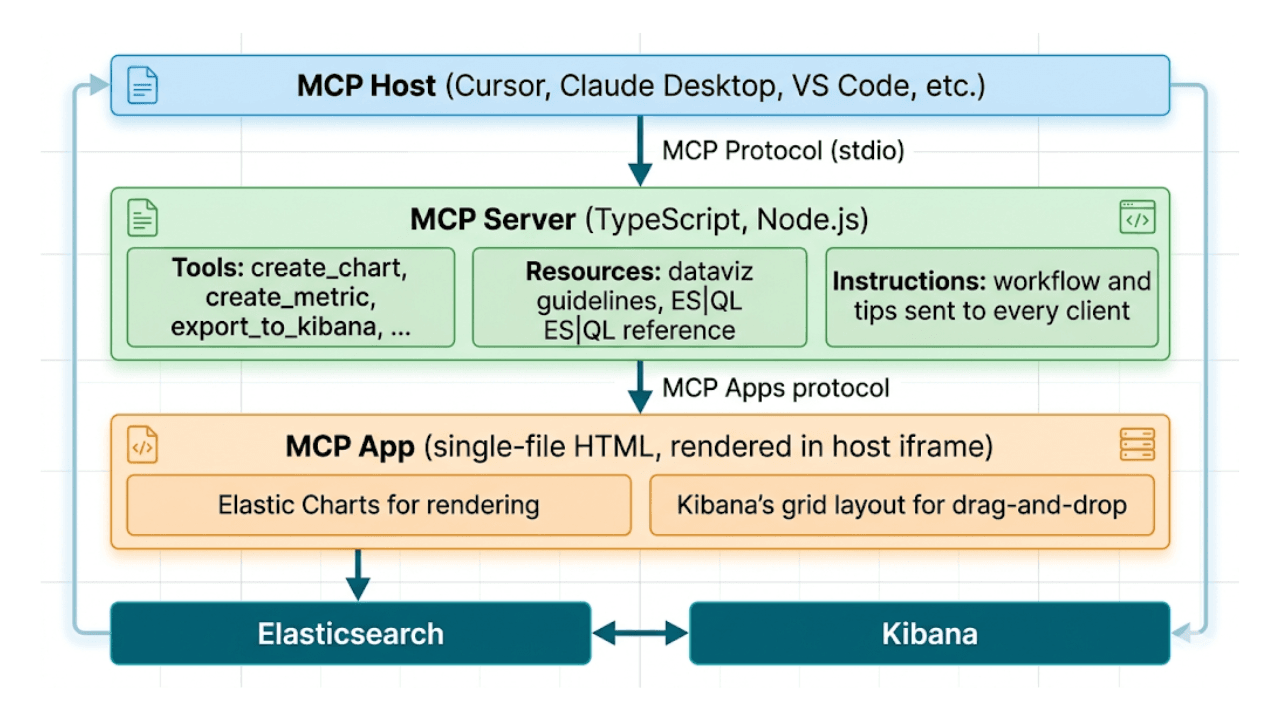
Describe it, don't draw it: AI-native Kibana dashboards via MCP and ES|QL
From prompt to dashboard. Learn how to build Kibana dashboards with natural language, using example-mcp-dashbuilder: an open source MCP application that writes ES|QL queries, creates interactive charts and exports fully functional dashboards directly to Kibana.

May 8, 2026
What’s new in Kibana Dashboards: flexible controls, improved defaults and a visual refresh
Kibana 9.4 ships a batch of dashboard improvements — from better defaults to layout controls to a visual refresh. Here's what changed and why.