On-demand webinar
Building charts with Kibana Lens
Hosted by:

Dustin Smith
Principal Product Marketing Manager
Elastic
Overview
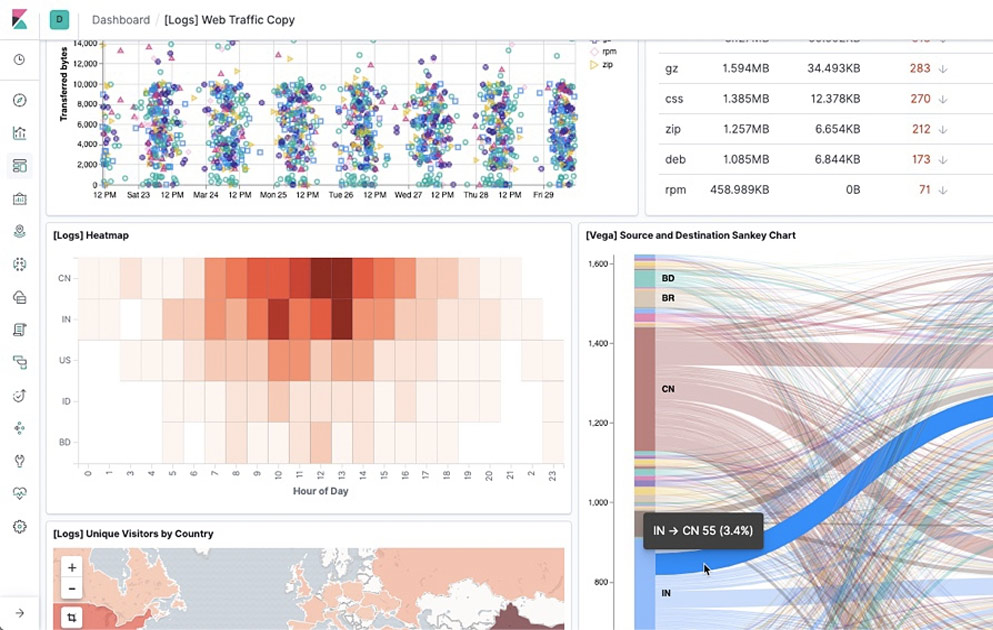
Kibana Lens provides a new, simple, and intuitive way for everyone to visualize their Elasticsearch data. In this webinar we’ll demonstrate how to connect to data and rapidly build charts using Lens’s drag-and-drop interface. This walkthrough is perfect for users who are brand new to Kibana, as well as more experienced Kibana data analysts who are interested in sharpening their visualization skills.
Highlights include:
- Live demonstration of Kibana Lens
- How to build bar, line, and area charts
- Using multiple data sources in a single visualization
- Understanding Kibana Lens’s smart suggestions feature
- Adding visualizations created in Kibana Lens to Kibana dashboards
You can, try hosted Kibana (and Elasticsearch) with a no-cost Elastic Cloud 14-day trial.
Additional Resources:
View next
Upcoming webinar
How WP Engine brings AI innovation to websites with Elastic and Google Cloud