What is OpenTelemetry?
OpenTelemetry definition, benefits, and key components
OpenTelemetry (OTel) is an open source observability framework for collecting, processing, and exporting telemetry data (logs, metrics, and traces) in a single, unified format.
It was developed by the Cloud Native Computing Foundation (CNCF) to standardize how telemetry data is collected and sent to observability backends. OpenTelemetry provides vendor-neutral SDKs, APIs, and tools, so your data can then be sent to any observability backend for analysis that is OpenTelemetry compliant.
OpenTelemetry is fast becoming the dominant observability telemetry standard in cloud-native applications. Adopting OpenTelemetry is considered critical for organizations that want to be prepared for the data demands of the future without being tied to a specific vendor or the limitations of their existing technologies.
Understanding telemetry data (logs, metrics, and traces)
Telemetry data is the foundation of modern observability. The three pillars — logs, metrics, and traces — give developers, DevOps, and IT teams deep insight into system behavior, performance, and health.
- Logs: A textual record of a discrete event at a specific time
- Example: A login attempt recorded with timestamp, user ID, and IP address
- Best for: Troubleshooting, debugging, and verifying code execution
- Metrics: Numeric measurements over time (time series data) that reflect system performance
- Example: CPU utilization at 85% or HTTP request rate of 1,200/s
- Best for: Real-time monitoring, alerts, and trend analysis
- Traces: The path of a request or transaction through multiple system components, broken into spans
- Example: Tracking a checkout process across microservices in an ecommerce platform
- Best for: Identifying performance bottlenecks and understanding request flows in distributed architectures
For detailed setup guidance on collecting each telemetry type with OpenTelemetry, see our documentation on getting started with OpenTelemetry in Elastic.
Brief history of OpenTelemetry
Before OpenTelemery, the industry relied on OpenTracing and OpenCensus, which were two overlapping projects serving similar purposes with different implementations. To eliminate fragmentation, the CNCF merged them into a single project: OpenTelemetry.
Key legacy components:
- OpenTracing: Vendor-neutral APIs for sending telemetry data
- OpenCensus: Language-specific libraries for metrics/traces collection
Merge outcome: OTel combines both into a single framework with:
- APIs
- SDKs
- Instrumentation options
- A collector service
OpenTelemetry emerged from the unification of OpenTracing and OpenCensus, combining strengths to create a single, global standard for observability.
With OpenTelemetry, developers no longer have to choose between OpenTracing and OpenCensus. OpenTelemetry provides a unified set of libraries, APIs, agents, and collector services for collecting and transferring data.
How OpenTelemetry works
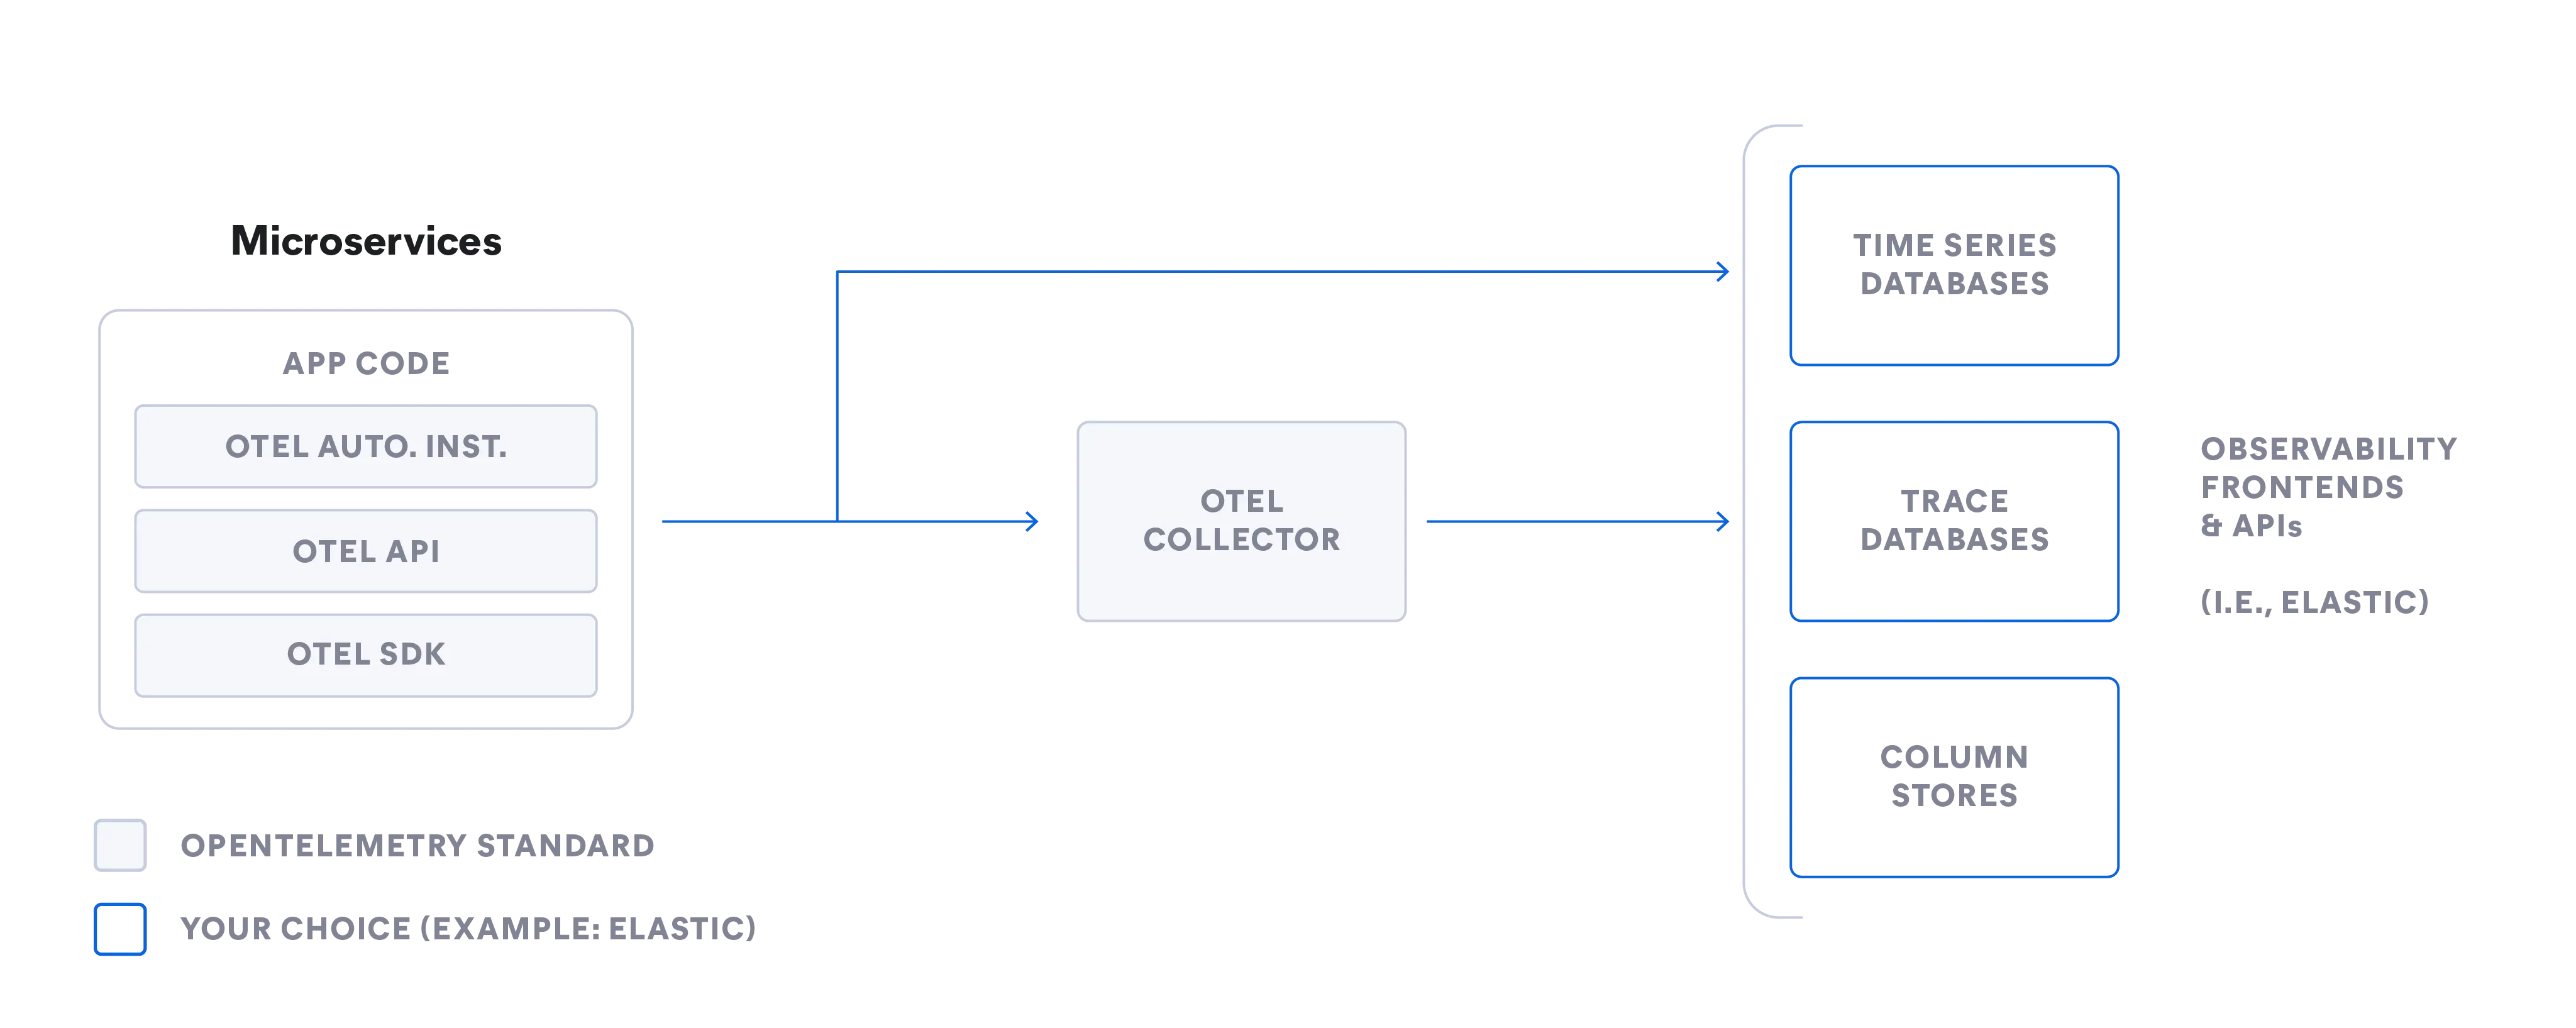
OpenTelemetry provides a standardized pipeline for collecting telemetry data and sending it to an observability back end of your choice. It is designed to be vendor-agnostic and extensible.
- APIs: Language-specific interfaces for generating telemetry data
- SDKs: Implement the APIs and handle data processing, batching, and exporting
- Instrumentation:Can be automatic (no code changes) or manual (custom metrics/events)
- Exporters: Send processed data to one or more destinations using standard protocols like OTLP
Language-specific OpenTelemetry APIs coordinate telemetry data collection across your system and instrument your code. OpenTelemetry SDKs implement and support APIs through libraries that help with data collection, processing, and exporting. OpenTelemetry also provides automatic instrumentation of services and supports custom instrumentation. You can export your telemetry data using either a vendor-provided exporter or the OpenTelemetry Protocol (OTLP).
Core components of OpenTelemetry
The core components of OpenTelemetry include:
| Component | Purpose | Example usage |
|---|---|---|
| Collector | Receives, processes, and exports telemetry data in multiple formats; vendor-neutral | Aggregating logs, metrics, and traces from Kubernetes clusters before sending to Elastic |
| Language SDKs | Implements the OpenTelemetry API for a specific programming language | Using the Python SDK to instrument an application written in Python |
| Instrumentation libraries | Auto-instruments popular frameworks and libraries for telemetry generation | Collecting HTTP request metrics from Spring Boot automatically |
| Automatic instrumentation | Adds telemetry capabilities without code changes | Injecting a Java agent to monitor JVM-based microservices |
| Exporters | Sends collected data to one or more observability back ends | Exporting traces to Jaeger and metrics to Prometheus |
These components enable flexible, standardized data collection, independent of back end choice.
Our OpenTelemetry collector setup with Elastic documentation contains a complete installation walkthrough.
Benefits of OpenTelemetry
The benefits of OpenTelemetry are data standardization and future-proof flexibility that results in improved observability, increased efficiency, and reduced costs.
- Standardization
- Use a single collection method for multiple back ends: Elastic, Splunk, Datadog, and more.
- Reduce pipeline complexity with a single extensible framework for logs, metrics, and traces.
- Vendor neutrality
- Switch back ends without re-instrumenting applications.
- Easily adopt new observability tools without a full rip-and-replace.
- Keep flexibility as your technology stack evolves.
- Consistent data
- Maintain easier processing and analysis with a unified common schema.
- Run analytics, queries, machine learning, and more across data from different sources.
With OpenTelemetry, you get scalability for growth, compatibility across platforms, and easy integration with your existing monitoring and observability tools.
OpenTelemetry and Elastic integration
As a long-time proponent of open standards, Elastic is committed to advancing the adoption of OpenTelemetry across the industry through active contribution and collaboration.
Elastic Observability seamlessly integrates OpenTelemetry data and adds powerful search, analytics, machine learning, and visualization at scale. In 2023, Elastic contributed ECS to OpenTelemetry to help unify telemetry data formats.
Elastic Distributions of OpenTelemetry (EDOT) provides SREs and developers with a stable OTel ecosystem. With Elastic's OTel-first approach preserving the OpenTelemetry-native schematic conventions, no schema conversions are needed. EDOT additionally includes fixes beyond OTel release cycles and enterprise-grade support without proprietary add-ons.
Explore Elastic's OpenTelemetry-first solutions
CI/CD observability use cases with OpenTelemetry and Elastic
Elastic works with popular CI/CD platforms like Jenkins, Ansible, and Maven to instrument pipelines with OpenTelemetry.
This enables:
- End-to-end pipeline visibility
- Live monitoring dashboards
- Automated alerting and anomaly detection
- Faster troubleshooting of build/test issues
You can find setup instructions for using OpenTelemetry with Elastic CI/CD monitoring in our official documentation.
OpenTelemetry FAQ
Is OpenTelemetry a standard?
Yes. OpenTelemetry is an open source project and a unified standard for logs, traces, and metrics.
What are examples of telemetry?
Examples of telemetry data include logs, metrics, and traces used in system monitoring and observability.
What is the difference between OpenTelemetry and Jaeger?
OpenTelemetry helps you process and export data to a variety of open source and commercial back ends, but it is not an observability back end like Jaeger. While OpenTelemetry provides a set of APIs, SDKs, and tools to help generate and manage telemetry data, Jaeger is an open source distributed tracing tool. IT teams use Jaeger to monitor and troubleshoot applications based on microservices architecture. Jaeger does not support logs and metrics.
What is the difference between OpenTelemetry API and SDK?
OpenTelemetry APIs, or application programming interfaces, coordinate telemetry data collection across your system and instrument your code. Because APIs are language-specific, they must match the language of your code. OpenTelemetry SDKs, or software development kits, implement and support APIs through libraries that help with data collection, processing, and exporting to an observability back end.
Who developed OpenTelemetry and why?
OpenTelemetry was developed under the Cloud Native Computing Foundation (CNCF) to unify and standardize how telemetry data is collected and exported. It merged the earlier OpenTracing and OpenCensus projects to eliminate fragmentation.
What is the OpenTelemetry Protocol (OTLP) and why is it important?
OTLP is OpenTelemetry's default, vendor‑neutral protocol for sending telemetry data between components and back ends. It ensures all data — logs, metrics, and traces — is transmitted in a consistent format, making integration between tools simpler and more reliable.
What is the OpenTelemetry Collector?
The OpenTelemetry Collector is a vendor‑neutral service that receives telemetry data from multiple sources, processes it (filtering, aggregating, or transforming), and exports it to one or more back ends. It supports various protocols and formats within a single deployment.
How does OpenTelemetry integrate with Elastic?
You can bring OTel-native traces, logs, and metrics into Elastic from any third-party OTel tool — or from your own OTel collectors using custom processors and exporters — for analysis and visualization in Elastic. Elastic natively ingests OTLP data from OpenTelemetry and provides advanced capabilities such as scalable search, interactive visualization, real‑time monitoring, and machine learning–based anomaly detection. No schema conversions are needed.
Elastic's OpenTelemetry resources
- Elastic Distributions of OpenTelemetry (EDOT)
- Getting started with OpenTelemetry in Elastic APM
- Building a custom OpenTelemetry collector distribution
- OpenTelemetry instrumentation with the Elastic Stack
- SRE manager’s guide to OpenTelemetry
- On‑demand webinar: Observability in the open: OTel for public sector
- Public sector observability with OTel and Elastic