Metrics monitoring built on the Elasticsearch Platform SREs trust
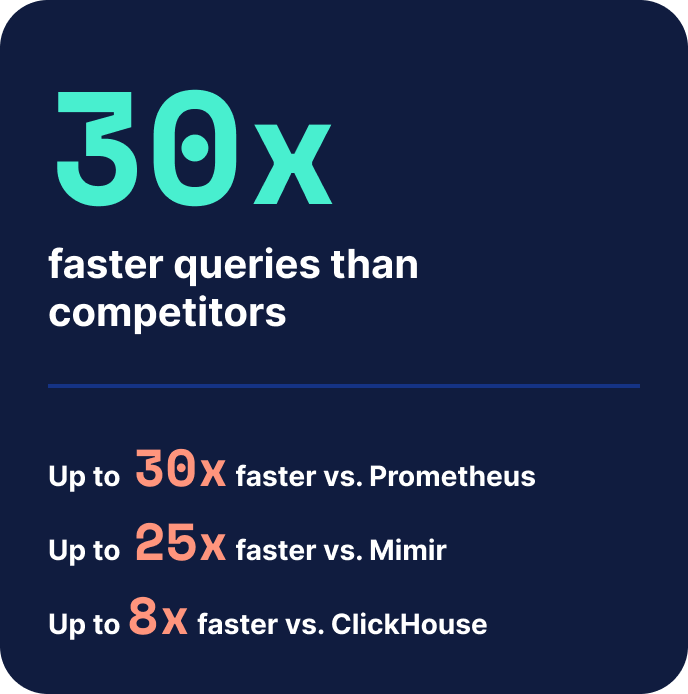
Elastic pairs best-in-class metrics efficiency with the industry's richest log analytics solution. Up to 30x faster queries than competing TSDBs, built on a columnar datastore engineered for high-cardinality workloads that scale without breaking the bank. With native PromQL so you can keep the workflows you love.
Meet the columnar metrics engine that's best in its class
The Elasticsearch columnar datastore outpaces others in metrics ingest, storage, and query speed at any scale.
Scale without dropping data
The engineering depth that set the standard for log ingest, storage, and query performance is exactly what we applied to building a better TSDB for high-cardinality metrics. Same team, same rigor, new data type — built to retain every metric at full resolution without the price tag.


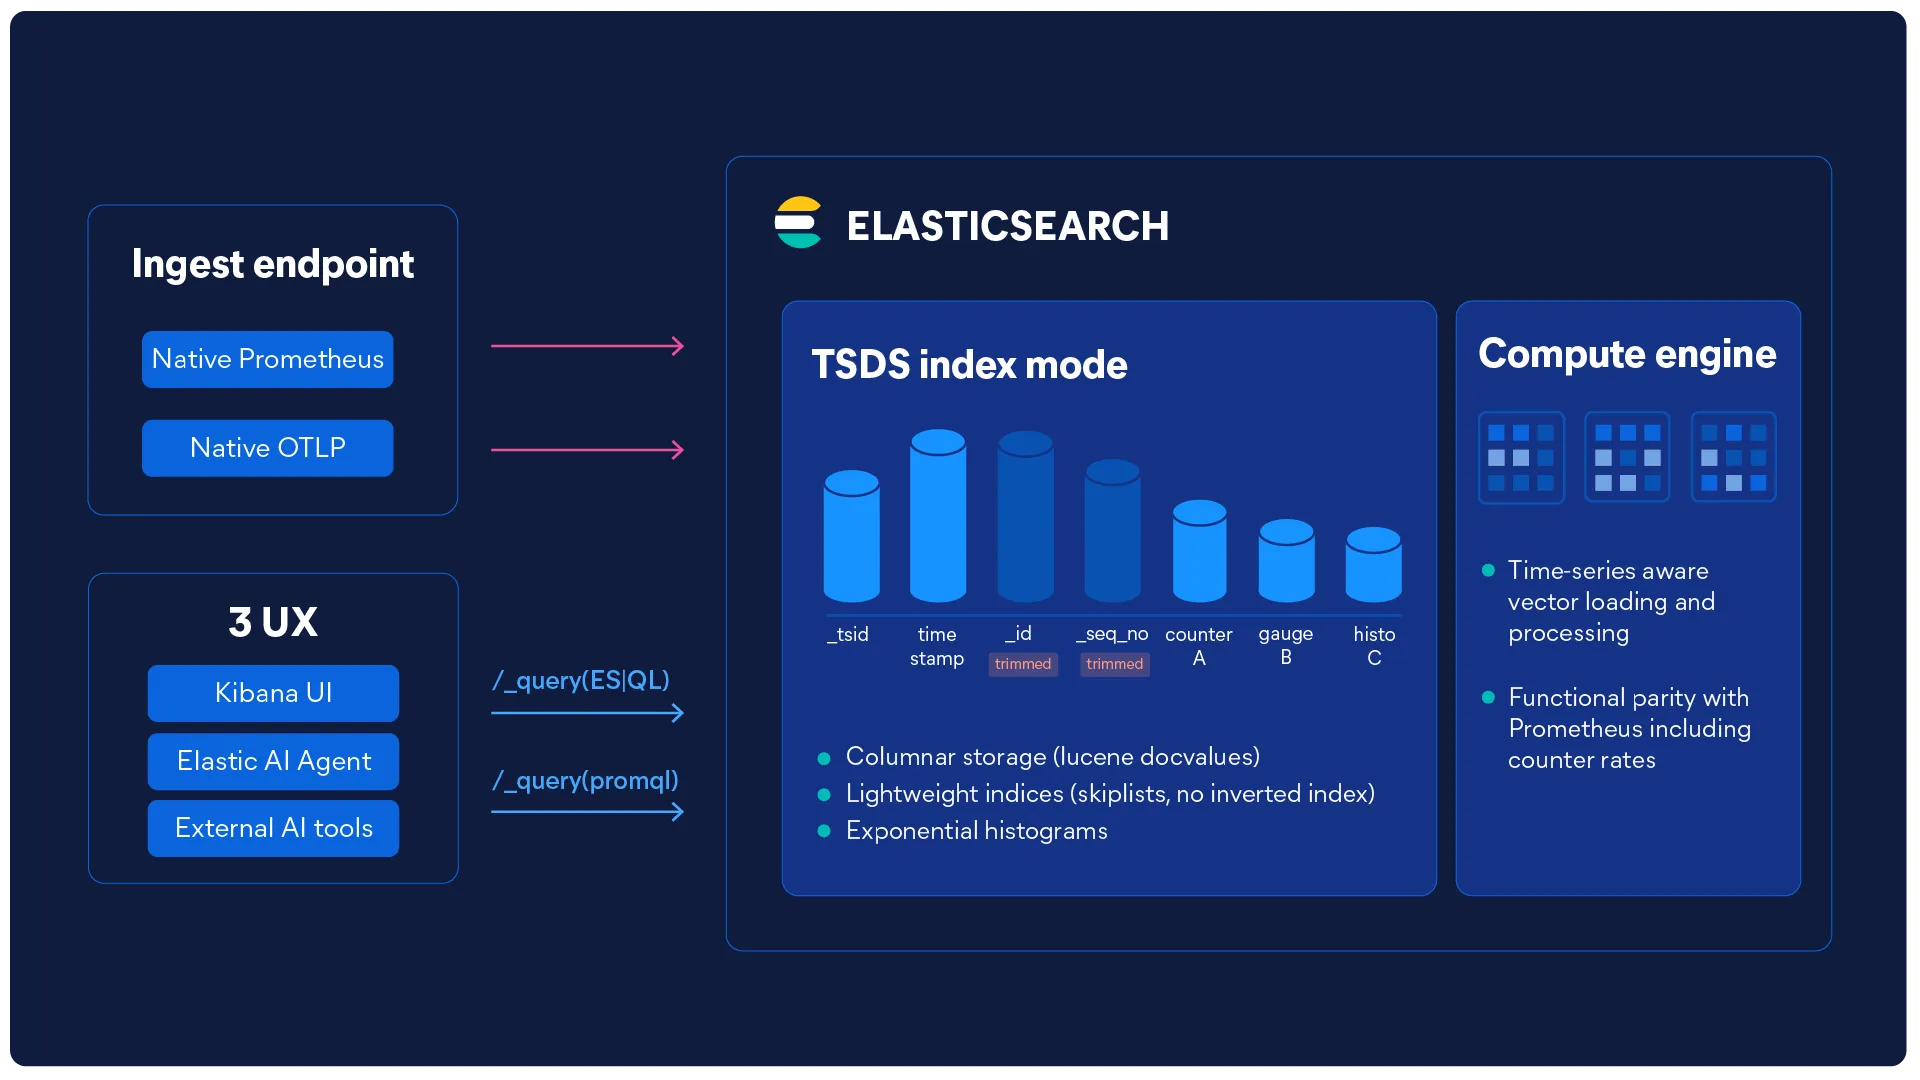
Elasticsearch doesn't scan rows. It reads columns.
Elasticsearch's segment-based storage is columnar by design, ensuring sub-second response on millions of time series with vector loading and processing.
ELASTICSEARCH 9.4 BENCHMARKS
Engineering that shows up in the numbers
Head-to-head across the three metrics that define a production-grade TSDB: query speed, storage density, and ingest throughput
| Dimension | Elasticsearch 9.4 | Prometheus | Mimir | ClickHouse |
|---|---|---|---|---|
| Query speedHigh-cardinality time series | Fastest Baseline |
Up to 30x slower | Up to 30x slower | Up to 8x slower |
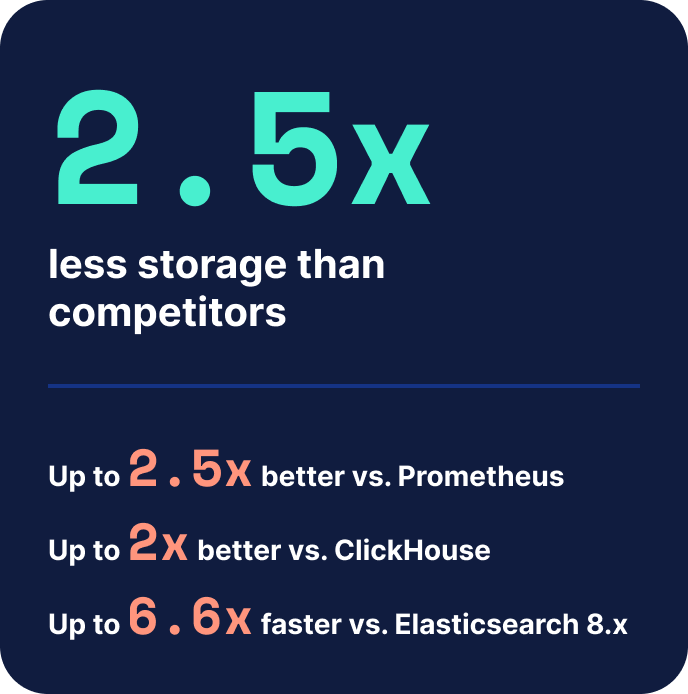
| Storage densityBytes/sample | Best 3.74 B |
~9.42 B | ~3.95 B | ~6.8 B |
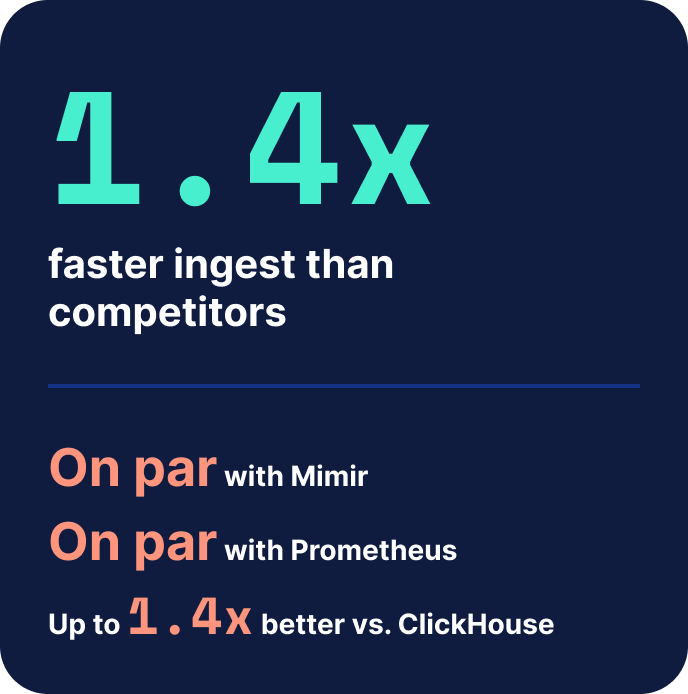
| Ingest throughputSamples/second | Fastest 428K/s |
402K/s | 404K/s | ~300K/s |
| Native PromQLNo adapter required | Native | ✓ Native | ✓ Native | Requires adapter |
| OTel-nativeNo schema conversion | OTel-first | Via exporters | Via exporters | Manual mapping |
THE INNOVATION THAT MADE IT POSSIBLE
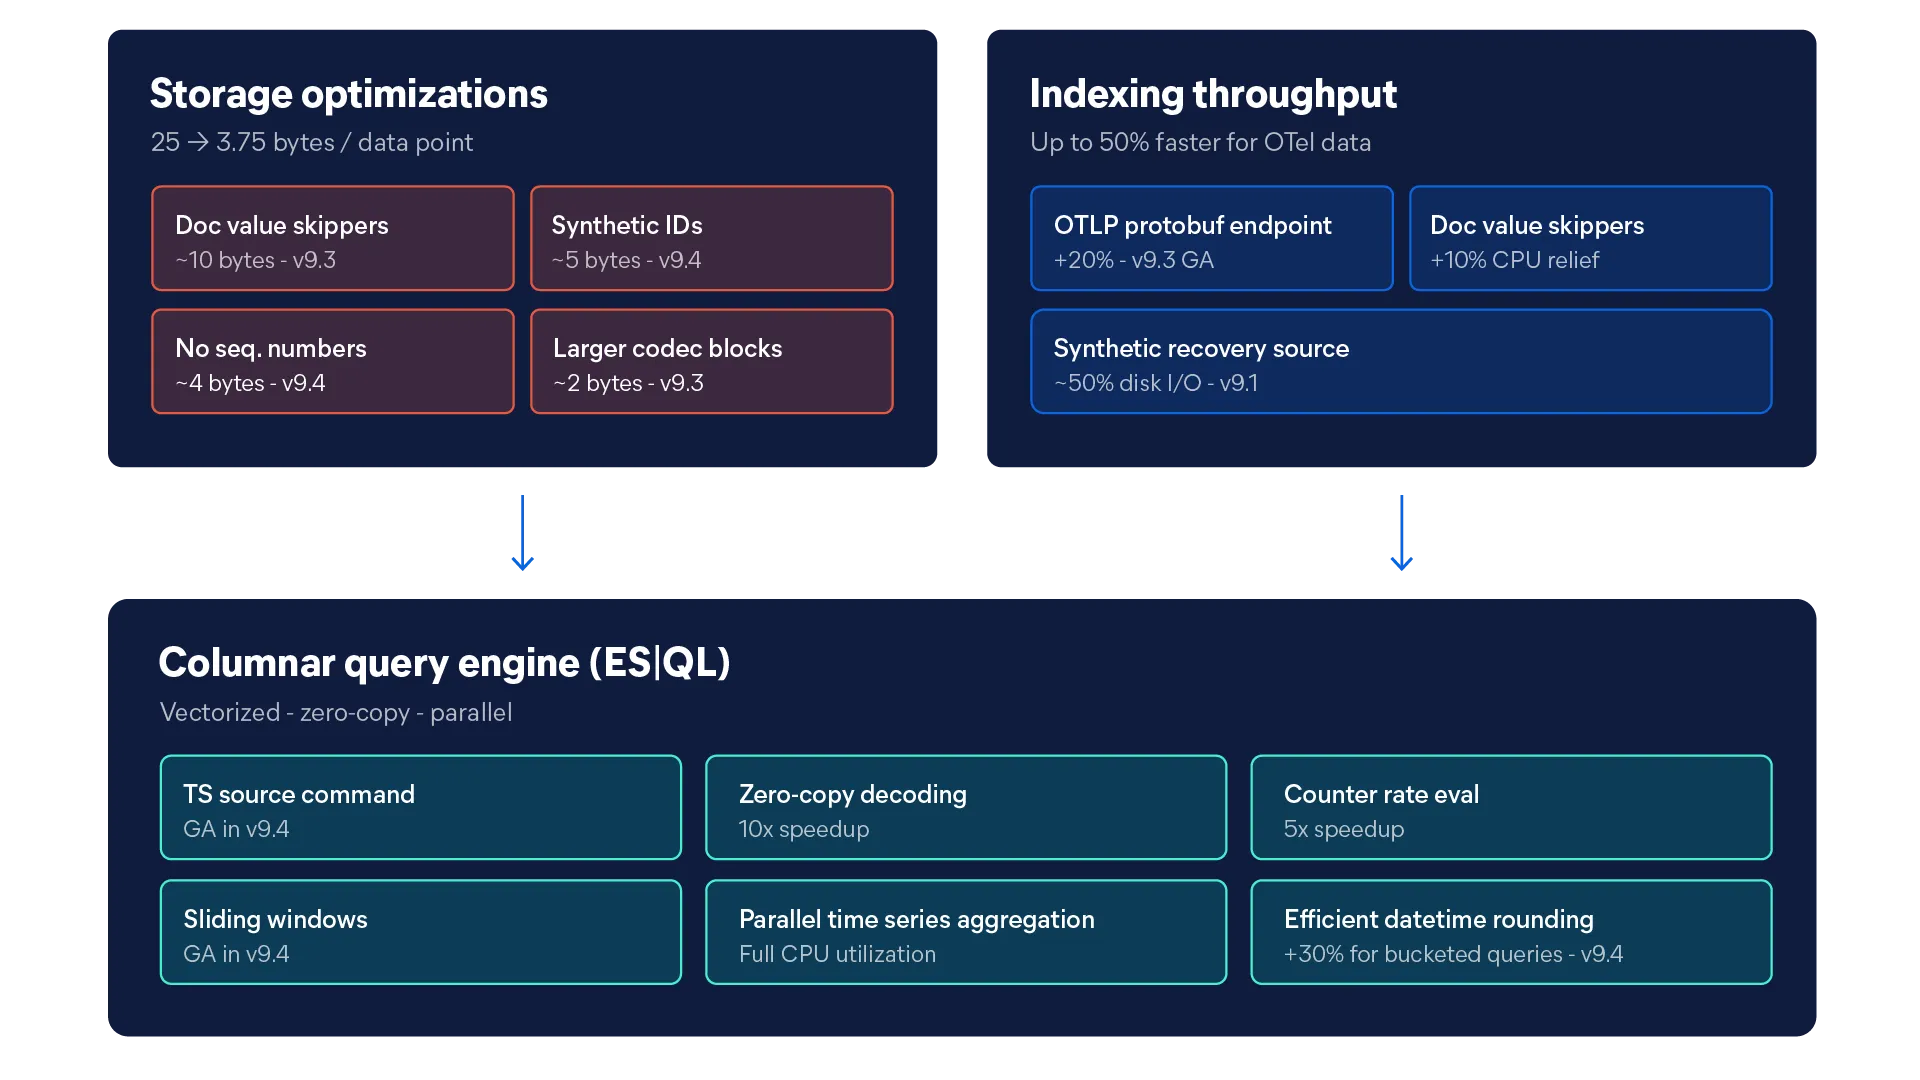
Building the Elasticsearch columnar metrics engine
From storage architecture to query execution, each part of our platform was built with purpose. Here's the engineering that made it real.
Migration tool — tech preview
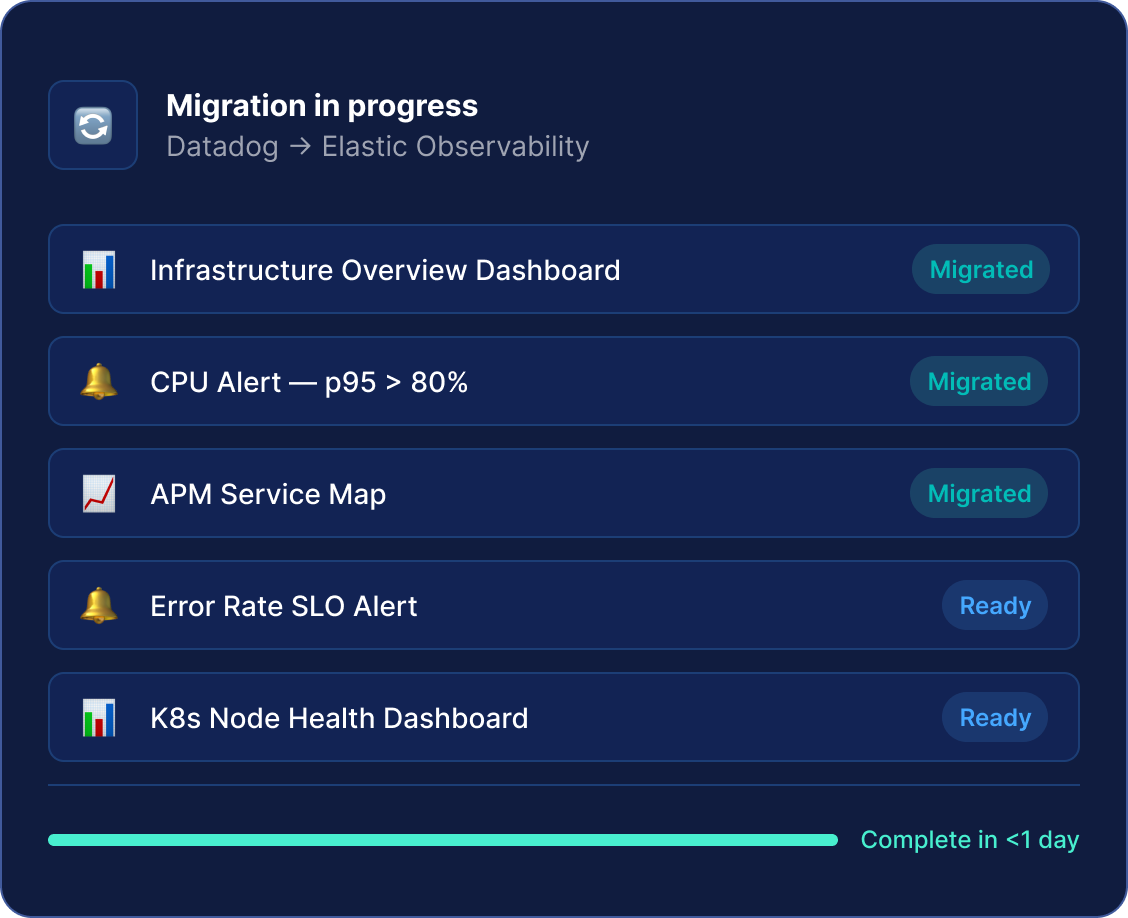
Migrate from Datadog or Grafana overnight
Automatically convert dashboards and alerting rules from Datadog and Grafana into Elastic, dramatically reducing the cost and complexity of switching platforms.
Ready to switch and save 50% on your Datadog metrics bill?
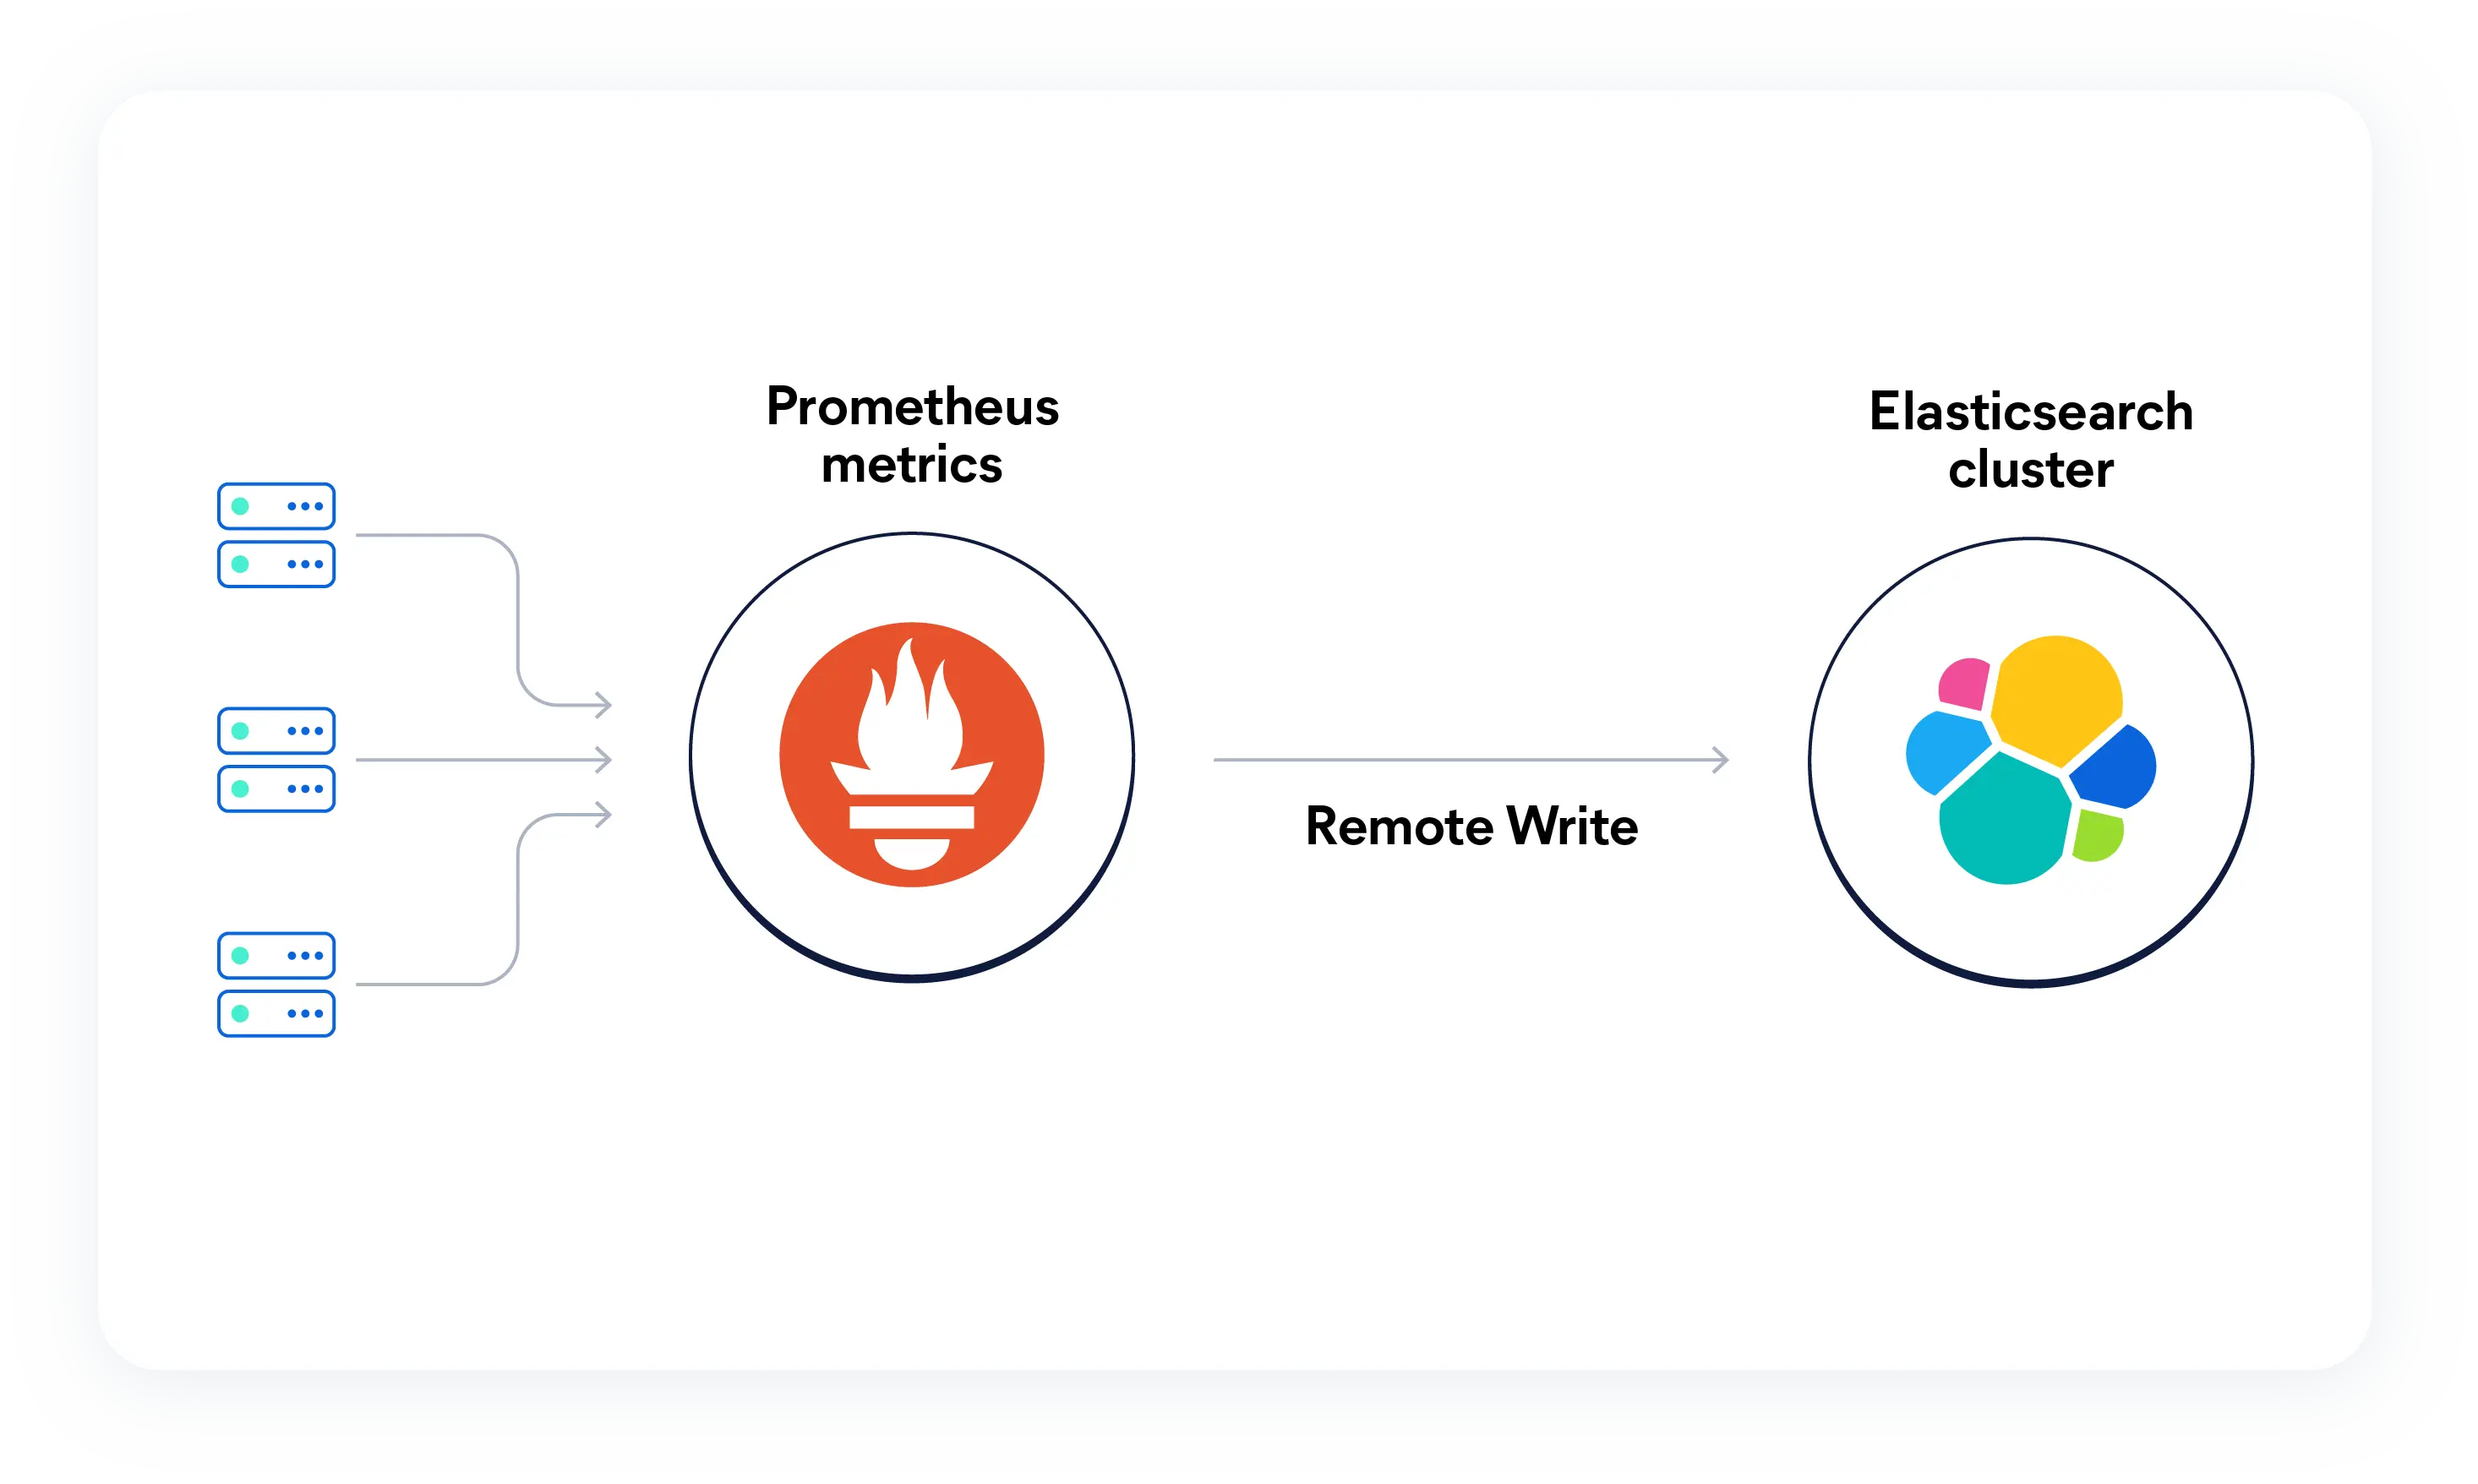
Start shipping Prometheus metrics to Elastic
The Prometheus Remote Write endpoint requires no extra configuration. Once metrics are flowing, you can query them with ES|QL using the built-in PROMQL function for PromQL compatibility, or write native ES|QL queries to join metrics with logs and traces in the same store.
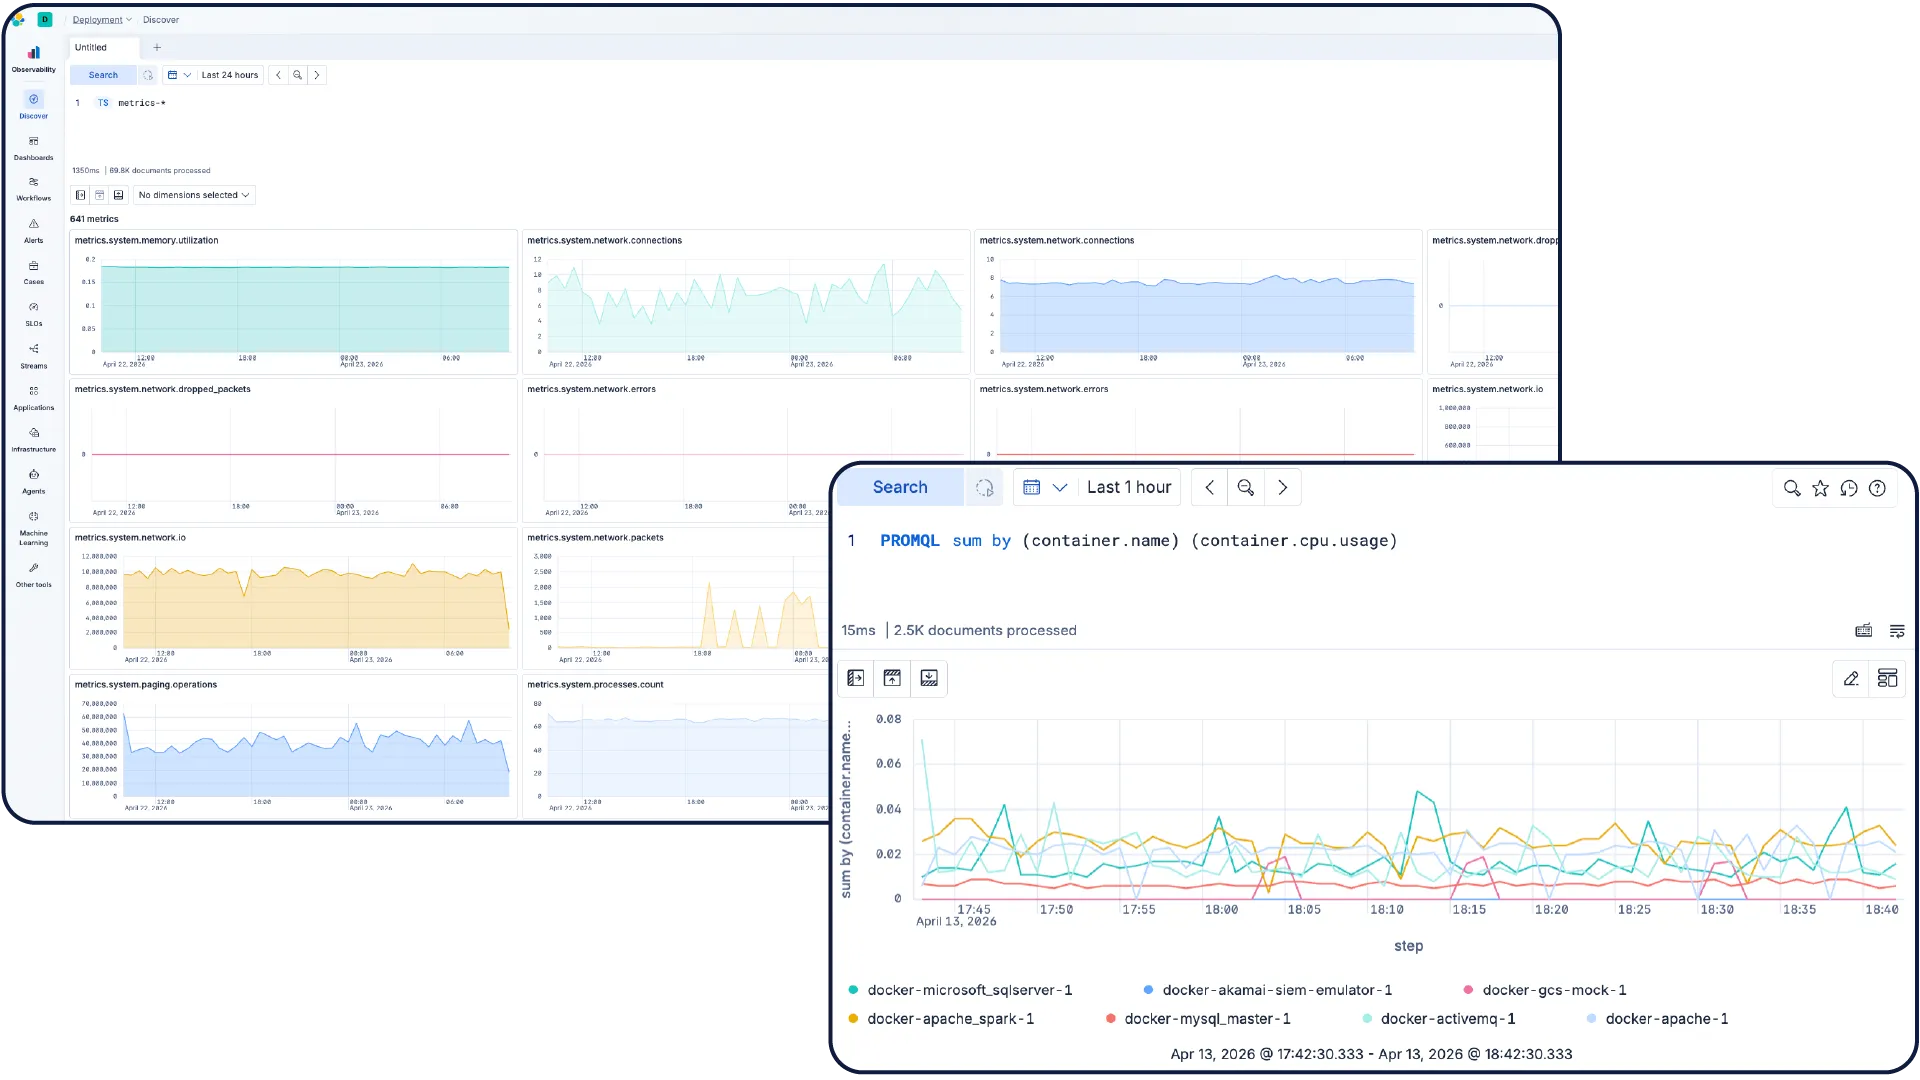
Turn metrics into action
Monitor your infrastructure at scale. Explore metrics in Discover, build dashboards as code, and let AI-led investigations highlight anomalies, uncover trends, and automate remediation, so you can plan capacity and resolve issues faster.
Frequently asked questions
Can Elasticsearch replace Prometheus for metrics monitoring?
Can Elasticsearch replace Prometheus for metrics monitoring?
Yes. Elasticsearch includes a native Prometheus Remote Write endpoint, PromQL support via the built-in PROMQL function in ES|QL, and a columnar metrics engine designed for high-cardinality time series. Teams can migrate from Prometheus in a day by automatically converting their existing Grafana dashboards and alert rules.
How does Elasticsearch compare to Prometheus for query speed?
How does Elasticsearch compare to Prometheus for query speed?
In Elasticsearch 9.4 benchmarks, Elasticsearch queries high-cardinality time series up to 30x faster than Prometheus. Storage efficiency is also higher: Elasticsearch stores metrics at 3.74 bytes per sample, compared to approximately 9.42 bytes for Prometheus.
Does Elasticsearch support OpenTelemetry (OTel) metrics natively?
Does Elasticsearch support OpenTelemetry (OTel) metrics natively?
Yes. Elasticsearch is OTel-first and ingests metrics in their native OpenTelemetry format without schema conversion. Prometheus and Beats formats are supported natively, each stored as-is without a translation layer.
How long does it take to migrate from Datadog or Grafana to Elasticsearch?
How long does it take to migrate from Datadog or Grafana to Elasticsearch?
Elastic provides a migration tool (currently in tech preview) that automatically converts Datadog and Grafana dashboards and alerting rules into Elastic/Kibana format. For Prometheus migration, connecting Prometheus Remote Write to Elasticsearch requires only a configuration change.
What is a TSDB and why does it matter for metrics monitoring?
What is a TSDB and why does it matter for metrics monitoring?
A TSDB (time series database) is a database optimized for storing and querying data indexed by time, like infrastructure metrics. Elasticsearch's time series data streams (TSDS) use a columnar storage engine that processes data in batches and applies synthetic ID trimming and doc value skippers to reduce storage size, making it faster and cheaper than traditional row-based alternatives.
What makes columnar storage faster for metrics queries?
What makes columnar storage faster for metrics queries?
Columnar storage makes metrics queries faster because it reads only the data columns relevant to a query rather than scanning entire rows. In a time series workload, this means the database can pull just the values it needs — say, CPU usage over a 24-hour window — without touching unrelated fields. Elasticsearch takes this further with a vectorized query engine that processes data in batches, enabling sub-second response times even across millions of time series at high cardinality.