Your AI agent needs an alibi: Observability and audit trails for Agent Builder in Elastic
Elastic 9.5 traces every Agent Builder run as OpenTelemetry spans in your own cluster, so tool calls and token counts are queryable with ES|QL. One workflow step adds the approval record, in a data stream the pipeline cannot rewrite.
Build and observe AI agents where your data already lives. Begin with Elastic Agent Builder. You can also start a free cloud trial or try Elastic on your local machine today.
One question to an Elastic Agent Builder agent produced 24 spans, 10 model calls across two models, and roughly 160,000 input tokens. Elastic 9.5 records AI agent observability data without a collector or a scraper. Every run lands as OpenTelemetry traces in your own cluster, on by default, writing to traces-agent_builder.otel-<space-id> down to each ES|QL query the agent generated and each index it looked up.
Those traces show how the agent reached its recommendation and what it cost. They do not record who approved it. Below: how to read the traces, scope the three identities a run touches, and append the approval decision to a data stream the pipeline cannot rewrite.
Prerequisites
- Elastic Stack 9.5 or Serverless
- Privileges to manage Kibana advanced settings, needed to install the traces dashboard.
Where Elastic Observability records each part of an AI agent action
Four questions come up in every review of an agentic operations pipeline, and each one is answered by a different record.
| Question | Where the answer lives | Who creates it |
|---|---|---|
| How did the agent reach its recommendation? | traces-agent_builder.otel-* spans | Agent Builder, automatically |
| Which tools did it call, and did they fail? | execute_tool spans in the same data stream | Agent Builder, automatically |
| Whose privileges did the run execute with? | Workflow execution record and Elasticsearch security audit logs | Kibana, partly |
| What did a human decide, and did the action run? | An index you write to yourself | You |
The first two are new in 9.5 and cost nothing but a toggle. The last one has no automatic source, so it is the one most pipelines are missing.
The scenario: a stale pricing cache in checkout
Three checkout-service workers serve production traffic. One of them, checkout-worker-1, was rolled to version 2026.07.26.1 and now returns HTTP 500 on every quote because its pricing cache stopped refreshing. The other two stay on 2026.07.25.3 and serve normally.
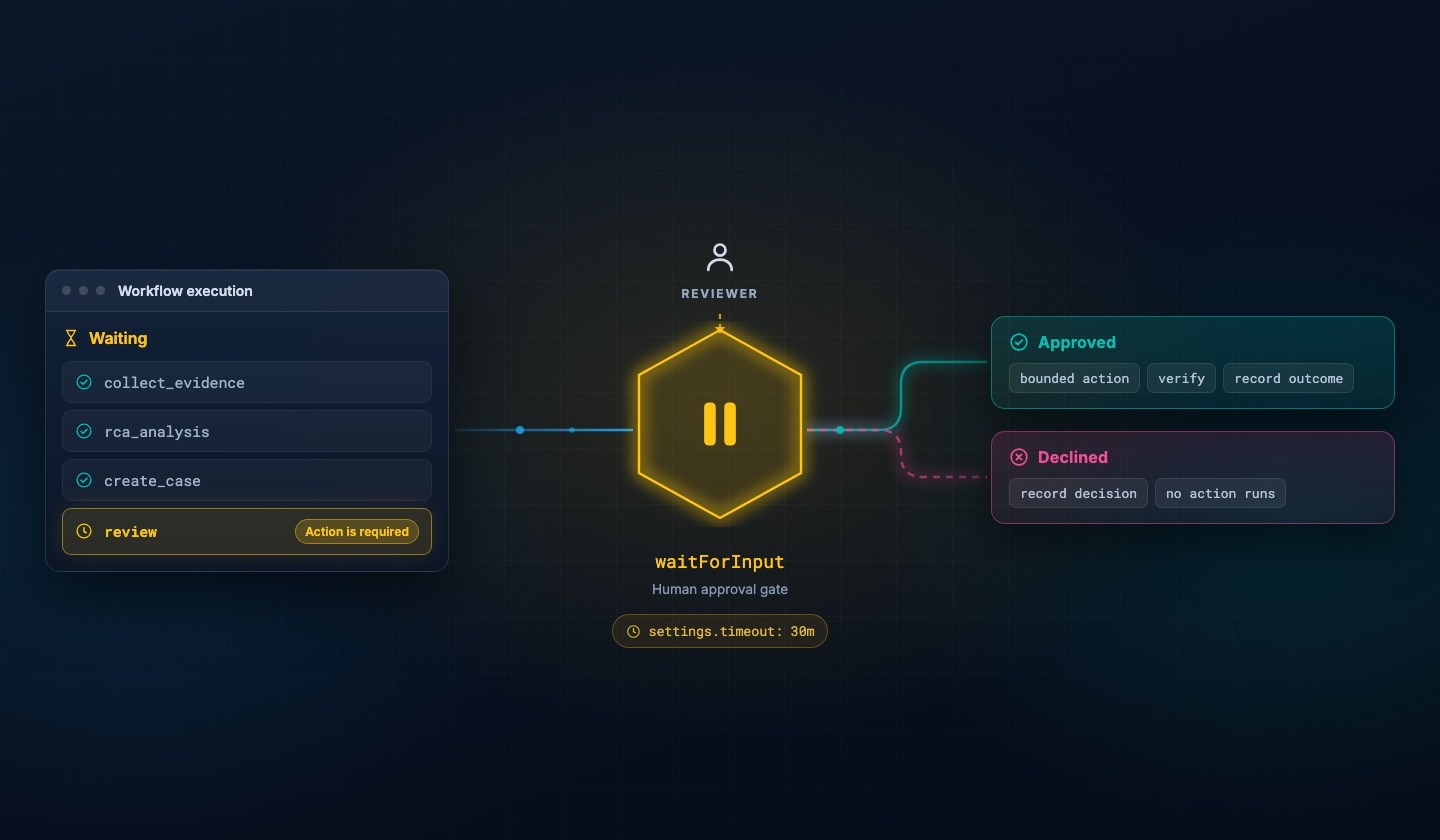
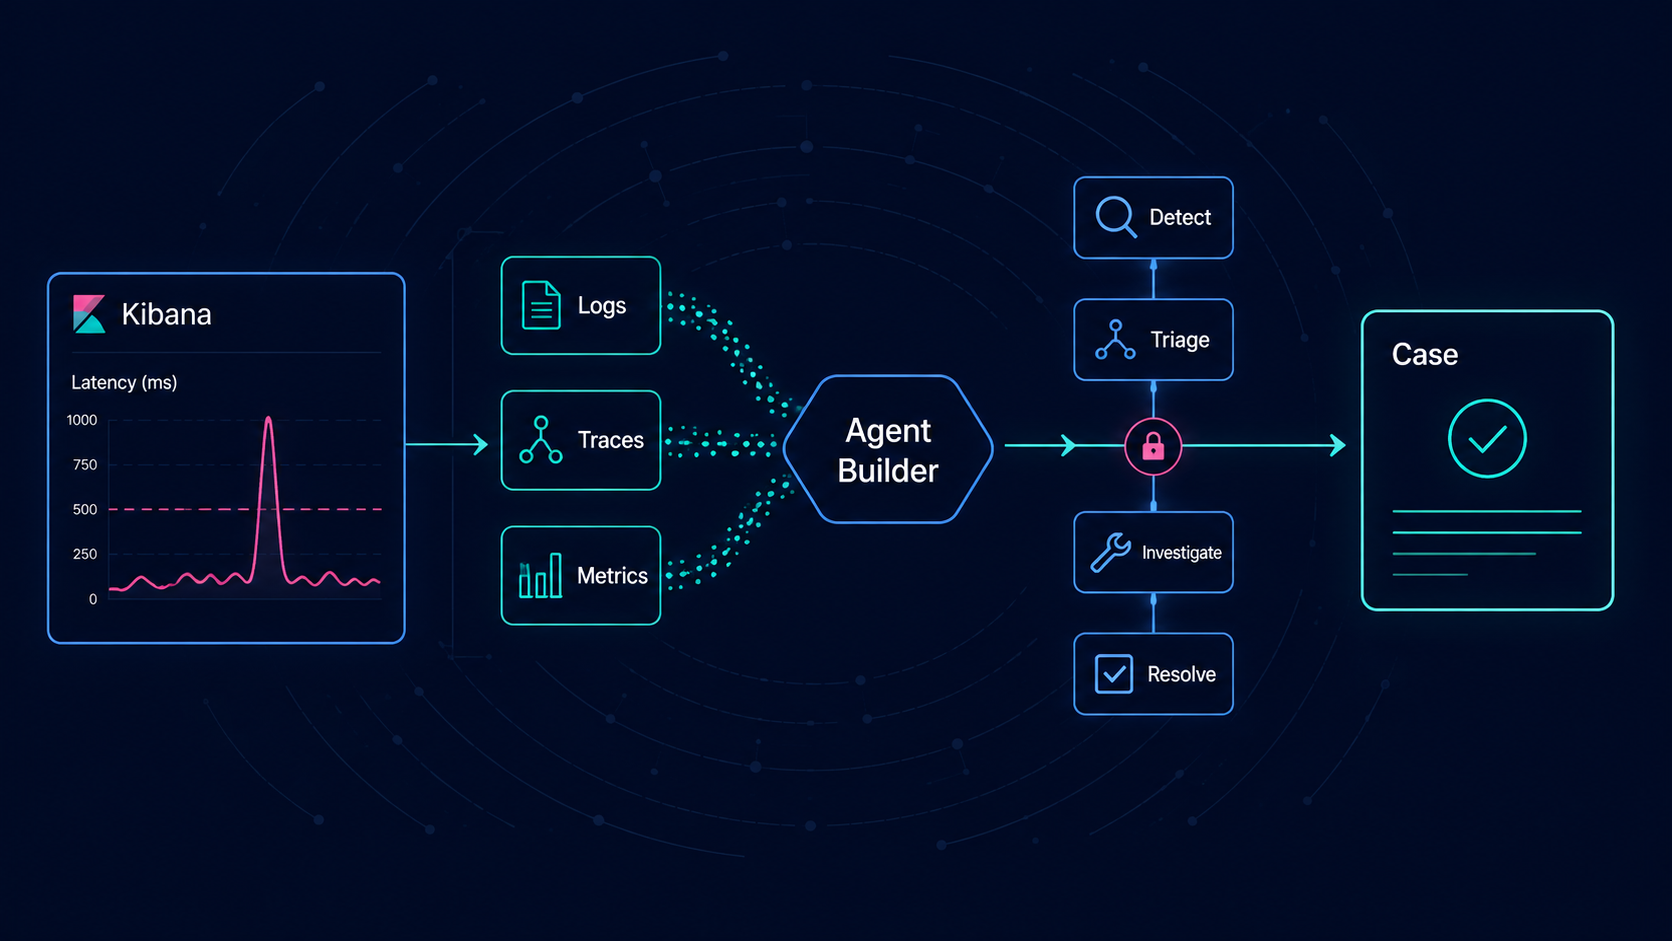
The SRE control plane pattern behind this setup connects telemetry, an Agent Builder agent that reasons over it, and Elastic Workflows that run known actions, with a human approval gate before the first step that changes production.
Telemetry arrives through the documented OpenTelemetry path, so the agent reads standard OTel fields. Elasticsearch 9.5 exposes a native OTLP endpoint, which lets an OTel SDK write directly to the cluster with no collector in between:
from opentelemetry.exporter.otlp.proto.http._log_exporter import OTLPLogExporter
from opentelemetry.sdk._logs import LoggerProvider
from opentelemetry.sdk._logs.export import BatchLogRecordProcessor
from opentelemetry.sdk.resources import Resource

provider = LoggerProvider(
    resource=Resource.create({
        "service.name": "checkout-service",
        "deployment.environment": "production",
    })
)
provider.add_log_record_processor(
    BatchLogRecordProcessor(
        OTLPLogExporter(
            endpoint=f"{ES_URL}/_otlp/v1/logs",
            headers={"Authorization": f"ApiKey {API_KEY}"},
        )
    )
)
The endpoint speaks OTLP over protobuf and rejects application/json with HTTP 406, so send it through an SDK or collector rather than hand-built JSON. That writes 450 records to logs-generic.otel-default: 360 healthy events across the three workers and 90 PricingCacheStaleError events from the broken one. The agent is given none of that context and has to find it by querying.
Reading AI agent observability traces in Elastic
Everything Agent Builder records about a run lives in two data streams, and all of it is queryable with ES|QL.
How to turn on AI agent tracing in GenAI Settings
Open Stack Management, then GenAI Settings, and find the Agent Builder Traces section. Collect conversation traces is on by default in 9.5.
Two details on that panel matter more than the toggle. Traces are written to traces-agent_builder.otel-<space-id>, one data stream per Kibana space, with a companion logs-agent_builder.otel-<space-id> for agent-side events. These are ordinary data streams on the standard OTel index templates, not hidden system indices, so Discover, Lens, and ES|QL query them directly.
The callout states the access model plainly: anyone who can read the index can read every trace in it. Trace access is not scoped per user, so restrict the index pattern through a role before granting access to a space with sensitive conversations.
Reading the LLM trace waterfall for one agent run
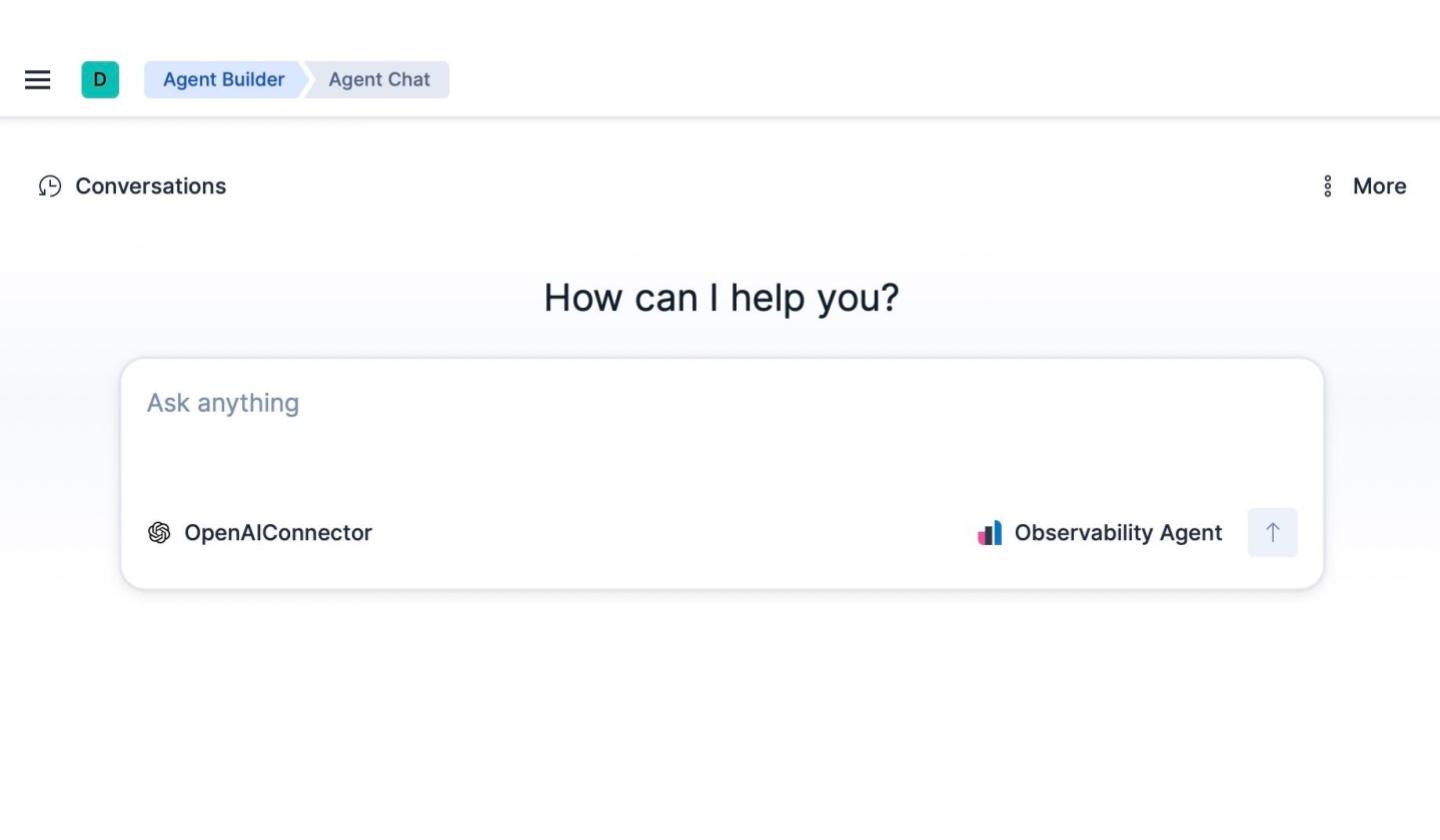
A single question through the converse API asks the built-in Elastic AI Agent to investigate logs-generic.otel-default, find which pod and version are returning HTTP 500, and propose one bounded action. It answers correctly, naming checkout-worker-1 on 2026.07.26.1 with a 43% error rate against zero errors on the two workers still on 2026.07.25.3.
Select the trace icon under any agent response to open the waterfall.
One question through the converse API produced 24 spans over 43.7 seconds. The structure is an invoke_agent root, a generate_title side branch, then alternating chat and execute_tool spans as the agent queries, reads the result, and picks the next query.
Three span families carry everything you will aggregate on.
| Span name prefix | What it represents | Key attributes |
|---|---|---|
invoke_agent | A conversation round (CHAIN) or an agent execution (AGENT) | elastic.inference.span.kind, gen_ai.agent.id |
chat | One model call | gen_ai.request.model, gen_ai.provider.name, gen_ai.usage.input_tokens, gen_ai.usage.output_tokens |
execute_tool | One tool invocation | gen_ai.tool.name, gen_ai.tool.call.id, status.code |
The token breakdown for that run:
| Model | Calls | Input tokens | Output tokens |
|---|---|---|---|
anthropic-claude-4.6-sonnet | 5 | 113,315 | 2,039 |
anthropic-claude-4.5-haiku | 5 | 47,211 | 651 |
Half the model calls went to the smaller model. That is fast model routing, which sends low-effort steps to a cheaper model, and the split is only visible in the trace.
The single agent investigation consumed roughly 160,000 input tokens in total. Each round replays the accumulated context, so cost scales with conversation length rather than with the length of the question.
How do you query agent tool calls with ES|QL?
Tool invocations are the part of agent behavior most worth watching, because that is where the agent touches your data. Every call is one execute_tool span, and the documented query aggregates them directly:
FROM traces-agent_builder.otel-*
| WHERE span.name LIKE "execute_tool *"
| STATS calls = COUNT(*),
        errors = COUNT(*) WHERE status.code == "Error",
        avg_ms = ROUND(AVG(duration) / 1000000.0, 1)
  BY tool = attributes.gen_ai.tool.name
| SORT calls DESC
Across that run the agent leaned on platform.core.execute_esql, with platform.core.generate_esql and load_skill behind it at two calls each. duration is in nanoseconds on the root of the document, which is why the query divides by a million for milliseconds.
Check the companion logs data stream as well. During a different run in the same session, the agent tried to call a tool that was not in its available set, and the attempt was recorded as an exception event in logs-agent_builder.otel-default, correlated to the trace by trace_id:
{
  "trace_id": "3f8b9722dbd371ac4b7ad75e4bed13b6",
  "event_name": "exception",
  "attributes": {
    "exception.type": "toolNotFoundError",
    "exception.message": "Tool \"platform.streams.query_documents\" called but was not available"
  }
}
A blocked tool attempt is audit-relevant, and it does not appear in the trace waterfall. Querying only the traces data stream will miss it.
For aggregate views there is a managed dashboard, installed per space from the same settings panel.
Over a fifteen-minute window covering these runs, it reported 903,914 input tokens, 11,734 output tokens, and 44 LLM requests, with 35 tool spans at a 100% success rate and 0.42 seconds average duration. The dashboard is managed and read-only, so duplicate it to change a panel, and Elastic can still ship improvements to the original.
What OpenTelemetry LLM traces do not capture by default
By default, a trace records structure and cost, not content. Six toggles under Advanced privacy settings control prompts, responses, tool call details, system prompts, real tool and agent names, and real conversation and workflow IDs, and all six are off.
By default, a trace records structure and cost, not content. Select any span in the waterfall and the detail panel says so directly: "No input/output data available for this span."
Identifiers are hashed rather than dropped. The run with the blocked tool call returned conversation be30fb53-d351-4fa1-b5e1-a569816f85d9 from the API, but its spans carry gen_ai.conversation.id: b1141340d0851a46. That lets you group every span belonging to one conversation and compare conversations against each other, without exposing an identifier that ties back to a user's session.
The consequence is that you cannot join traces to conversations on the conversation ID unless you enable real IDs, and you rarely need to. The converse API hands you the correlation key directly:
{
  "conversation_id": "be30fb53-d351-4fa1-b5e1-a569816f85d9",
  "trace_id": "3f8b9722dbd371ac4b7ad75e4bed13b6",
  "model_usage": {
    "llm_calls": 22,
    "input_tokens": 518251,
    "output_tokens": 6423,
    "model": "anthropic-claude-4.6-sonnet"
  }
}
Store that trace_id in your own decision record, and the join works without weakening the privacy defaults. Enable real IDs only when exact response-to-decision attribution is required, and restrict the trace index in the same change.
Auditing AI agent actions beyond the trace
The traces stop at what the agent did, so the records that show who authorised it have to come from somewhere else.
Whose privileges does an AI agent action run with?
Three identities are involved in an agentic pipeline, and each has its own boundary.
| Identity | Runs with | Determined by | How to scope |
|---|---|---|---|
| Agent Builder tools | The privileges of whoever is chatting | The current user, so two people can get different data from the same question | Roles, as described in Agent Builder permissions |
| Workflow steps | One stored API key shared by every elasticsearch.* and kibana.* step | The trigger: manual runs use the person who started them, scheduled runs use whoever last saved the workflow | Workflow authorization |
| Trace readers | Index-level access, all or nothing | A role grant on traces-agent_builder.otel-* | A role boundary on the trace index pattern |
One consequence of the stored key belongs in any review. Deactivating a user or changing their role does not refresh it, and the workflow keeps running with the privileges it captured until someone saves it again or toggles Enabled off and back on. Revoking an engineer's access does not, by itself, stop workflows that still run as them.
Scope the investigation role to reads only:
POST /_security/role/agent-builder-observability-investigator
{
  "cluster": ["monitor_inference"],
  "indices": [
    {
      "names": ["logs-*", "metrics-*", "traces-*"],
      "privileges": ["read", "view_index_metadata"]
    }
  ]
}
Reading the agent's own traces is a separate grant, needing read and view_index_metadata on traces-agent_builder.otel-*. Keep the two roles apart, because the people who investigate incidents and the people who audit the agent are not always the same people.
Recording who approved an agent action in Elasticsearch
Run the workflow, and it stops at the approval gate, where the reviewer sees the agent's structured output rendered into the request rather than a bare confirmation prompt.
The execution record is detailed. It captures resumedAt, resumedBy, the full resumeInput payload, per-step token usage, and a deep link back to itself.
That execution history is an operational view, not an audit store. The underlying .workflows-events data stream is reserved for system operations and rejects user queries outright, so you cannot run ES|QL across a quarter of decisions, and execution history is subject to retention rather than to your compliance policy.
Write the decision to an index you control:
- name: review
  type: waitForInput
  with:
    message: |
      ## Approve the proposed checkout remediation?

      The evidence query matched {{ steps.collect_evidence.output.hits.total.value }} error events in the last hour.

      Agent classification: {{ steps.investigate.output.structured_output.incident_class }}
      Affected pod: {{ steps.investigate.output.structured_output.affected_pod }}
      Proposed action: {{ steps.investigate.output.structured_output.recommended_action }}
    schema:
      type: object
      properties:
        decision:
          type: string
          enum: ["approve", "decline"]
        reason:
          type: string
          enum: ["supported-by-evidence", "insufficient-evidence", "wrong-target", "unsafe-action"]
        notes:
          type: string
      required: ["decision", "reason"]

- name: record_decision
  type: elasticsearch.index
  with:
    index: "agent-action-audit"
    document:
      "@timestamp": "{{ now | date: '%Y-%m-%dT%H:%M:%S.%LZ' }}"
      "event.action": "agent_recommendation_reviewed"
      "incident.id": "{{ consts.incident_id }}"
      "agent.conversation_id": "{{ steps.investigate.output.conversation_id }}"
      "agent.incident_class": "{{ steps.investigate.output.structured_output.incident_class }}"
      "agent.affected_pod": "{{ steps.investigate.output.structured_output.affected_pod }}"
      "agent.recommended_action": "{{ steps.investigate.output.structured_output.recommended_action }}"
      "agent.evidence_count": "{{ steps.collect_evidence.output.hits.total.value }}"
      "review.decision": "{{ steps.review.output.response.decision }}"
      "review.reason": "{{ steps.review.output.response.reason }}"
      "review.notes": "{{ steps.review.output.response.notes }}"
      "review.responded_by": "{{ steps.review.output.respondedBy }}"
      "workflow.execution_id": "{{ execution.id }}"
      "workflow.executed_by": "{{ execution.executedBy }}"
      "workflow.execution_url": "{{ execution.url }}"
Two details in the workflow snippet above differ from the reference page.
The reviewer payload is nested one level deeper. The docs describe steps.<name>.output.<field>, but the running build returns the submitted values under response, alongside a respondedBy field:
{
  "response": { "decision": "approve", "reason": "supported-by-evidence" },
  "respondedBy": "1506416774"
}
execution.executedBy records who started the run, and respondedBy records who approved the action, which in a human-in-the-loop pipeline are usually different people.
The second detail is the timestamp. {{ now }} renders a JavaScript date string like Sun Jul 26 2026 07:37:11 GMT+0000 (Coordinated Universal Time), which Elasticsearch rejects with failed to parse date field, and execution.startedAt has the same problem. The Liquid date filter fixes it.
The workflow editor also flags steps.review.output.* as an invalid variable before the first run, because the reviewer payload shape is only known once someone responds. The warning clears after the step has real output, and the templates resolve correctly at runtime.
Making the audit data stream append-only
An audit trail the agent's own pipeline can rewrite is not an audit trail. Elasticsearch provides two independent controls, and they compose.
First, write to a data stream rather than an index, because data streams accept appends and nothing else:
PUT _index_template/agent-action-audit
{
  "index_patterns": ["agent-action-audit"],
  "data_stream": {},
  "priority": 500,
  "template": {
    "mappings": {
      "properties": {
        "@timestamp":            { "type": "date" },
        "event.action":          { "type": "keyword" },
        "incident.id":           { "type": "keyword" },
        "agent.conversation_id": { "type": "keyword" },
        "agent.evidence_count":  { "type": "long" },
        "agent.recommended_action": { "type": "keyword" },
        "review.decision":       { "type": "keyword" },
        "review.reason":         { "type": "keyword" },
        "review.responded_by":   { "type": "keyword" },
        "workflow.execution_id": { "type": "keyword" }
      }
    }
  }
}
Second, give the writer create_doc and nothing else, so it can add records but cannot reach for the by-query escape hatches:
PUT _security/role/agent-action-audit-writer
{
  "indices": [
    { "names": ["agent-action-audit"], "privileges": ["create_doc", "auto_configure"] }
  ]
}
Tested against the running cluster, that pair behaves the way an audit store should:
| Attempt as the audit writer | Result |
|---|---|
| Append a decision record | 201 Created |
| Overwrite a record by ID | 400, only op_type: create is allowed in data streams |
_update_by_query to change a decision | 403, action unauthorized |
_delete_by_query to erase history | 403, action unauthorized |
_search to read the trail back | 403, action unauthorized |
The write-only behaviour in the last row is deliberate. The workflow that writes decisions has no reason to read them, so auditors get a separate read role and the writer stays write-only.
The two controls fail differently, which matters. The 400 comes from the data stream itself and applies to everyone, including a superuser. The 403 rows come from the role, and a superuser could still run them, which is why tamper-resistant retention means shipping records off the cluster the agent's operators administer.
For cluster-level activity, enable Elasticsearch and Kibana security audit logging and forward the logs to a monitoring deployment. On 9.5 xpack.security.audit.enabled became a dynamic cluster setting, so Elasticsearch no longer needs a restart to turn it on, though on orchestrated deployments the logs still have to be shipped somewhere readable.
Query the decision trail with ES|QL
Two runs of the workflow, one approved and one declined, produce two rows you can query alongside everything else in Elastic.
FROM agent-action-audit
| KEEP @timestamp, agent.incident_class, agent.affected_pod, agent.recommended_action,
       agent.evidence_count, review.decision, review.reason, review.responded_by,
       workflow.execution_id
| SORT @timestamp DESC
Both runs saw the same 90 error events and proposed restart-checkout-worker on checkout-worker-1. The first review approved it as supported-by-evidence, and the second declined it as wrong-target, on the argument that restarting the pod hides a pricing-feed problem rather than fixing it.
Because both decisions are structured fields, disagreement between reviews is queryable. You can count rejections per incident class and group them by reason: insufficient-evidence sends you back to the investigation path, and unsafe-action sends you to the workflow and its permission boundary.
AI agent observability limits to design around
Four behaviors are worth designing around, and each is cheaper to handle before the workflows are written.
- Trace access is index-level, not per user. A space with sensitive conversations needs a role boundary on
traces-agent_builder.otel-*rather than a UI setting. - The managed dashboard is not installed automatically in a new space. Add it to your space provisioning checklist.
- The workflow execution carries its own APM
traceId. It is not the same trace as the Agent Builder spans itsai.agentstep produced, so correlate through the conversation ID or thetrace_idreturned by the agent rather than expecting one trace to span both. - The
waitForInputoutput shape differs from the reference page. The submitted values arrive underresponse, alongsiderespondedBy, as covered above.
None of these blocks the pattern.
Where to start with AI agent observability
Turn trace collection on, install the dashboard in the space your agents run in, and open the waterfall for one real conversation. It shows the tool sequence, the model split, and the latency distribution that the answer text does not.
Then pick the single incident class where you already trust the runbook, and add one elasticsearch.index step after its approval gate. An append-only decision record costs one workflow step and answers the three questions a review needs: who approved this, on what evidence, and what happened next.
For the details, see Collect Agent Builder traces, the traces overview dashboard, Agent Builder permissions, workflow authorization, and the waitForInput reference.
Frequently Asked Questions
Is Agent Builder trace collection on by default?
Yes, in 9.5 and Serverless. It writes to traces-agent_builder.otel-<space-id> with no collector to configure.
Do traces include prompts and model responses?
No. Six privacy toggles control prompts, responses, tool call details, system prompts, real tool and agent names, and real conversation and workflow IDs, and all six are off by default.
Can I restrict who reads agent traces?
Only at the index level, through a role on traces-agent_builder.otel-*. Access is not scoped per user or per conversation.
Does the traces dashboard install automatically?
No. Install it once per Kibana space from the Agent Builder Traces section of GenAI Settings.
Why write a separate decision index instead of using workflow execution history?
.workflows-events is reserved for system operations and rejects user queries, and execution history follows its own retention rather than your compliance policy.
Related Content