
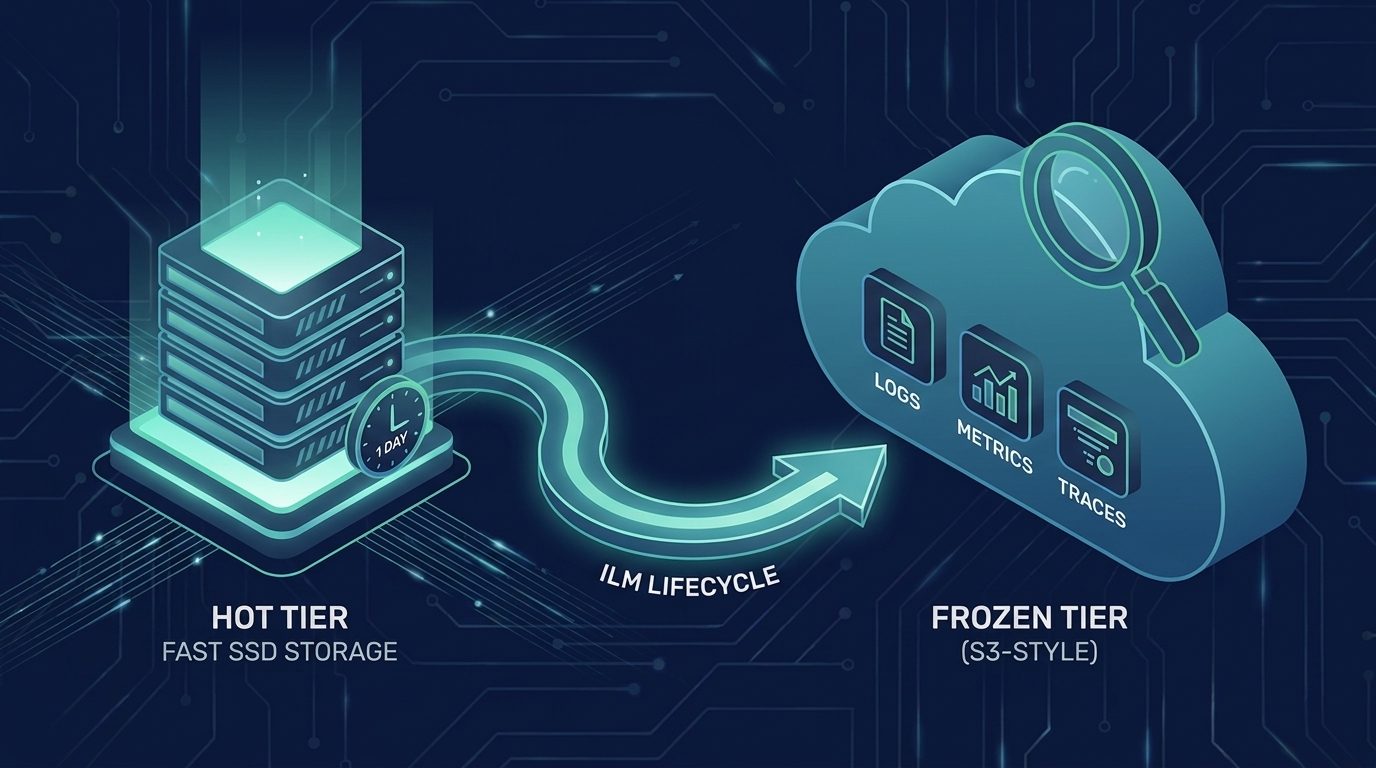
Cut log storage costs with two Elasticsearch data tiers instead of four
Elastic benchmarked one day of logs on SSD with everything older moved to frozen searchable snapshots, and it came out 16x cheaper than keeping all of it hot. The ILM policy and the cost model are both in the post.
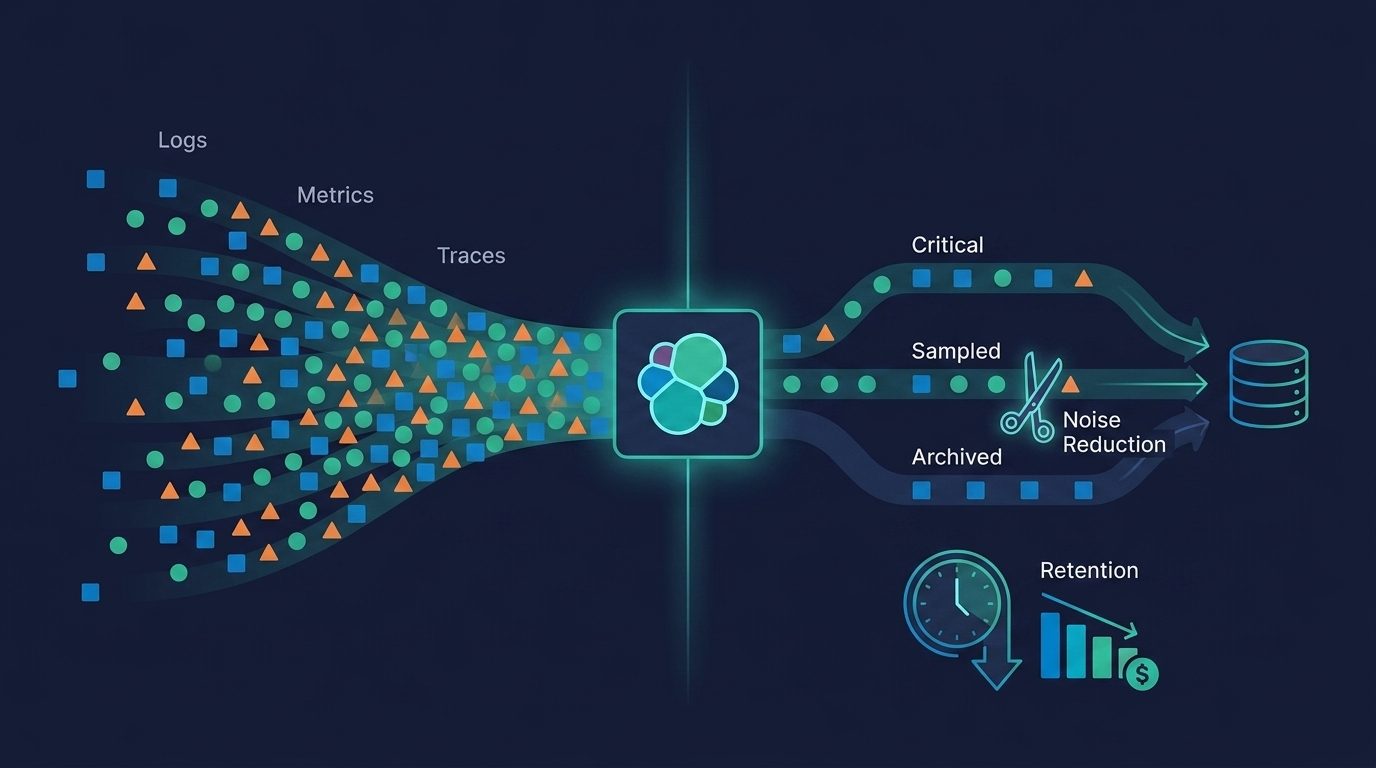
Not every log deserves 90 days: per-stream retention in Elastic Streams
AI Partitioning reads your data and proposes child streams. Retention, drops and downsampling then become per-stream settings, so the noisy ones expire on their own schedule.

Migrate Datadog Kubernetes dashboards to Elastic Observability in under an hour
See how the migration CLI translates a real Datadog Kubernetes dashboard into validated Kibana panels and uploads it to your cluster in under an hour, no manual widget rebuilds required.
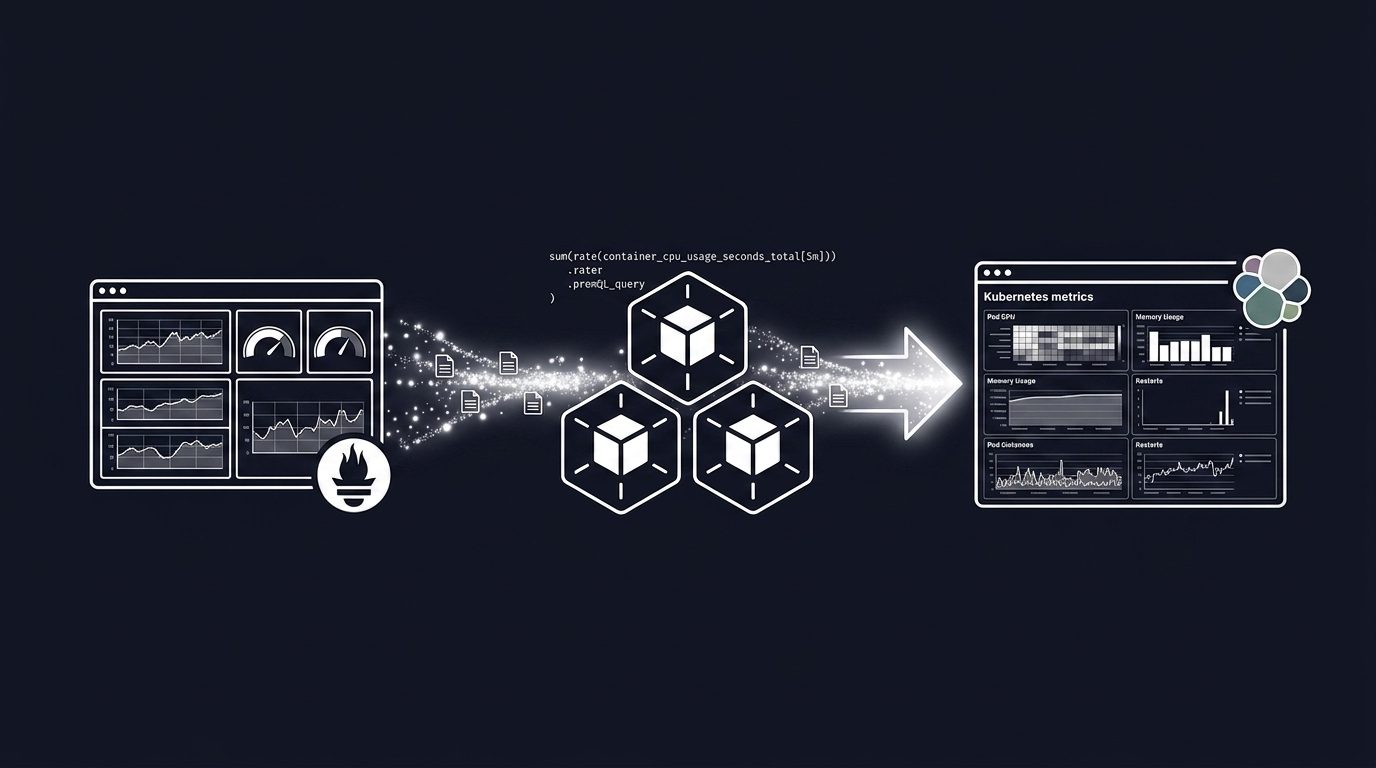
Migrate your Grafana Kubernetes dashboard to Elastic Observability: same PromQL, 30x faster queries
Take a real Grafana Kubernetes dashboard covering pod CPU, memory, node pressure, and restart counts, then migrate it into Elastic Observability with native PromQL in under an hour.