Category: APM
Articles tagged APM
Self-Driving Observability: From Stacktraces to Profiling-Derived Metrics
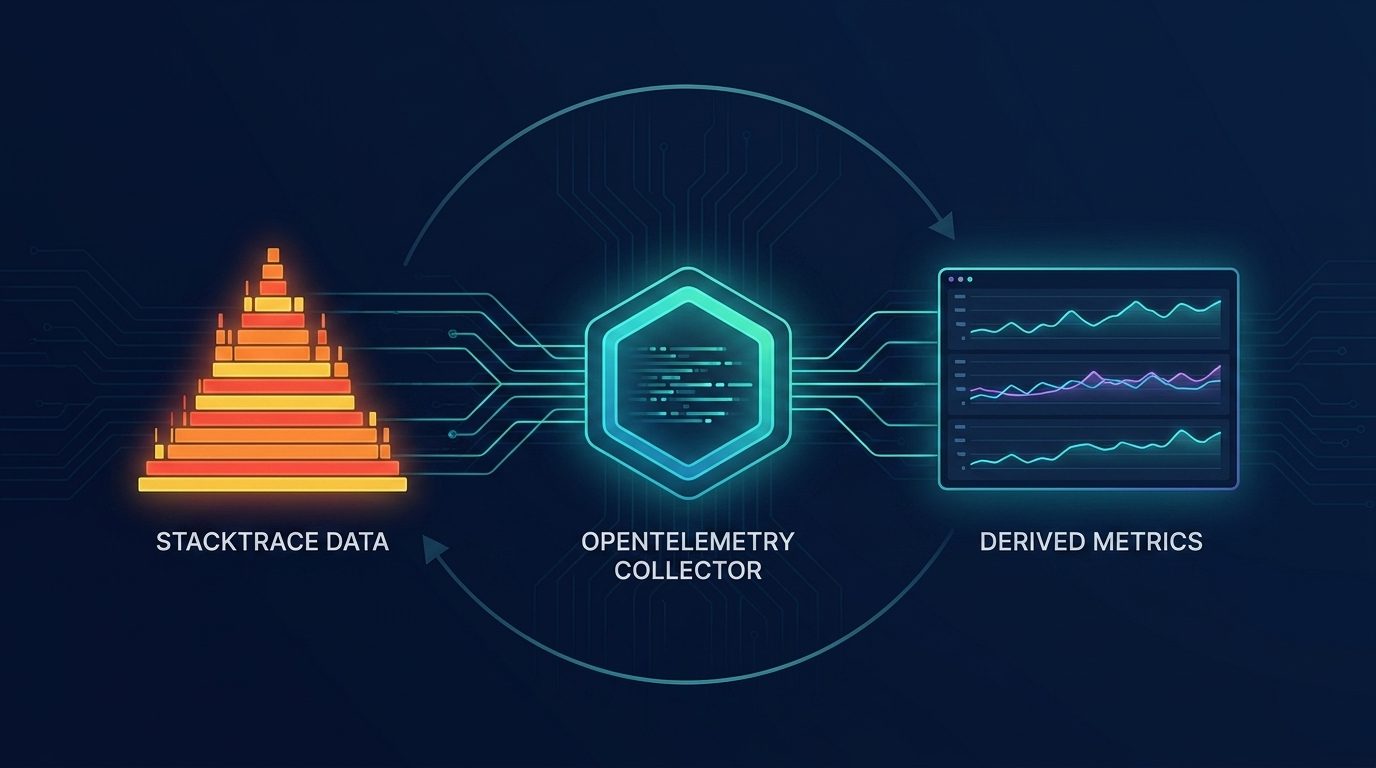
Profiling-derived metrics turn raw stacktraces into time-series KPIs, unlock continuous profiling for every user and lay the foundation for an observability system that detects, investigates, and acts on its own.
How to trace MCP server tool calls with OpenTelemetry and Elastic APM
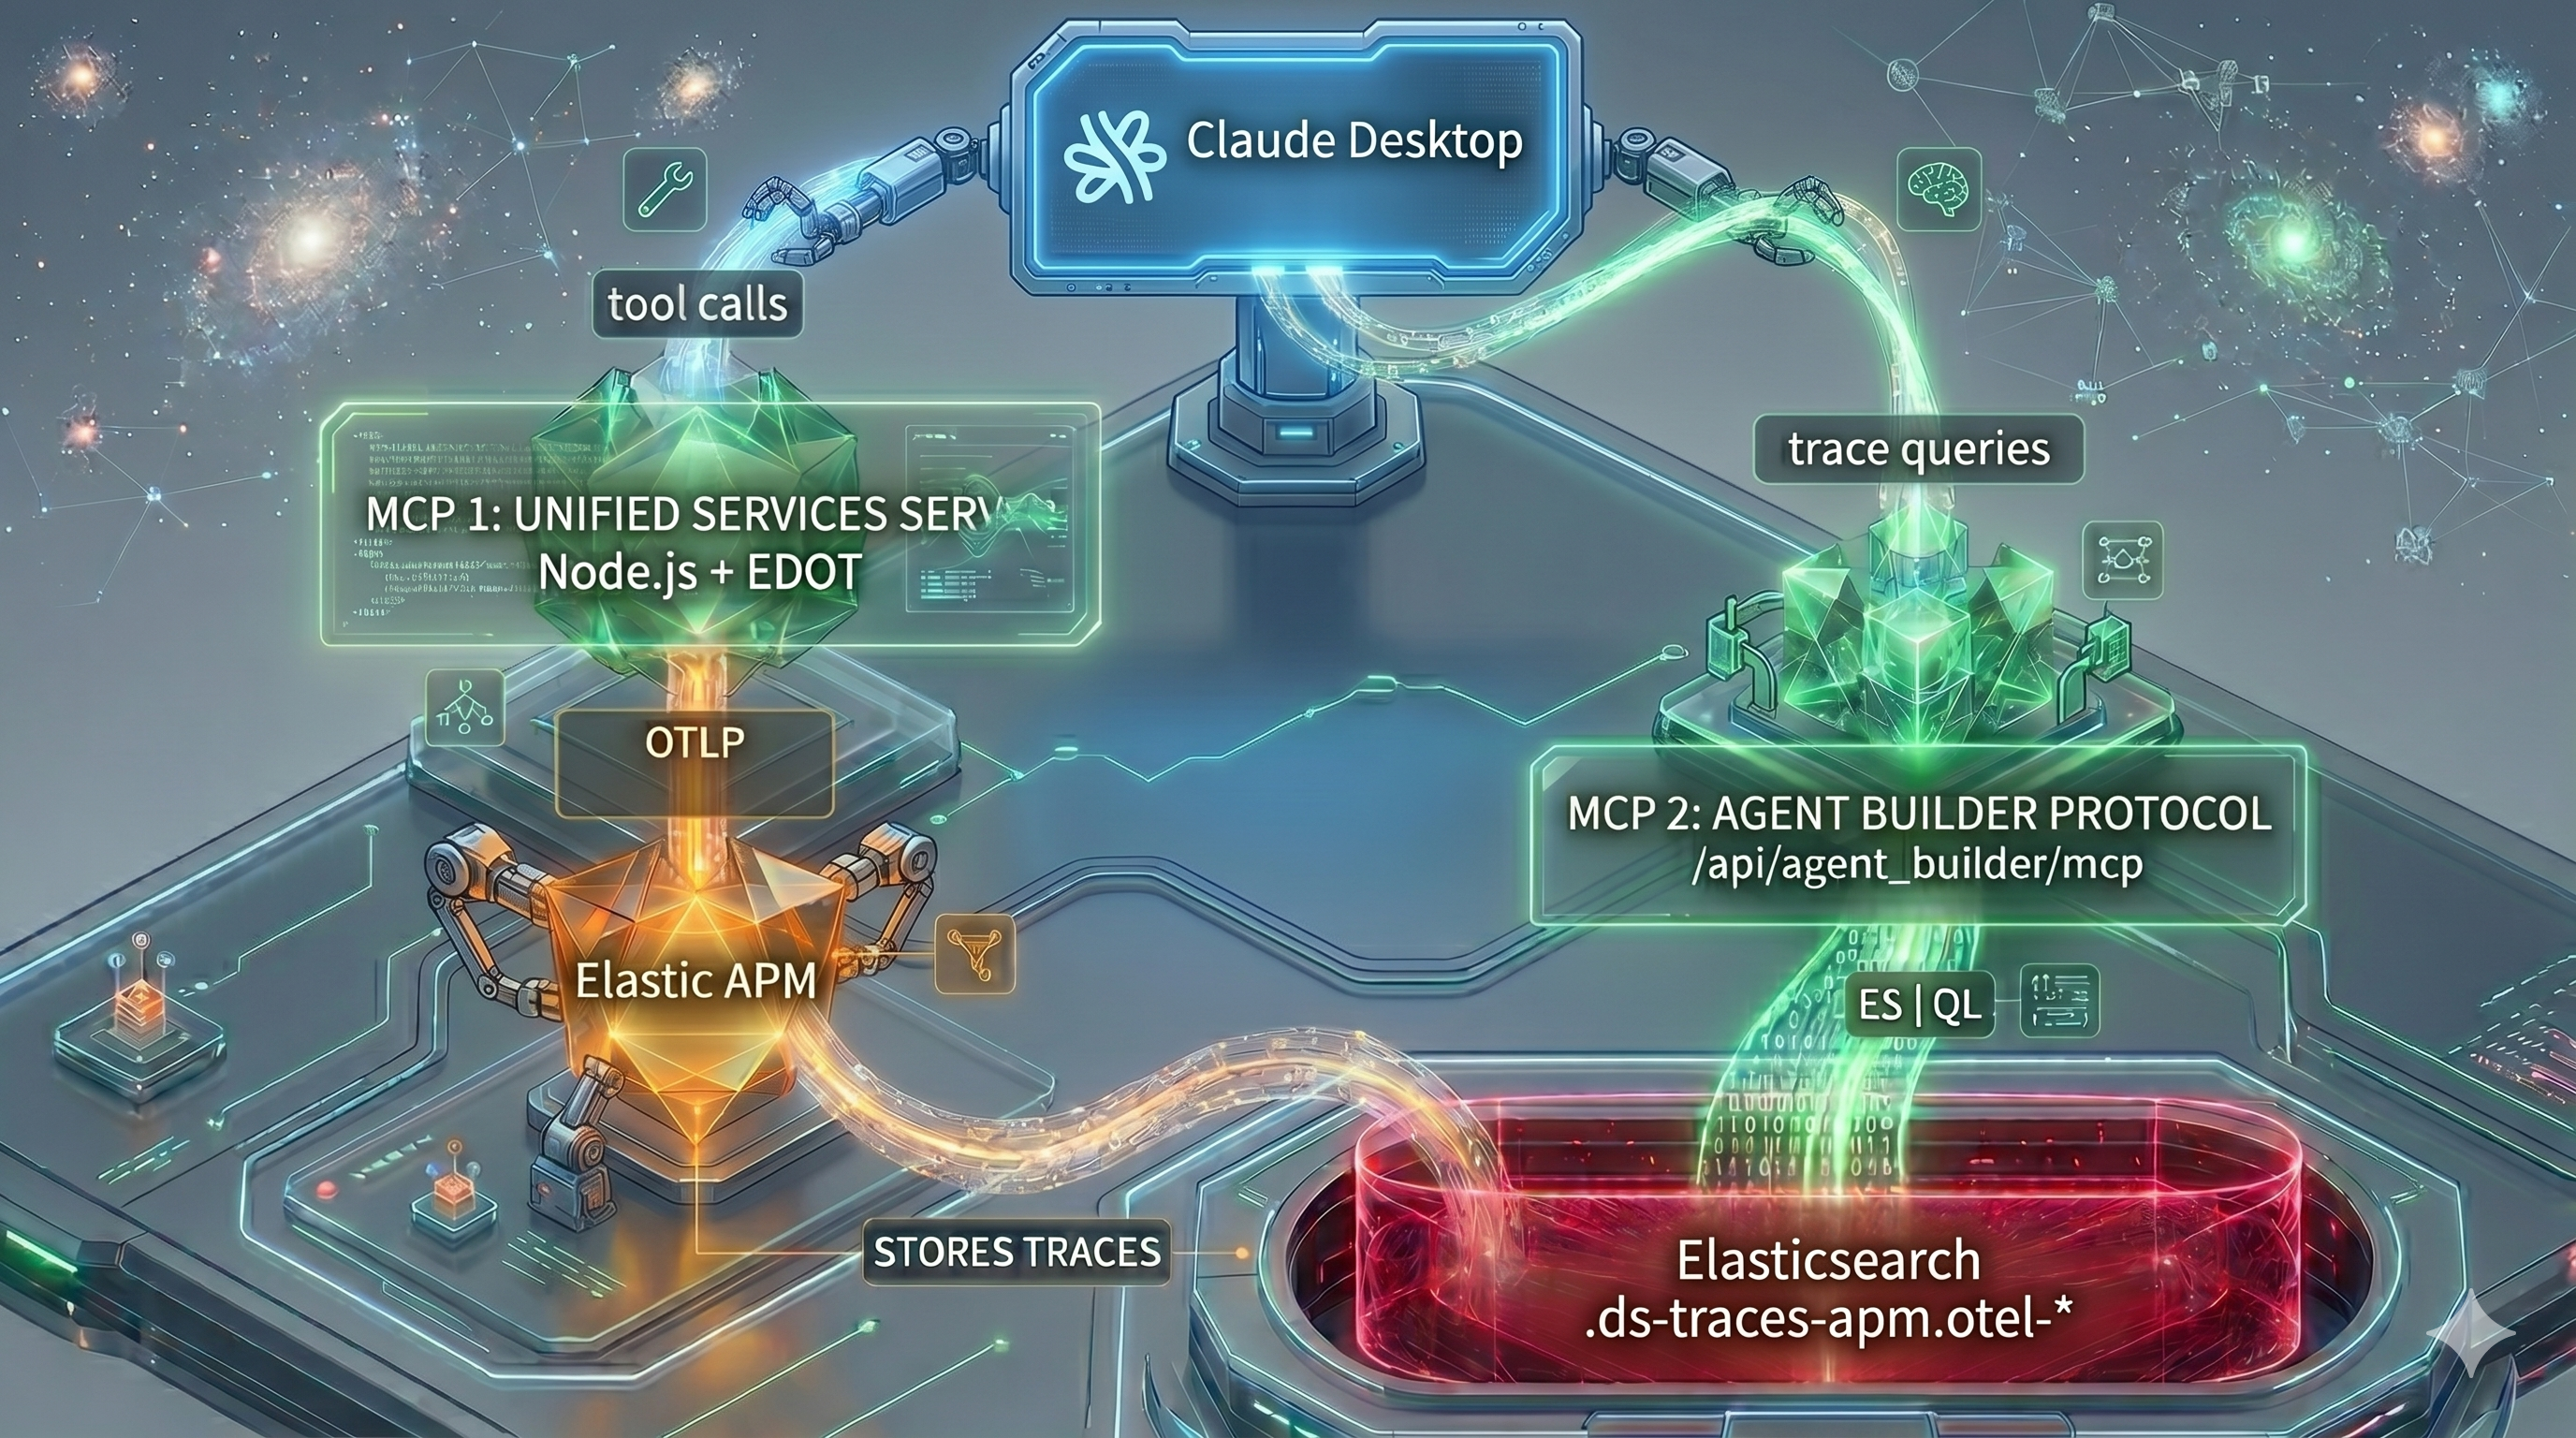
Add OpenTelemetry tracing to an MCP server, visualize tool call performance in Elastic APM, and query the trace data from Claude Desktop using the Agent Builder MCP.

Connecting Cursor to Production Logs via the Elastic MCP Server
Learn how to connect Cursor to your Elastic APM data using the Elastic Agent Builder MCP server, so you can debug production errors and make UI decisions backed by real usage data without leaving your editor.

OpenTelemetry browser instrumentation using EDOT Browser & Kibana
A step-by-step guide on OpenTelemetry browser instrumentation. Learn how to add EDOT Browser to a web app, export browser telemetry via OTLP, and verify traces, spans, and service maps in Kibana.
ML and AI Ops Observability with OpenTelemetry and Elastic
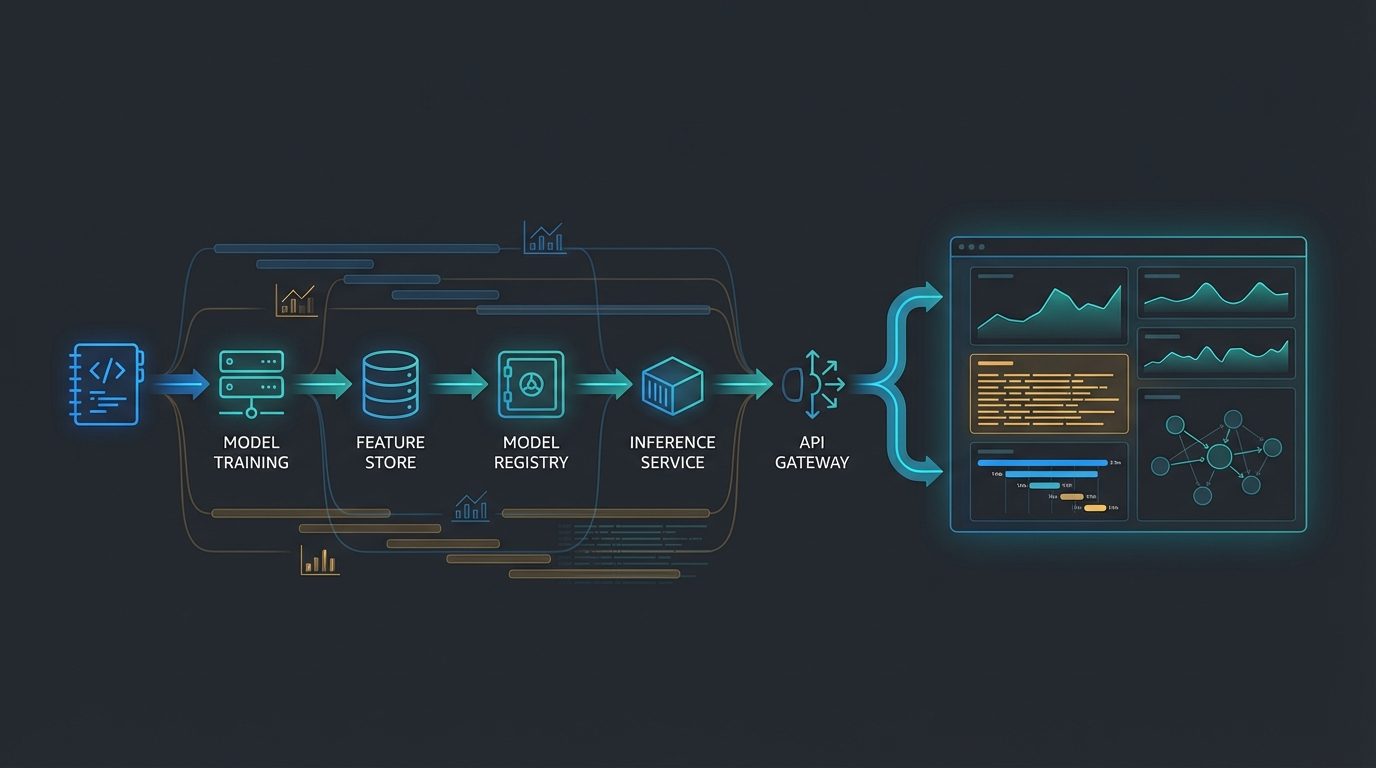
Learn how to instrument ML and AI pipelines with OpenTelemetry and Elastic to correlate traces, logs, and metrics from notebooks to production inference services.
OpenTelemetry Profiles Signal Enters Alpha: Elastic’s Continuous Commitment to Profiling
OpenTelemetry Profiles has officially reached Alpha, entrenching profiling as the fourth observability signal. Elastic's core contribution of its eBPF profiling agent, continued OpenTelemetry Profiles signal work and commitment to a vendor-agnostic ecosystem are driving this industry-wide standard forward.
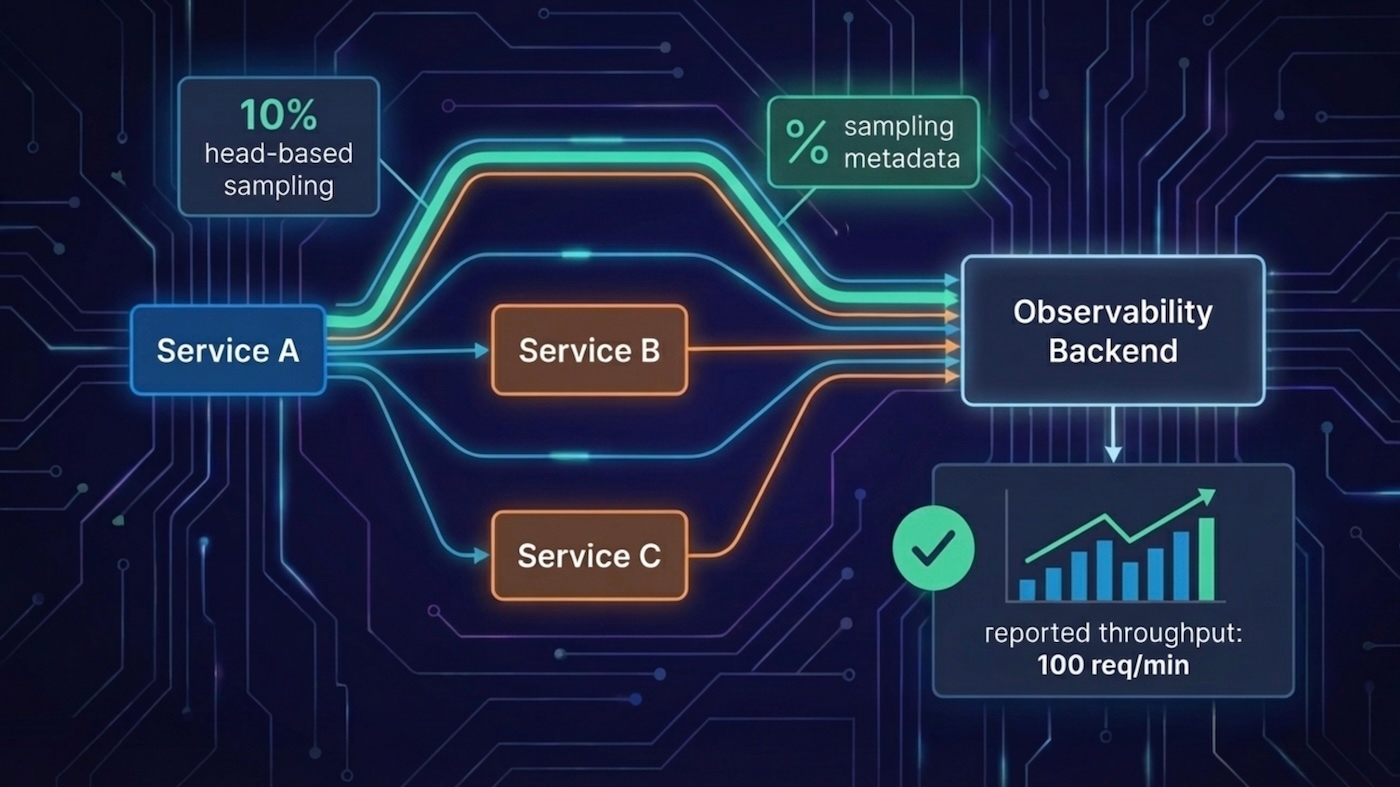
How we fixed head-based sampling in OpenTelemetry
Head-based sampling can break throughput charts without sampling metadata. Learn how OpenTelemetry tracestate probability fields fixed this in Java, JS, and Python.

Bridging the Gap: End-to-End Observability from Cloud Native to Mainframe
Achieving end-to-end observability in hybrid enterprise environments, where modern cloud-native applications interact with critical, yet often opaque, IBM mainframe systems is a challenge. By utilizing IBM Z Observability Connect, which enables OTel output, with Elastic Observability is a solution, transforming your mainframe black box into a fully observable component in your deployment
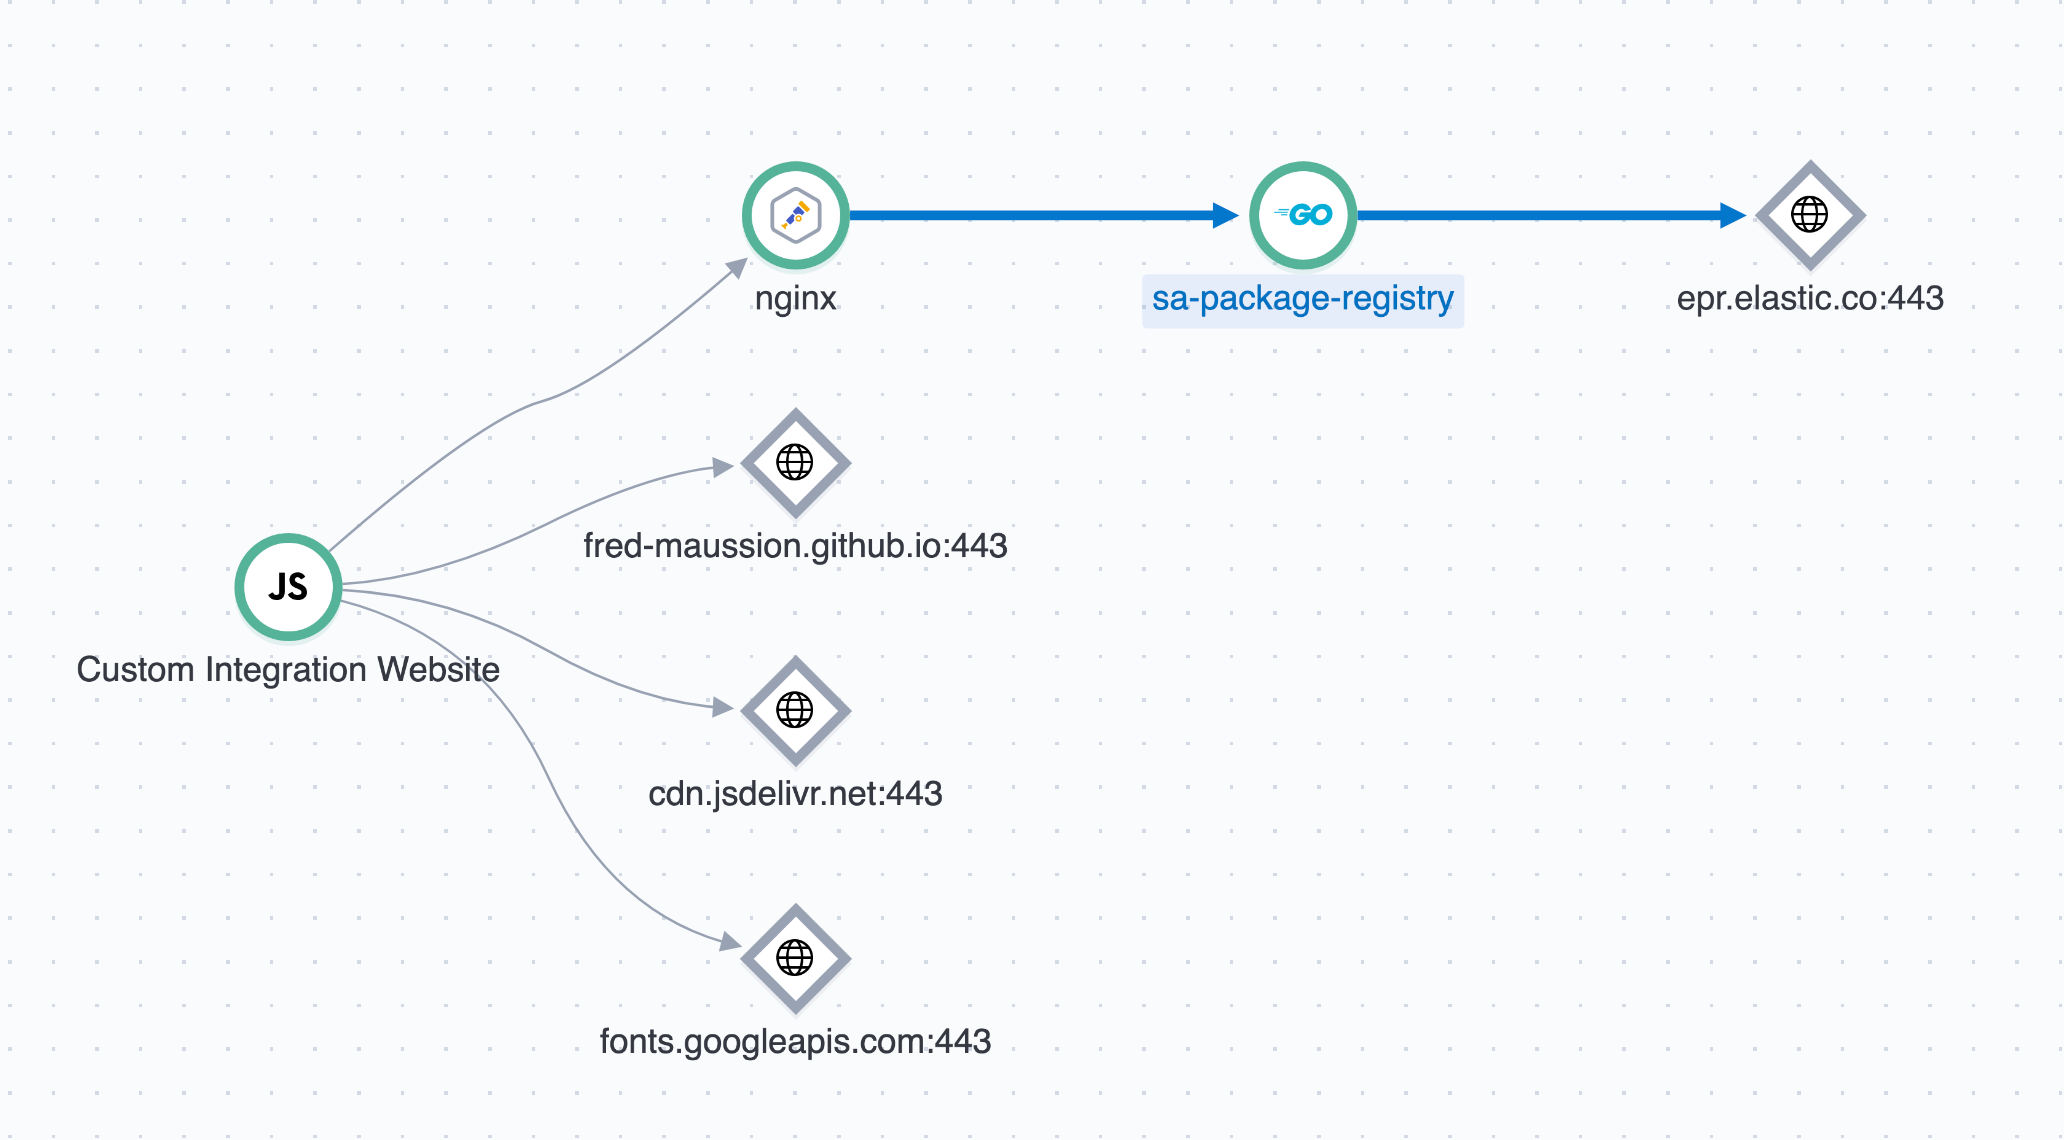
A Practical Guide to end-to-end distributed tracing for Nginx with OpenTelemetry in Elastic
Instrument Nginx with the OpenTelemetry tracing module and export spans to Elastic Observability's APM for full end-to-end distributed tracing.

Find answers quickly, correlate OpenTelemetry traces with existing ECS logs in Elastic Observability
In this blog we will discuss how EDOT enables you to collect existing ECS logs while ensuring a seamless and transparent move to OTel semantic conventions. The key benefit is that applications can continue sending logs as they do today, which minimizes the effort and impact on application developers.
EDOT SDK central configuration using OpAmp in Elastic Observability
Learn how to configure the Elastic Distributions of OpenTelemetry (EDOT) SDKs centrally via the EDOT Collector using OpAmp in Elastic Observability at scale.