
Composing OpenTelemetry Reference Architectures
A conceptual framework for reasoning about OpenTelemetry Collection architectures — edge, processing, and resilience layers that compose into the right pipeline for your environment.

AI agent observability and monitoring with OTel, OpenLit & Elastic
Learn how to monitor AI web agents to identify performance bottlenecks, token waste, and hallucinations using
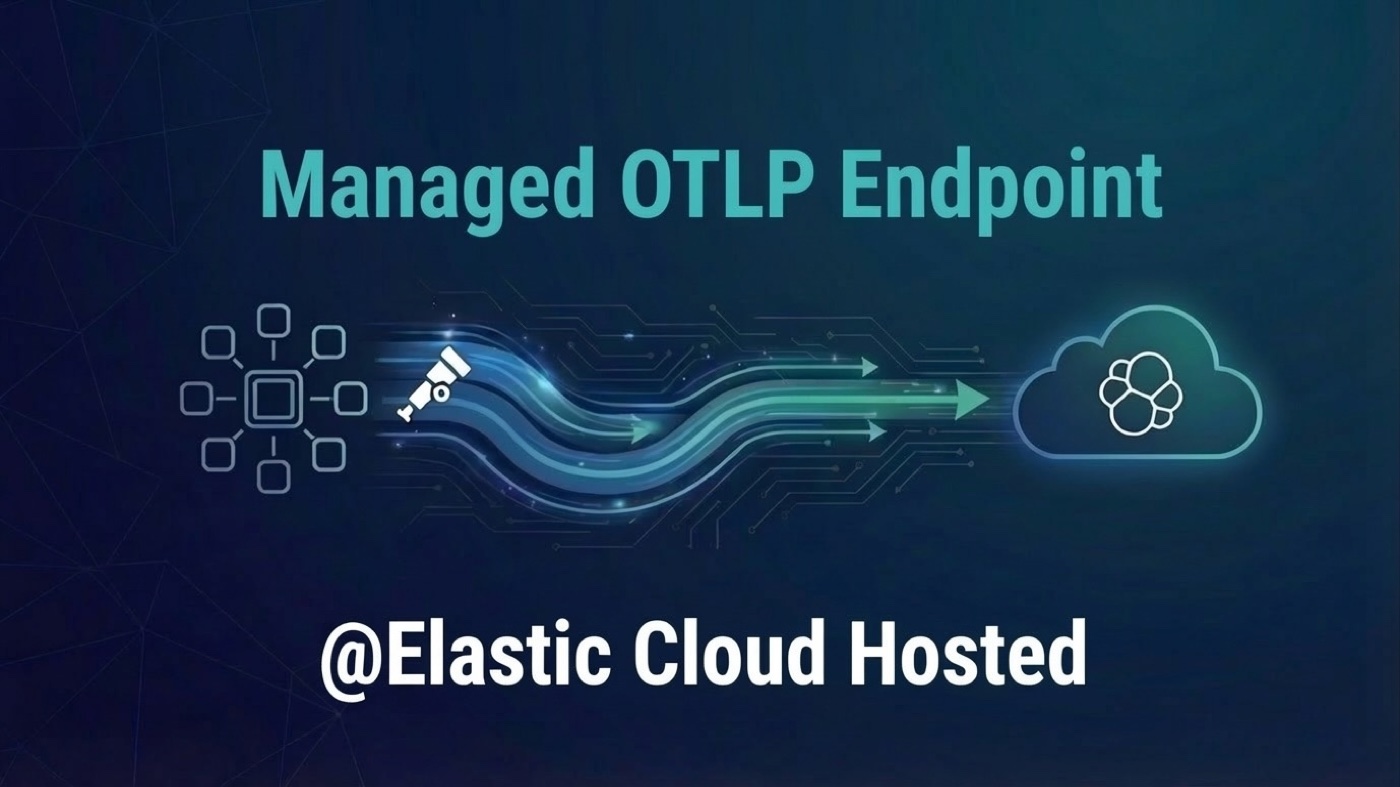
Now GA: Managed OTLP Endpoint on Elastic Cloud Hosted
The Elastic Managed OTLP Endpoint is now generally available on Elastic Cloud Hosted, bringing managed Kafka-backed resilience and native OTLP ingestion to any OpenTelemetry shipper.
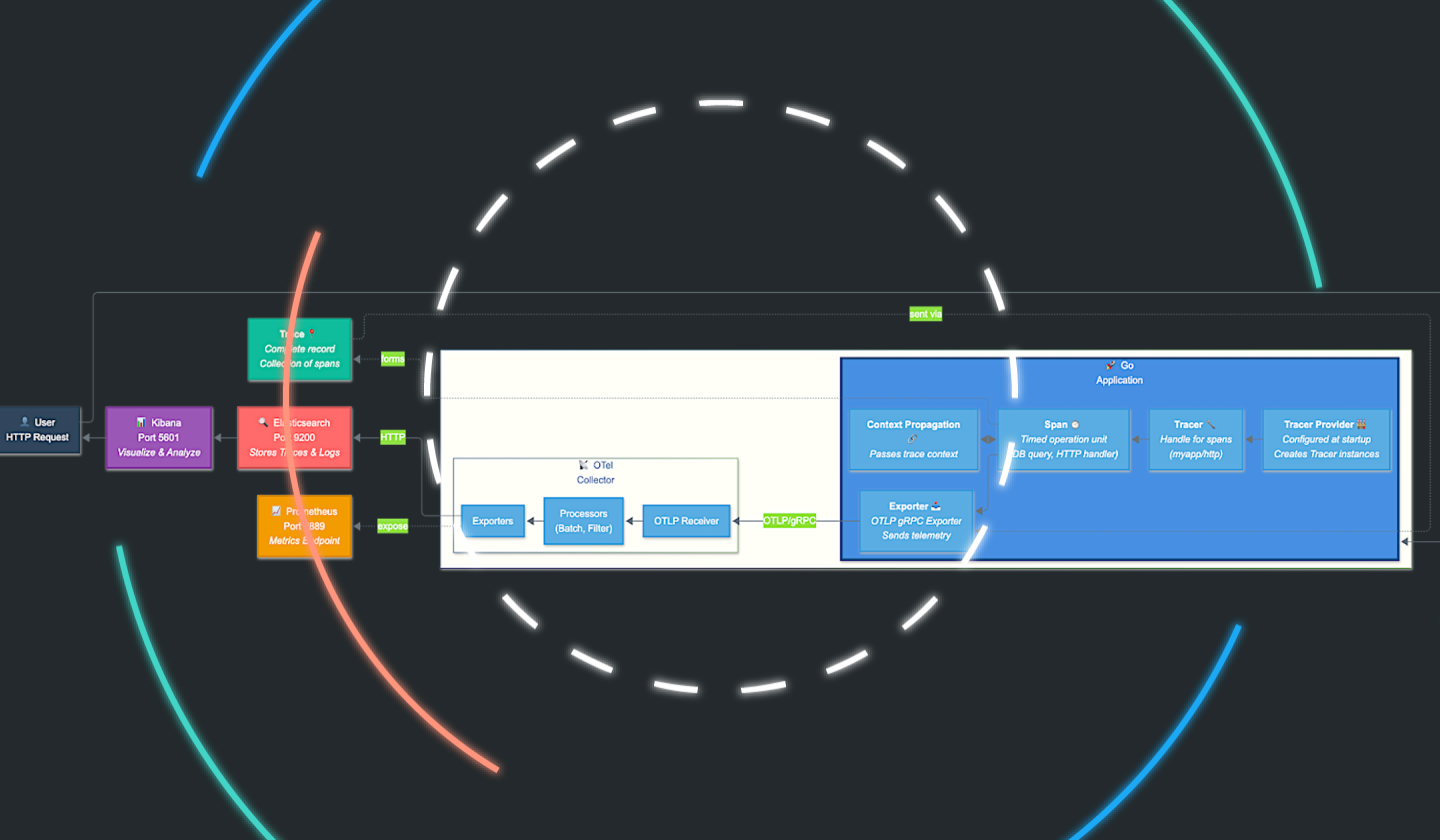
Developer's Guide to Easy Ops: Demystifying OpenTelemetry's Magic
A Go-based Developer's 101 Guide to Easy Ops with OpenTelemetry and Elastic Observability.
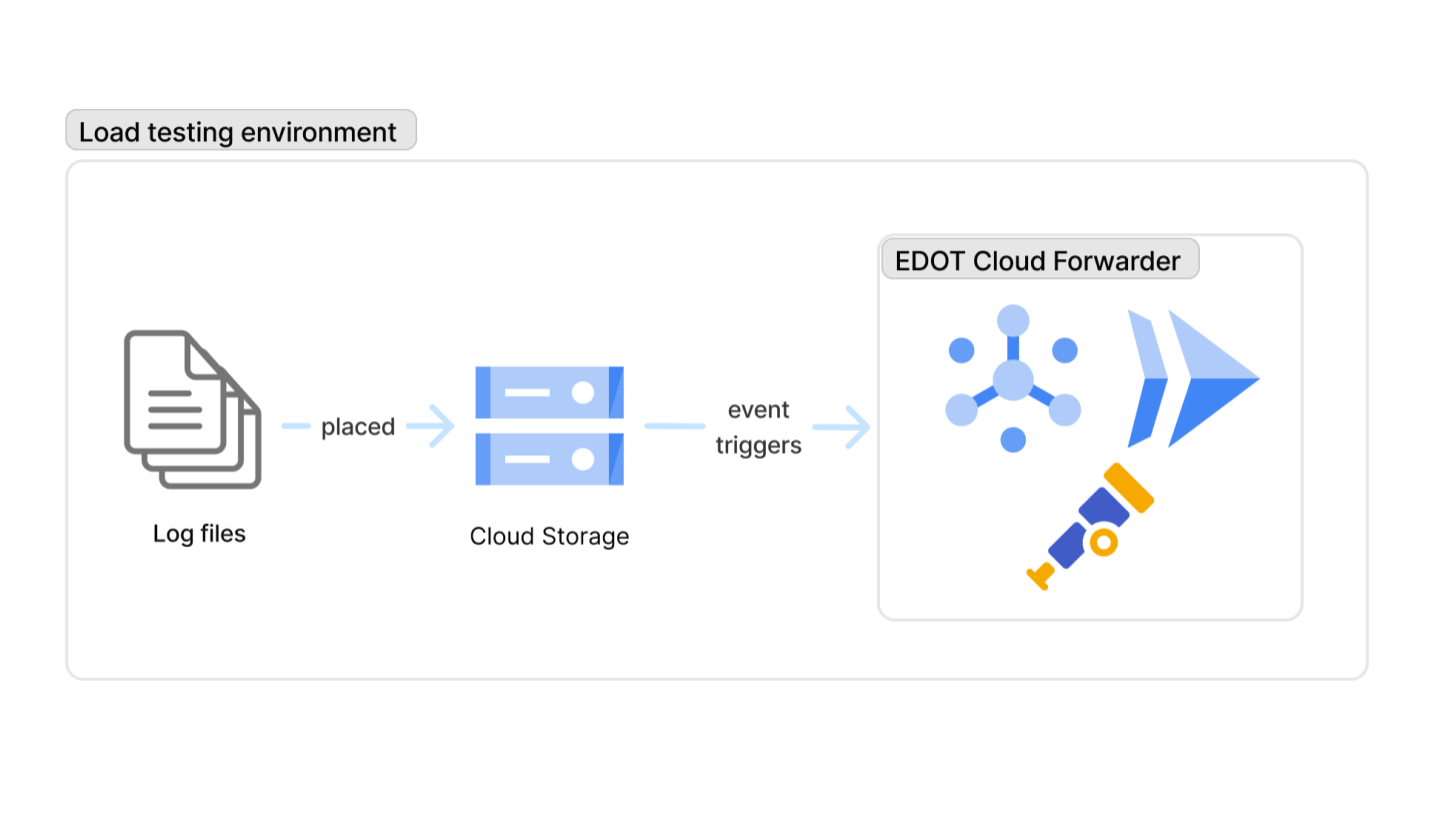
Scale testing OpenTelemetry log ingestion on GCP with EDOT Cloud Forwarder
Learn how we load tested the EDOT Cloud Forwarder for GCP on Google Cloud Run and identified practical capacity limits per instance. We show how runtime tuning improves stability and translate the results into concrete configuration and scaling guidance.

Bridging the Gap: End-to-End Observability from Cloud Native to Mainframe
Achieving end-to-end observability in hybrid enterprise environments, where modern cloud-native applications interact with critical, yet often opaque, IBM mainframe systems is a challenge. By utilizing IBM Z Observability Connect, which enables OTel output, with Elastic Observability is a solution, transforming your mainframe black box into a fully observable component in your deployment

A train ride away from a million events per second with EDOT Cloud Forwarder
EDOT Cloud Forwarder for AWS from Elastic Observability is now Generally Available. Deploying EDOT Cloud Forwarder and reliably handling one million events per second with zero intervention, zero data loss, and zero idle cost.
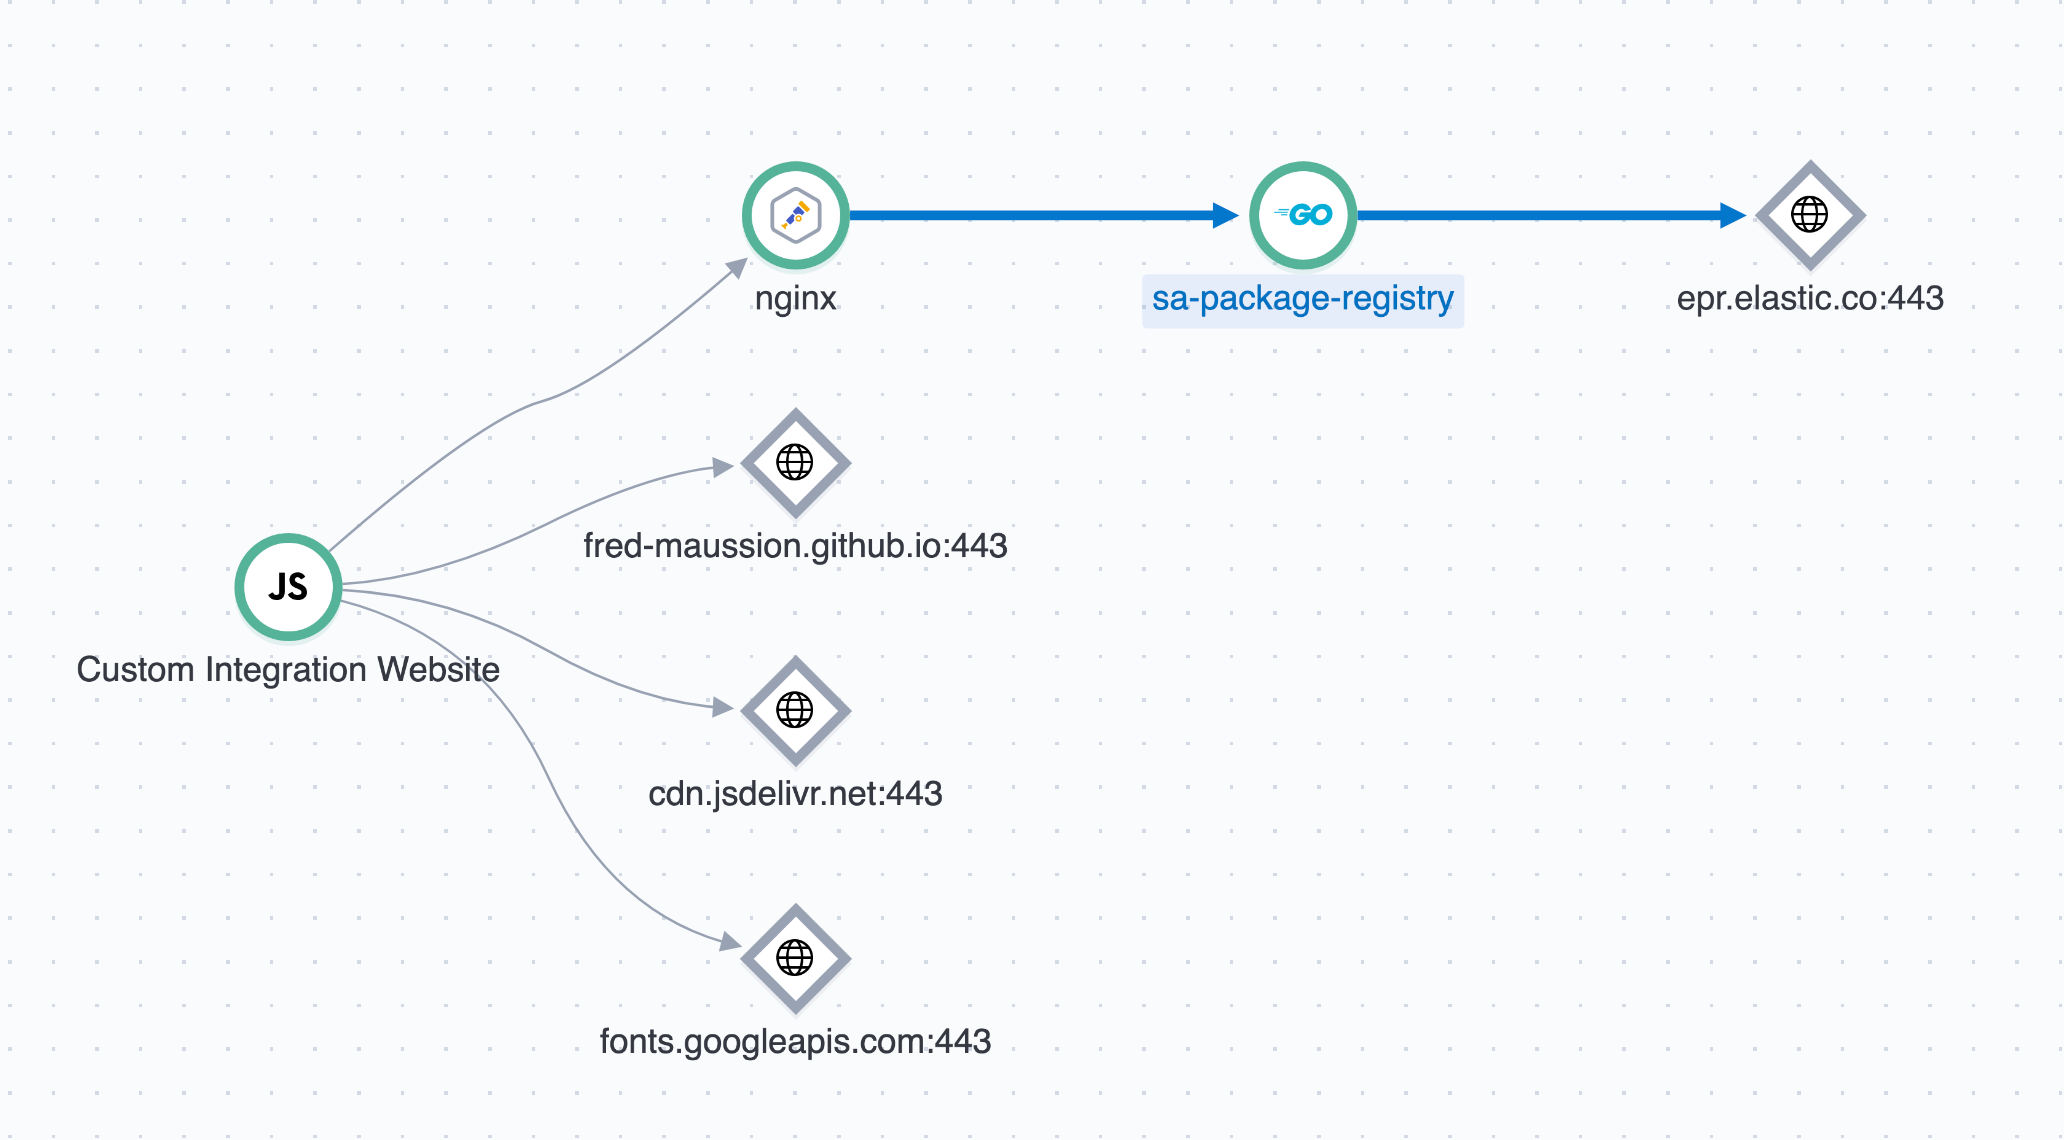
A Practical Guide to end-to-end distributed tracing for Nginx with OpenTelemetry in Elastic
Instrument Nginx with the OpenTelemetry tracing module and export spans to Elastic Observability's APM for full end-to-end distributed tracing.
Accelerate Otel Adoption with Elastic Agent Hybrid Ingestion
Elastic Agent 9.2 brings hybrid ingestion to Elastic Observability, unifying native integrations and OpenTelemetry receivers to simplify large-scale OTel adoption without disruption.

Troubleshooting your Agents and Amazon Bedrock AgentCore with Elastic Observability
Discover how to achieve end-to-end observability for Amazon Bedrock AgentCore: from tracking service health and token costs to debugging complex reasoning loops with distributed tracing.

AI-driven incident response with logs: A technical deep dive in Elastic Observability
How Elastic combines ML anomaly detection, ES|QL, and the AI Assistant to accelerate incident response using logs.

Elastic’s Managed OTLP Endpoint: Simpler, Scalable OpenTelemetry for SREs
Streamline OpenTelemetry data ingestion with Elastic Observability's new managed OTLP endpoint available on Elastic Cloud Serverless. Get native OTel storage and Elastic-grade scaling for logs, metrics, and traces, simplifying observability for SREs.