
3 models for logging with OpenTelemetry and Elastic
Because OpenTelemetry increases usage of tracing and metrics with developers, logging continues to provide flexible, application-specific, and event-driven data. Explore OpenTelemetry logging and how it provides guidance on the available approaches.

Pruning incoming log volumes with Elastic
To drop or not to drop (events) is the question, not only in deciding what events and fields to remove from your logs but also in the various tools used. Learn about using Beats, Logstash, Elastic Agent, Ingest Pipelines, and OTel Collectors.

How to remove PII from your Elastic data in 3 easy steps
Personally Identifiable Information compliance is an ever increasing challenge for any organization. With Elastic's intuitive ML interface and parsing capabilities, sensitive data may be easily redacted from unstructured data with ease.

Simplifying log data management: Harness the power of flexible routing with Elastic
The reroute processor, available as of Elasticsearch 8.8, allows customizable rules for routing documents, such as logs, into data streams for better control of processing, retention, and permissions with examples that you can try on your own.

Gaining new perspectives beyond logging: An introduction to application performance monitoring
Change is on the horizon for the world of logging. In this post, we’ll outline a recommended journey for moving from just logging to a fully integrated solution with logs, traces, and APM.
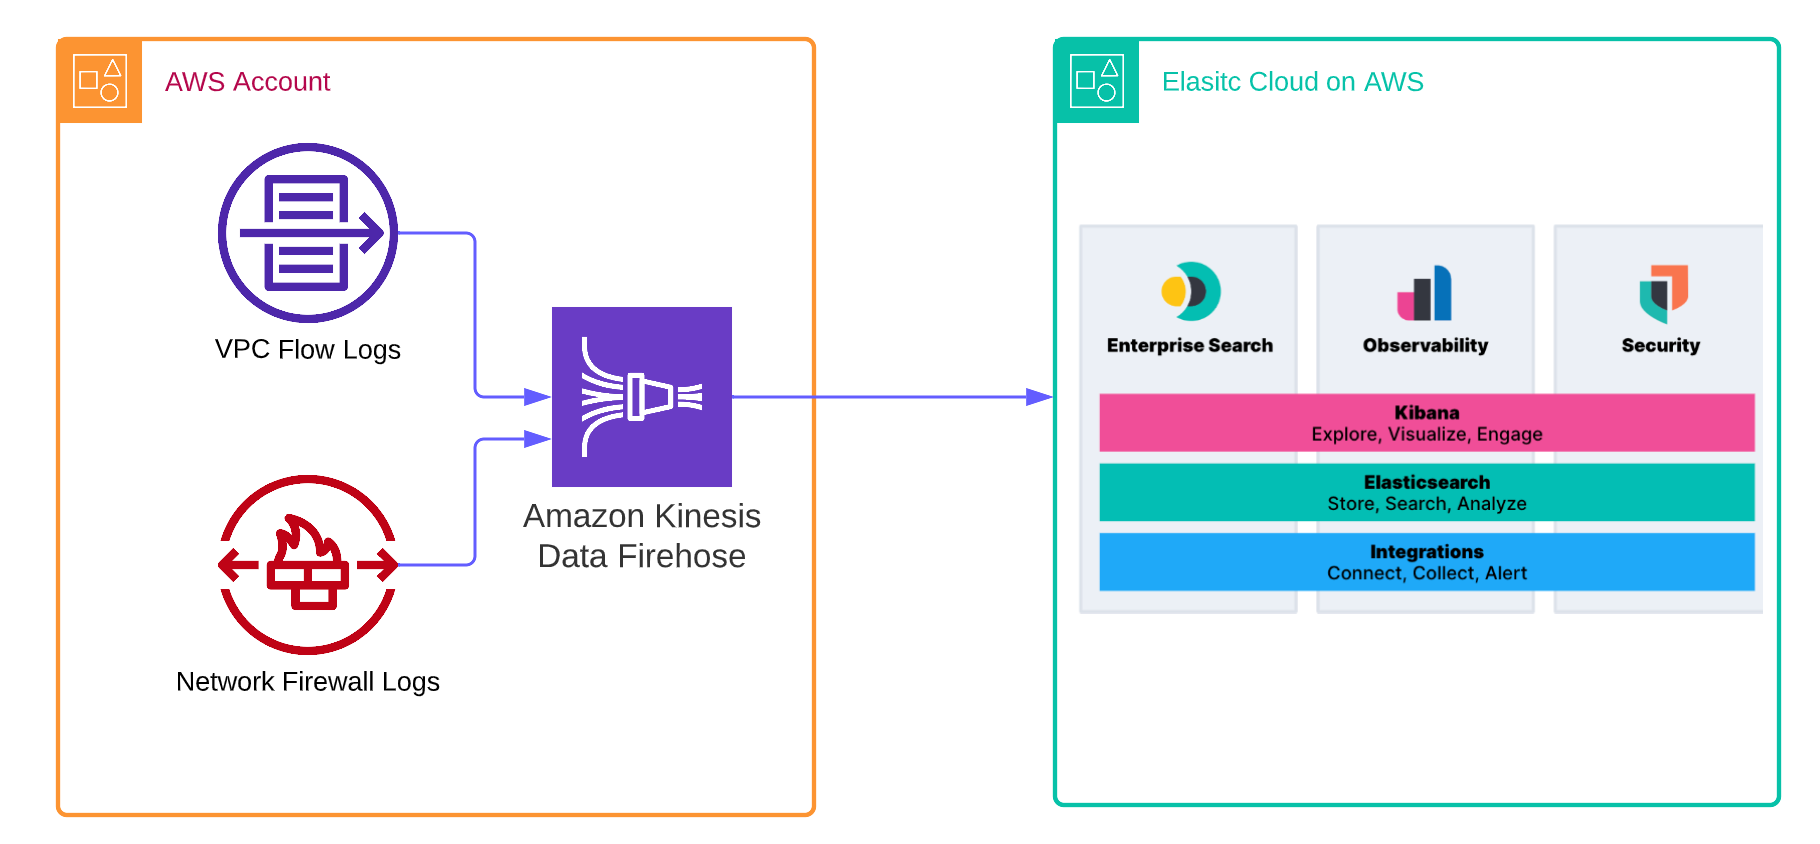
Unleash the power of Elastic and Amazon Kinesis Data Firehose to enhance observability and data analytics
AWS users can now leverage the new Amazon Kinesis Firehose Delivery Stream to directly ingest logs into Elastic Cloud in real time for centralized alerting, troubleshooting, and analytics across your cloud and on-premises infrastructure.

Root cause analysis with logs: Elastic Observability's AIOps Labs
Elastic Observability provides more than just log aggregation, metrics analysis, APM, and distributed tracing. Our machine learning-based AIOps capabilities help you analyze the root cause of issues allowing you to focus on the most important tasks.

Monitoring service performance: An overview of SLA calculation for Elastic Observability
Elastic Stack provides many valuable insights for different users, such as reports on service performance and if the service level agreement (SLA) is met. In this post, we’ll provide an overview of calculating an SLA for Elastic Observability.

Root cause analysis with logs: Elastic Observability's anomaly detection and log categorization
Elastic Observability provides more than just log aggregation, metrics analysis, APM, and distributed tracing. Elastic’s machine learning capabilities help analyze the root cause of issues, allowing you to focus your time on the most important tasks.

Easily analyze AWS VPC Flow Logs with Elastic Observability
Elastic Observability can ingest and help analyze AWS VPC Flow Logs from your application’s VPC. Learn how to ingest AWS VPC Flow Logs through a step-by-step method into Elastic, then analyze it and apply OOTB machine learning for insights.