Category: OpenTelemetry
Articles tagged OpenTelemetry

How Elastic's ML and AI Assistant cut 802.1x triage from 20 minutes to seconds in the NOC
Find out how Network Operations Center (NOC) teams use Elasticsearch, ML, and the Elastic AI Assistant to cut MTTR, tame alert fatigue, and solve network issues fast.
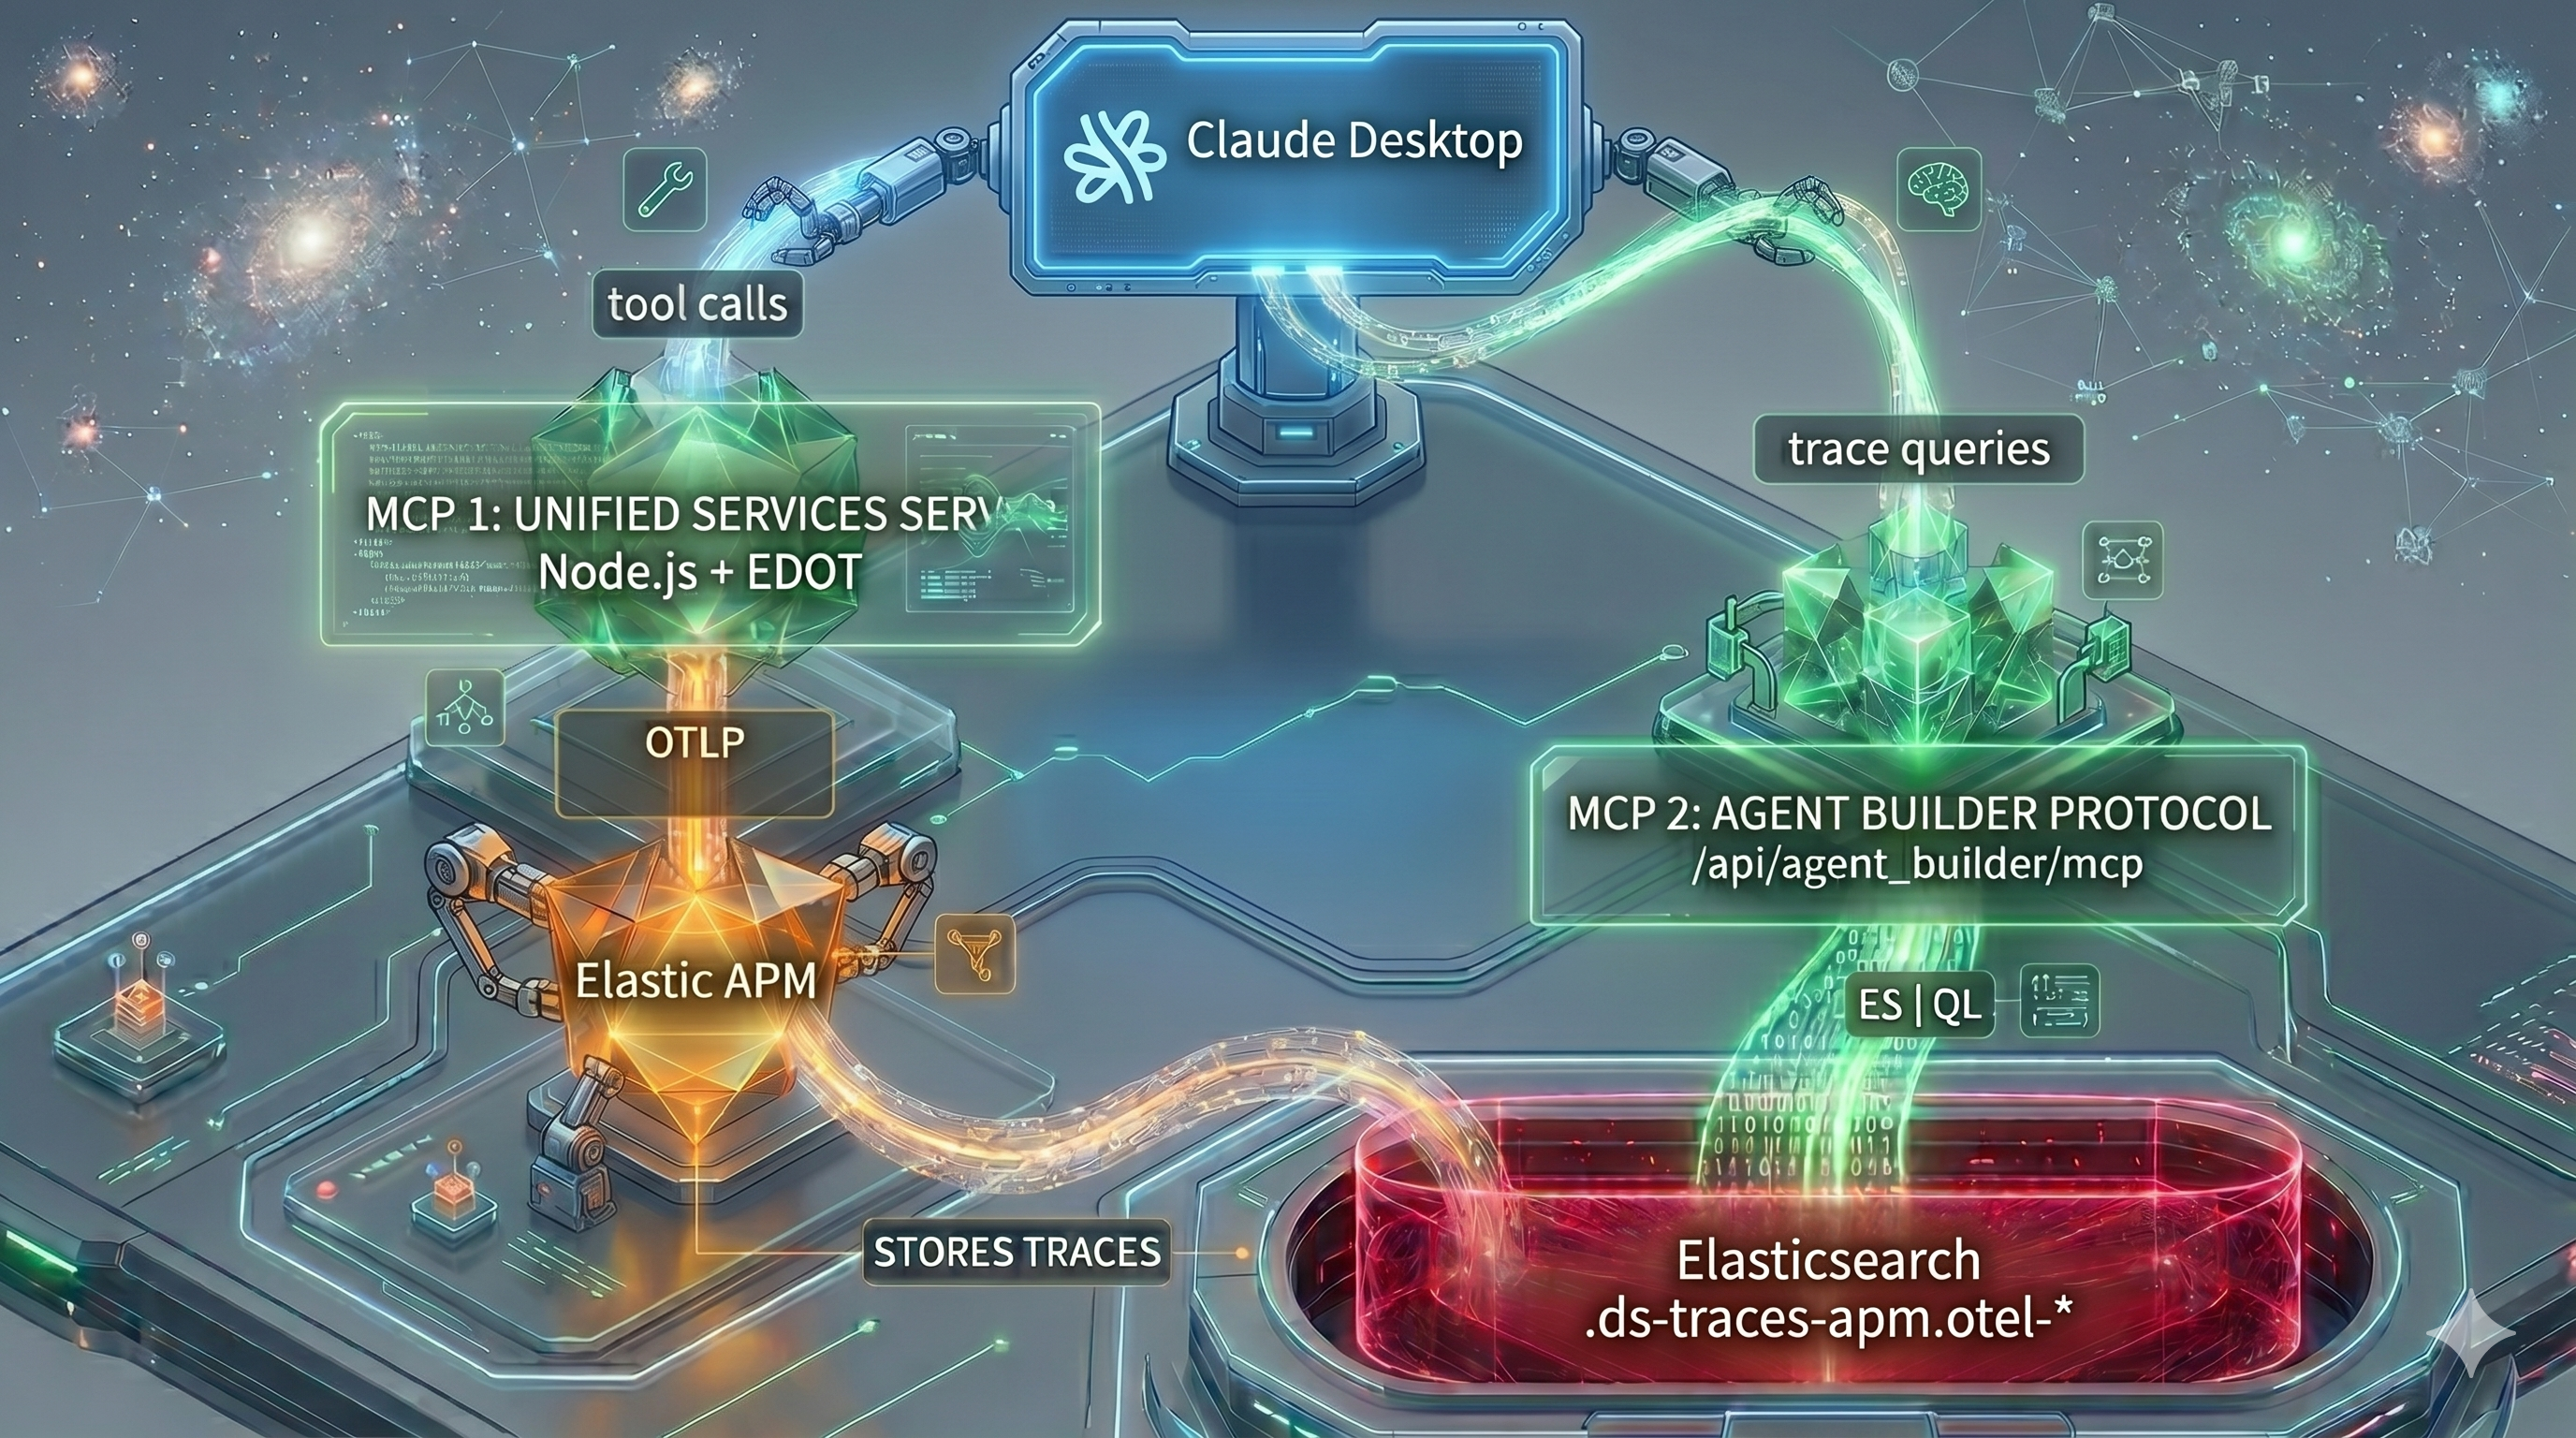
How to trace MCP server tool calls with OpenTelemetry and Elastic APM
Add OpenTelemetry tracing to an MCP server, visualize tool call performance in Elastic APM, and query the trace data from Claude Desktop using the Agent Builder MCP.

Kubernetes observability: MCP specialist agents for safer EKS triage
Scope a specialist EKS MCP agent for cluster checks while the Elastic AI Agent triages; fix a service misconfiguration using the specialist agent in a few prompts.
Migrate Logstash Pipelines from Azure Event Hubs to OTel Collector Kafka Receiver
Step-by-step guide to migrating Logstash pipelines from the Azure Event Hubs plugin to the OpenTelemetry Collector Kafka receiver.
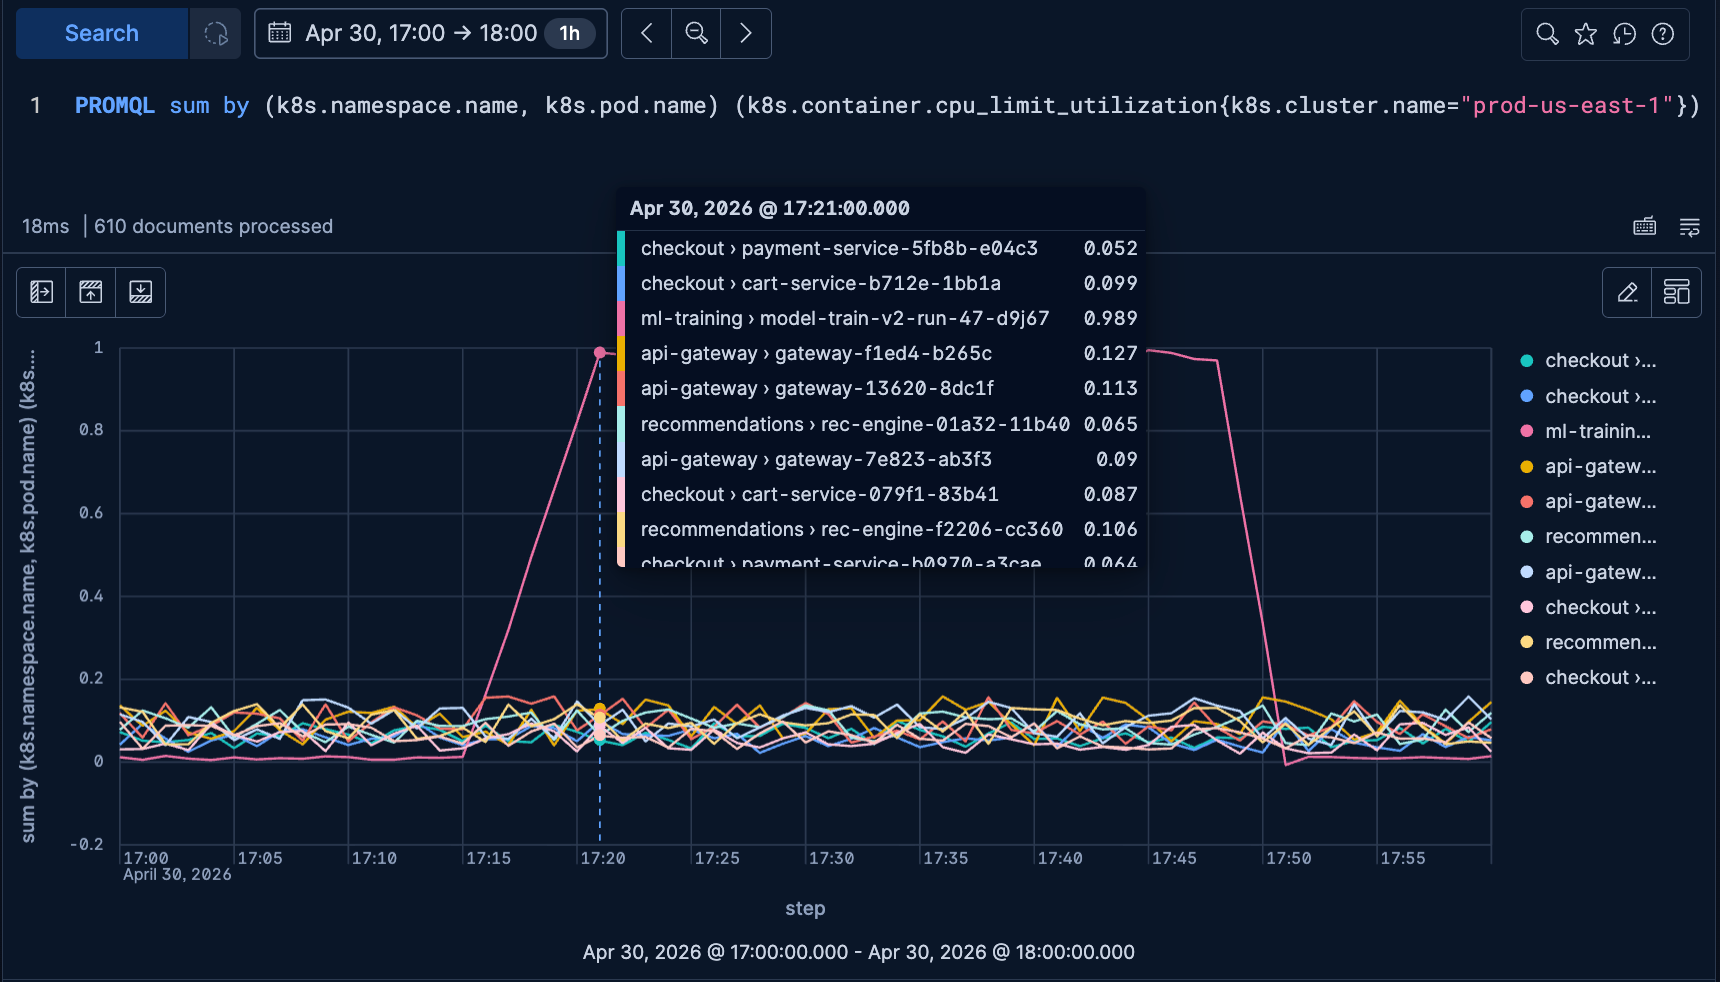
Investigate Kubernetes infrastructure issues with PromQL in Elasticsearch & Kibana
Walkthrough of a Kubernetes fleet-wide CPU investigation in Elastic Observability, from cluster to namespace to the noisy pod, using PromQL in Elasticsearch and Kibana.

OpenTelemetry browser instrumentation using EDOT Browser & Kibana
A step-by-step guide on OpenTelemetry browser instrumentation. Learn how to add EDOT Browser to a web app, export browser telemetry via OTLP, and verify traces, spans, and service maps in Kibana.

Visualizing OpenTelemetry Data in Elastic with OpenTelemetry Content Packages
Learn and explore how OpenTelemetry Content Packages in Elastic provide instant dashboards, alerts, and SLOs for your telemetry data.

Composing OpenTelemetry Reference Architectures
A conceptual framework for reasoning about OpenTelemetry Collection architectures — edge, processing, and resilience layers that compose into the right pipeline for your environment.
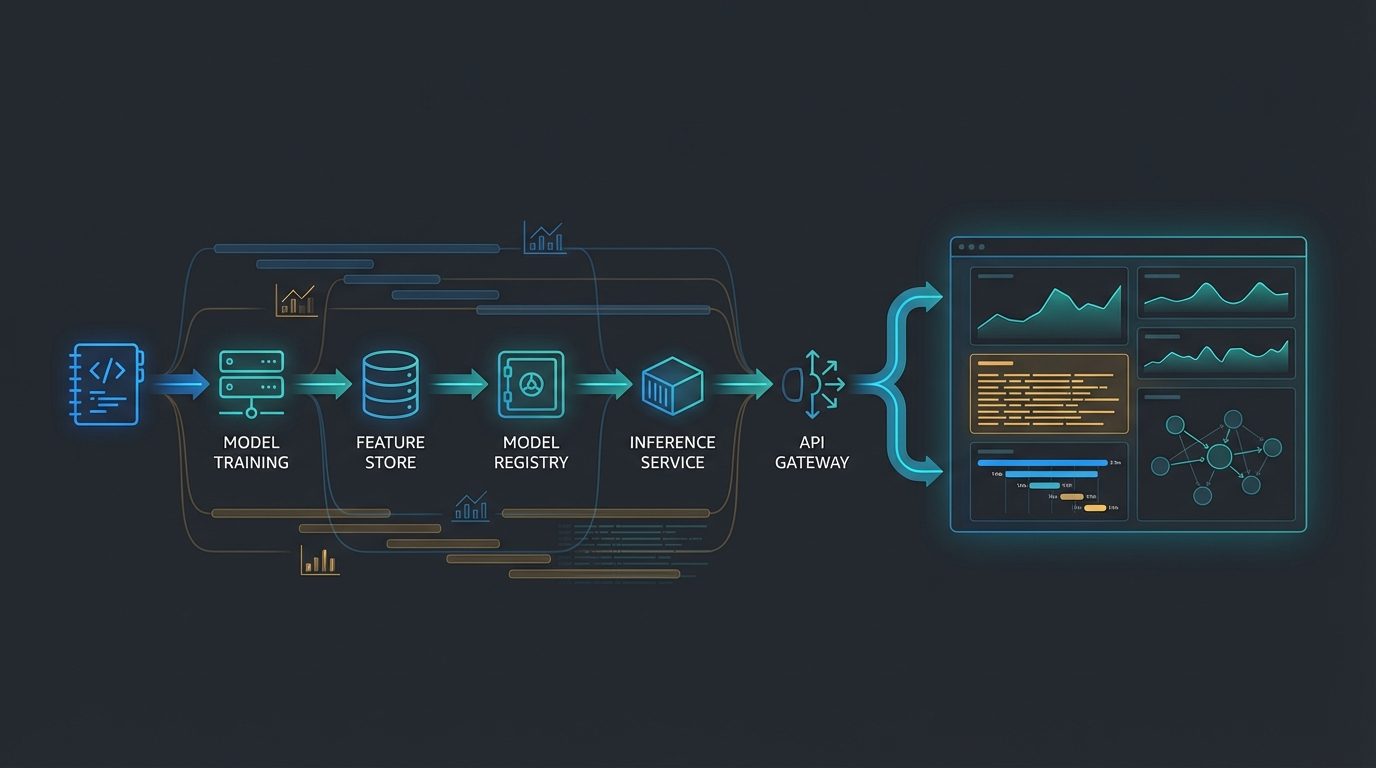
ML and AI Ops Observability with OpenTelemetry and Elastic
Learn how to instrument ML and AI pipelines with OpenTelemetry and Elastic to correlate traces, logs, and metrics from notebooks to production inference services.

AI agent observability and monitoring with OTel, OpenLit & Elastic
Learn how to monitor AI web agents to identify performance bottlenecks, token waste, and hallucinations using
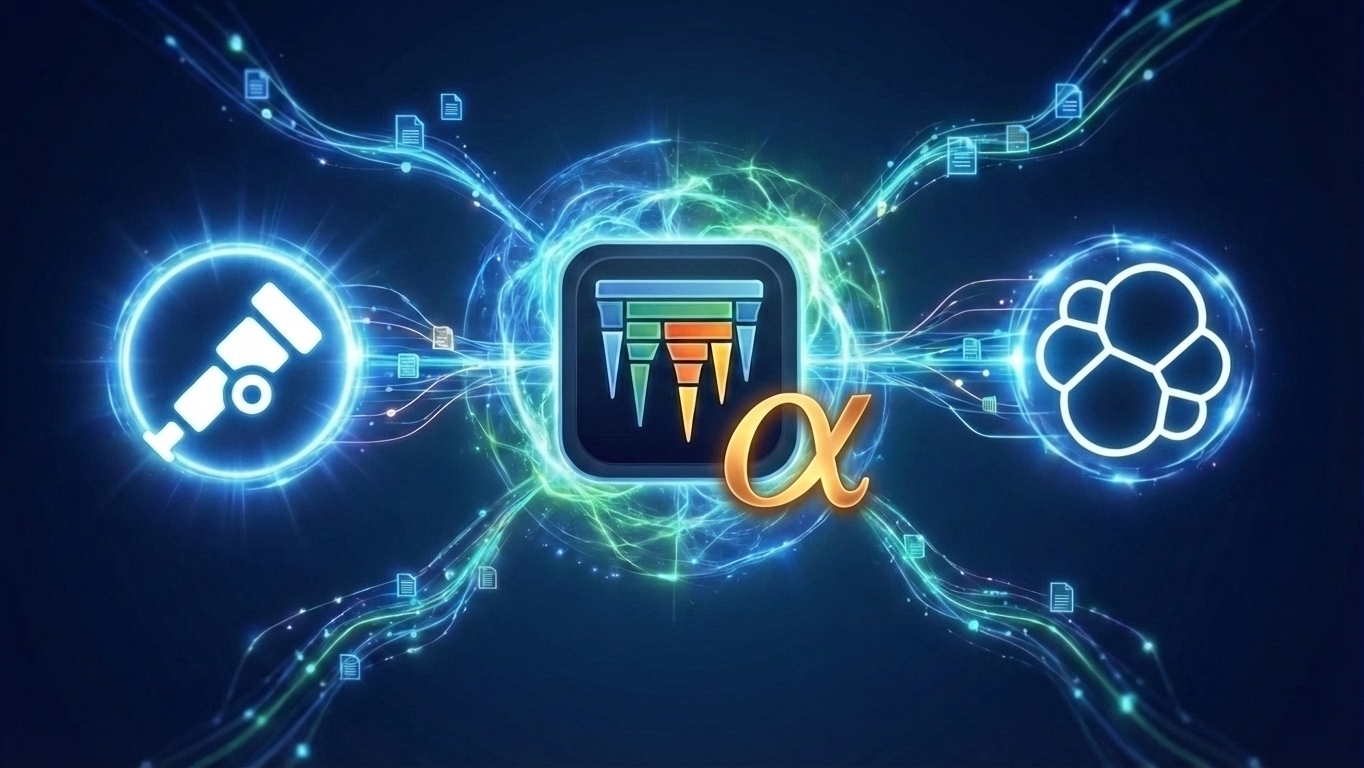
OpenTelemetry Profiles Signal Enters Alpha: Elastic’s Continuous Commitment to Profiling
OpenTelemetry Profiles has officially reached Alpha, entrenching profiling as the fourth observability signal. Elastic's core contribution of its eBPF profiling agent, continued OpenTelemetry Profiles signal work and commitment to a vendor-agnostic ecosystem are driving this industry-wide standard forward.