
Android application monitoring with OpenTelemetry: distributed tracing from tap to backend
EDOT Android adds mobile APM to your Android app with one Gradle dependency: crash reporting, session tracking and distributed tracing visible in Kibana.
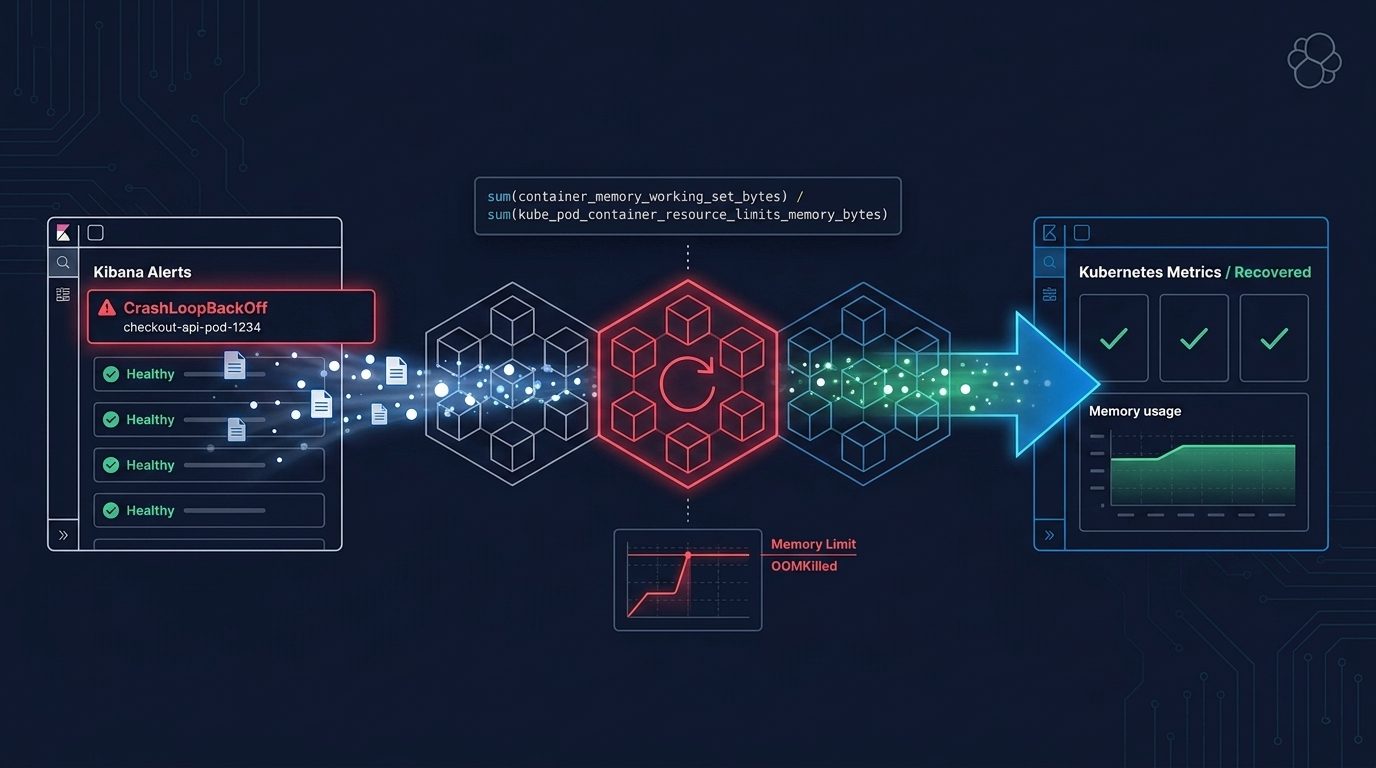
From CrashLoopBackOff to OOMKilled with PromQL in Elasticsearch and Kibana
Use PromQL in Elasticsearch and Kibana to move from a CrashLoopBackOff alert to OOMKilled, memory versus the limit, and a verified fix.
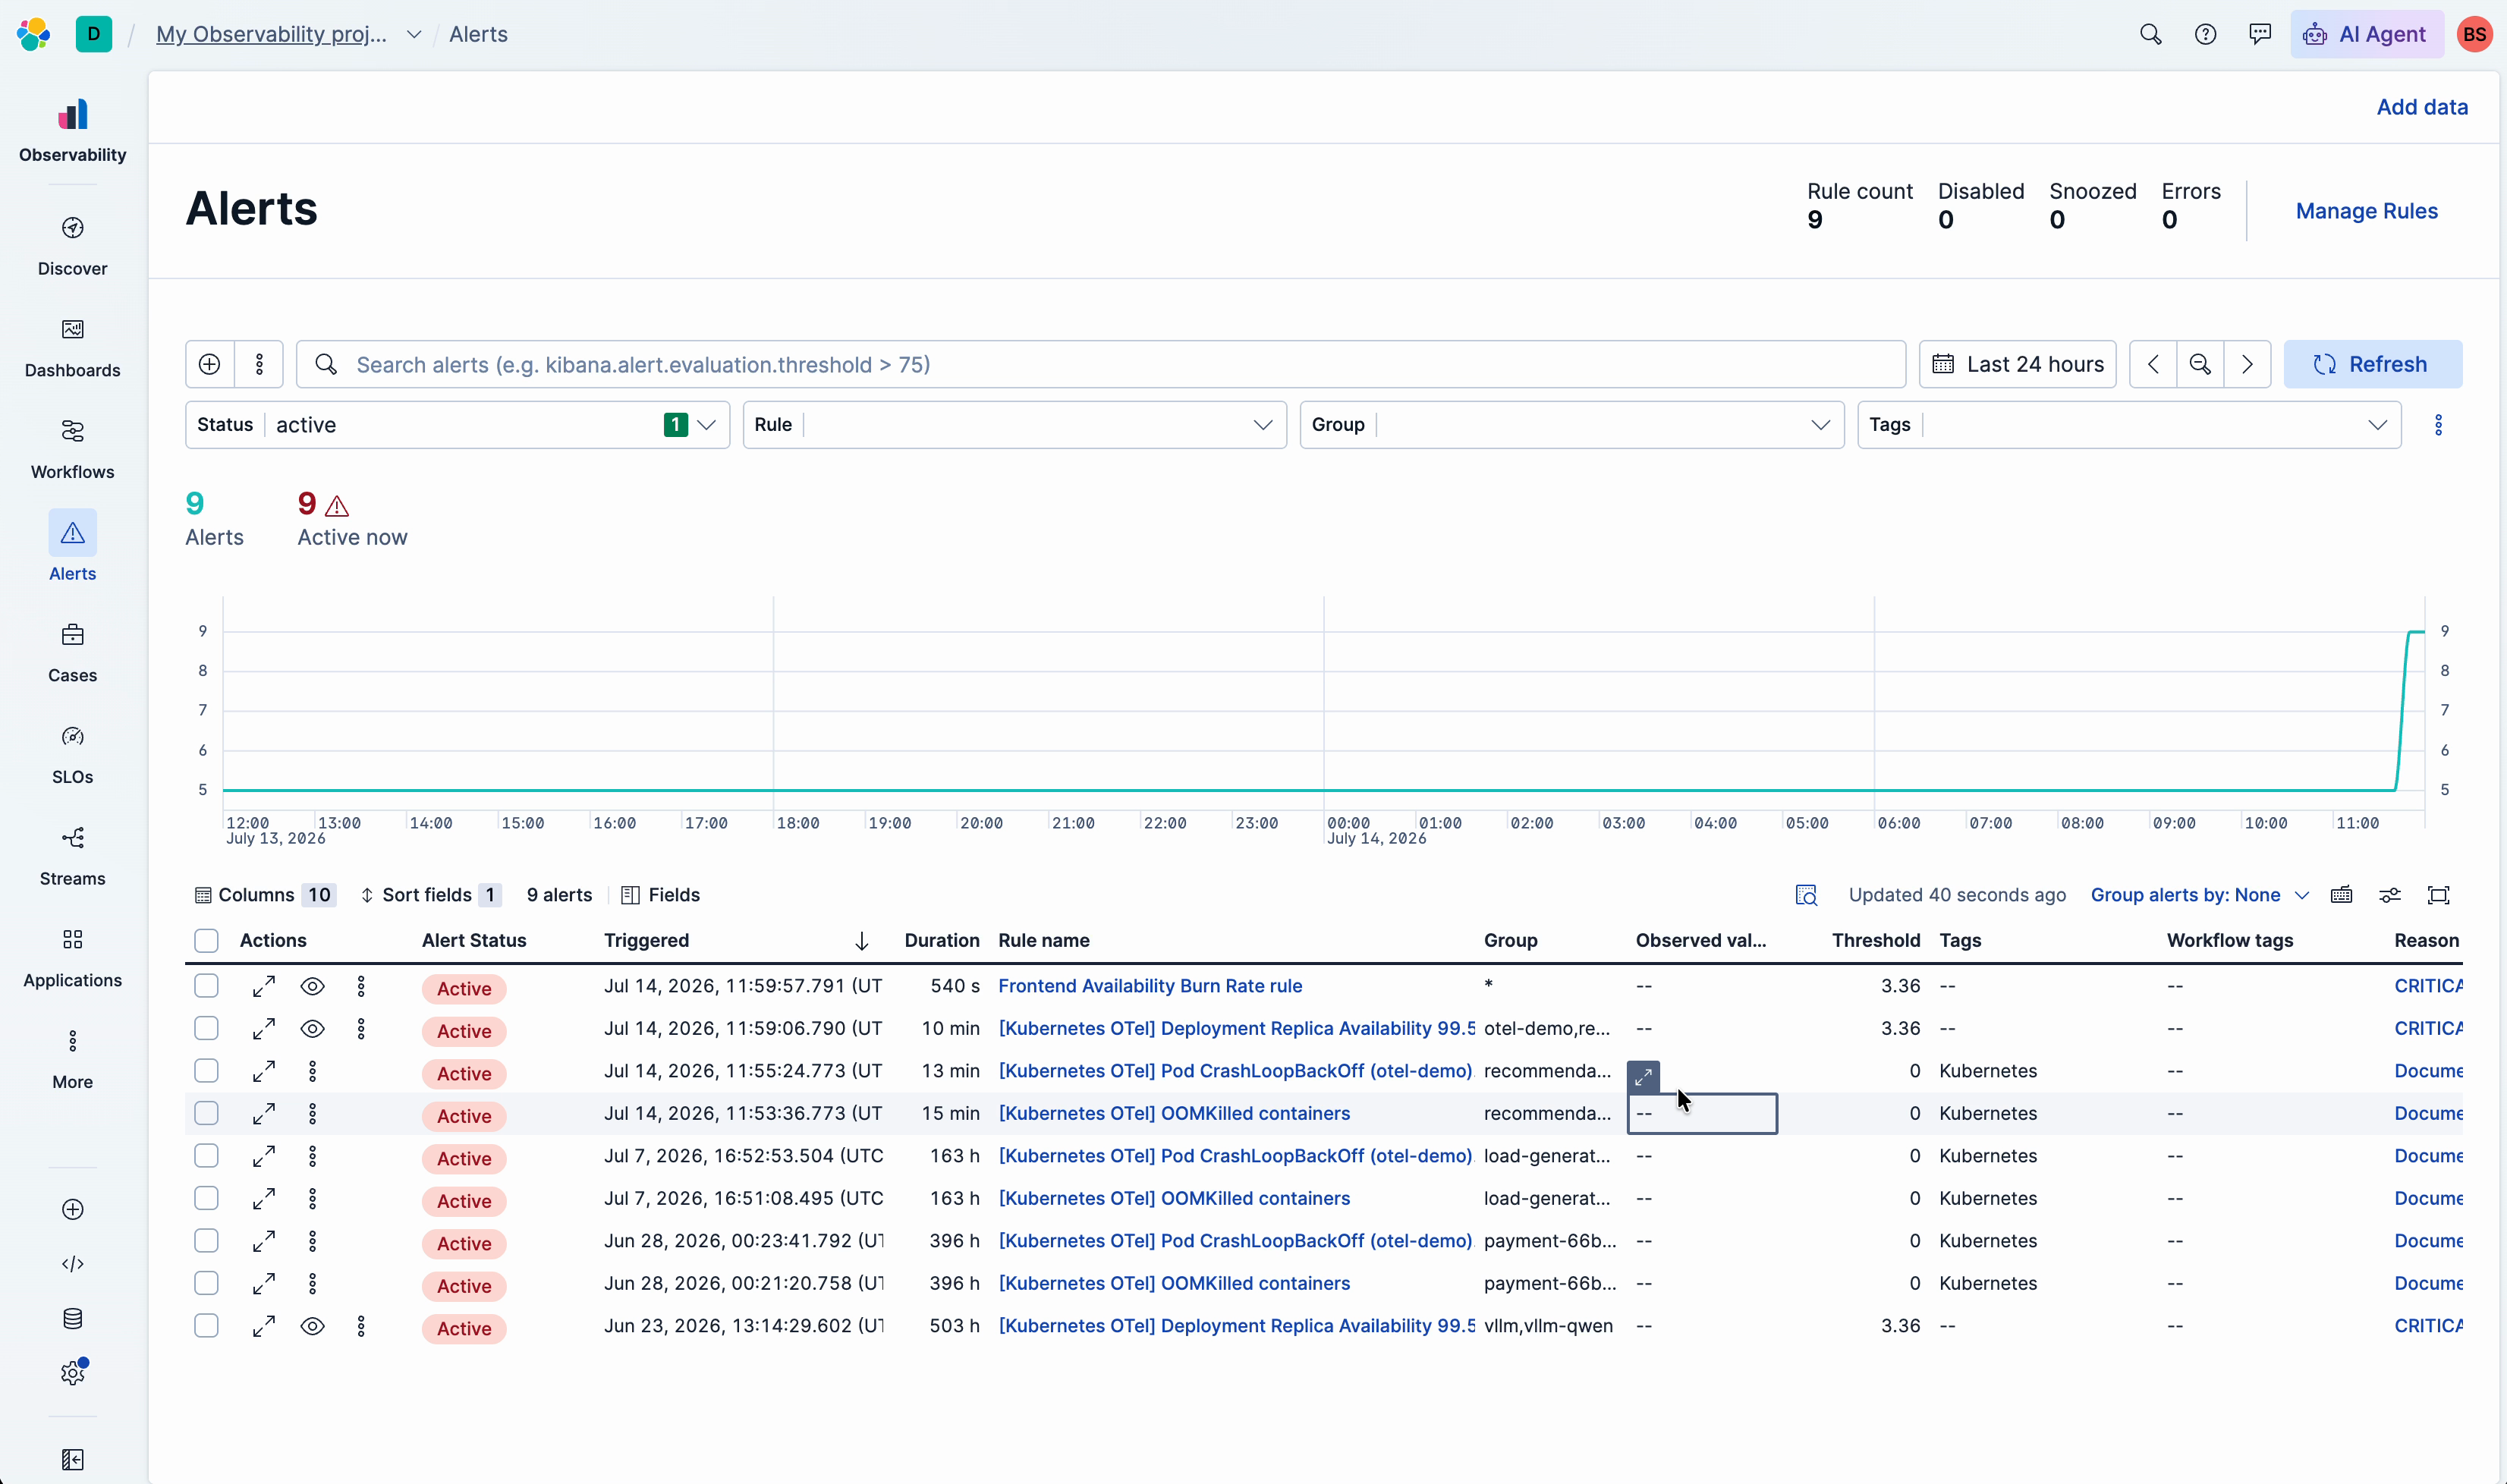
CrashLoopBackOff to root cause in seconds: automating the 20-minute Kubernetes investigation with Elastic Observability
Elastic's Kubernetes Experience fires alongside the CrashLoopBackOff alert and delivers a root-cause hypothesis with evidence before you even open it.
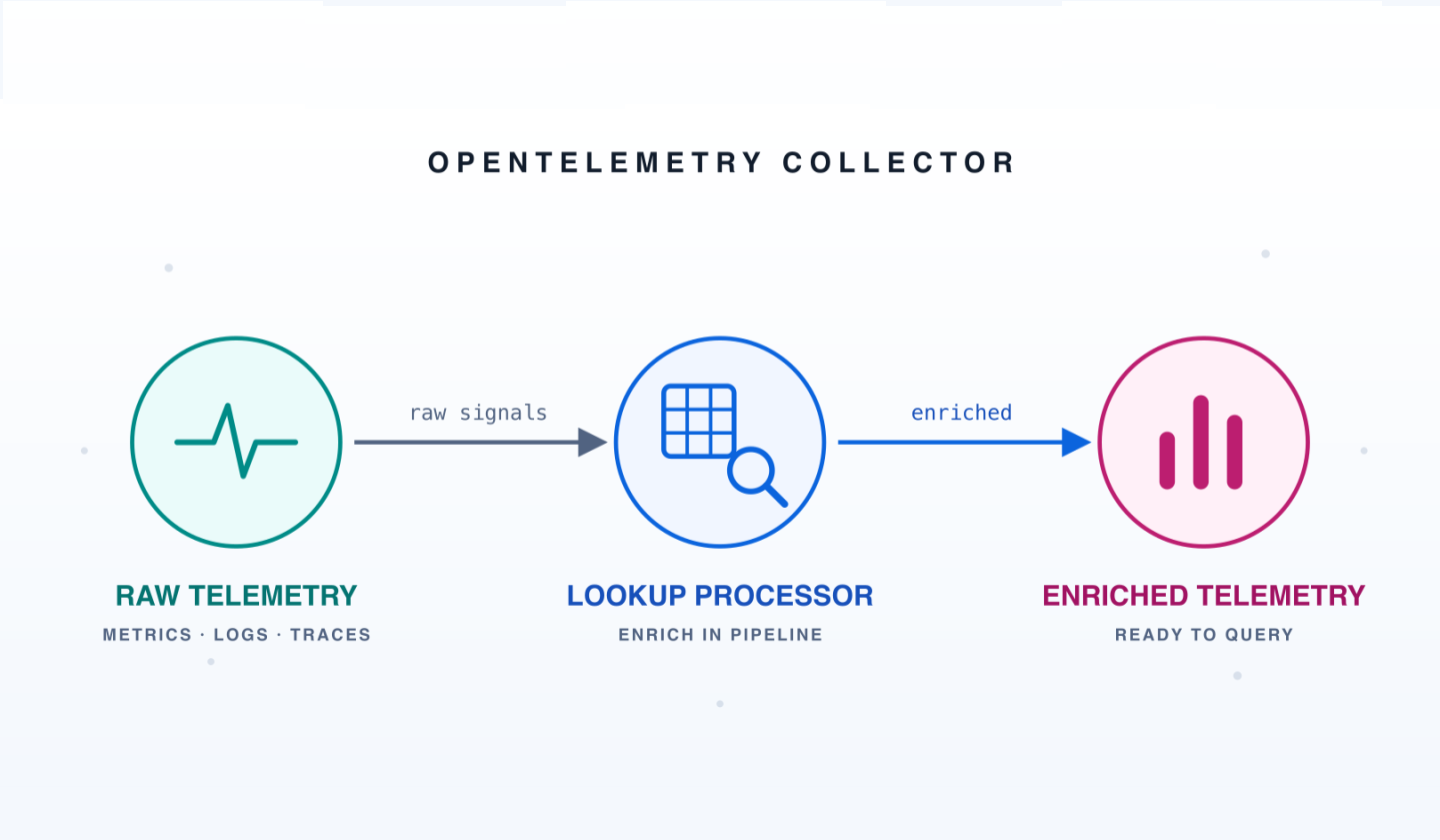
You have the IP, you want the hostname: building a lookup processor for OpenTelemetry
Look up any value from YAML, CSV or DNS inside the OpenTelemetry Collector or wire in your own source through a processor Elastic built and shipped to Collector Contrib.
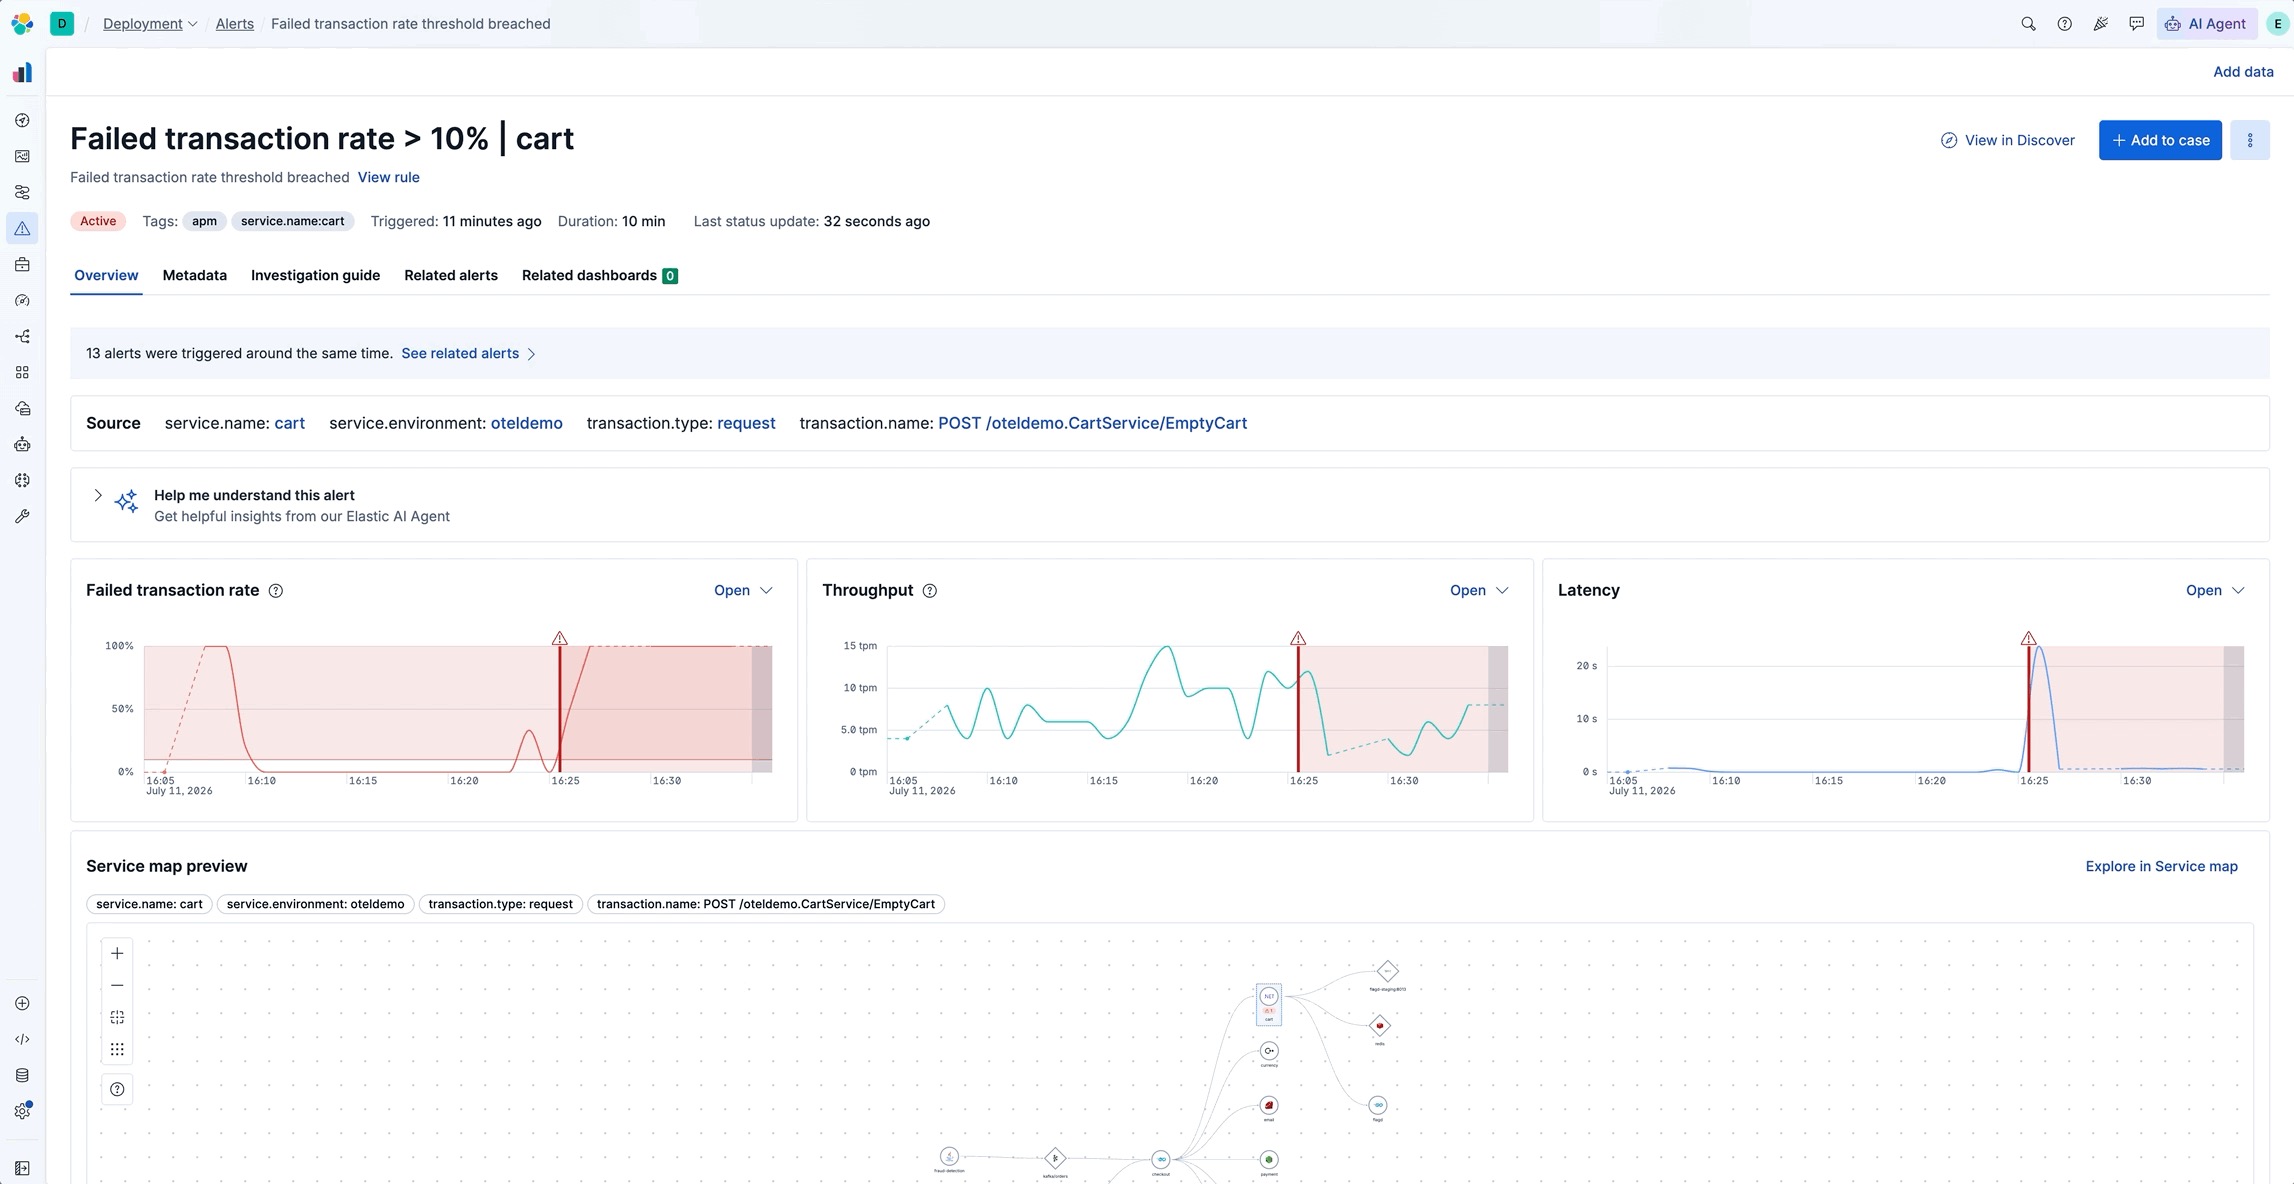
Three clicks from alert to error log: breaking down RED metrics by any span attribute in Elastic Observability
See which pod, deployment or version is driving a RED metrics change by breaking down span attributes in Discover, then trace a failing span to the error log behind it.
How Elastic cut OpenTelemetry tail sampling memory by 65% with disk-backed trace storage
Elastic contributed two features upstream to the OTel Collector's tail sampling processor. The span-ingest strategy lets sampling decisions happen earlier, and Pebble tail storage moves trace buffering to disk. It costs more CPU, but operators can raise decision_wait and num_traces without OOM kills.
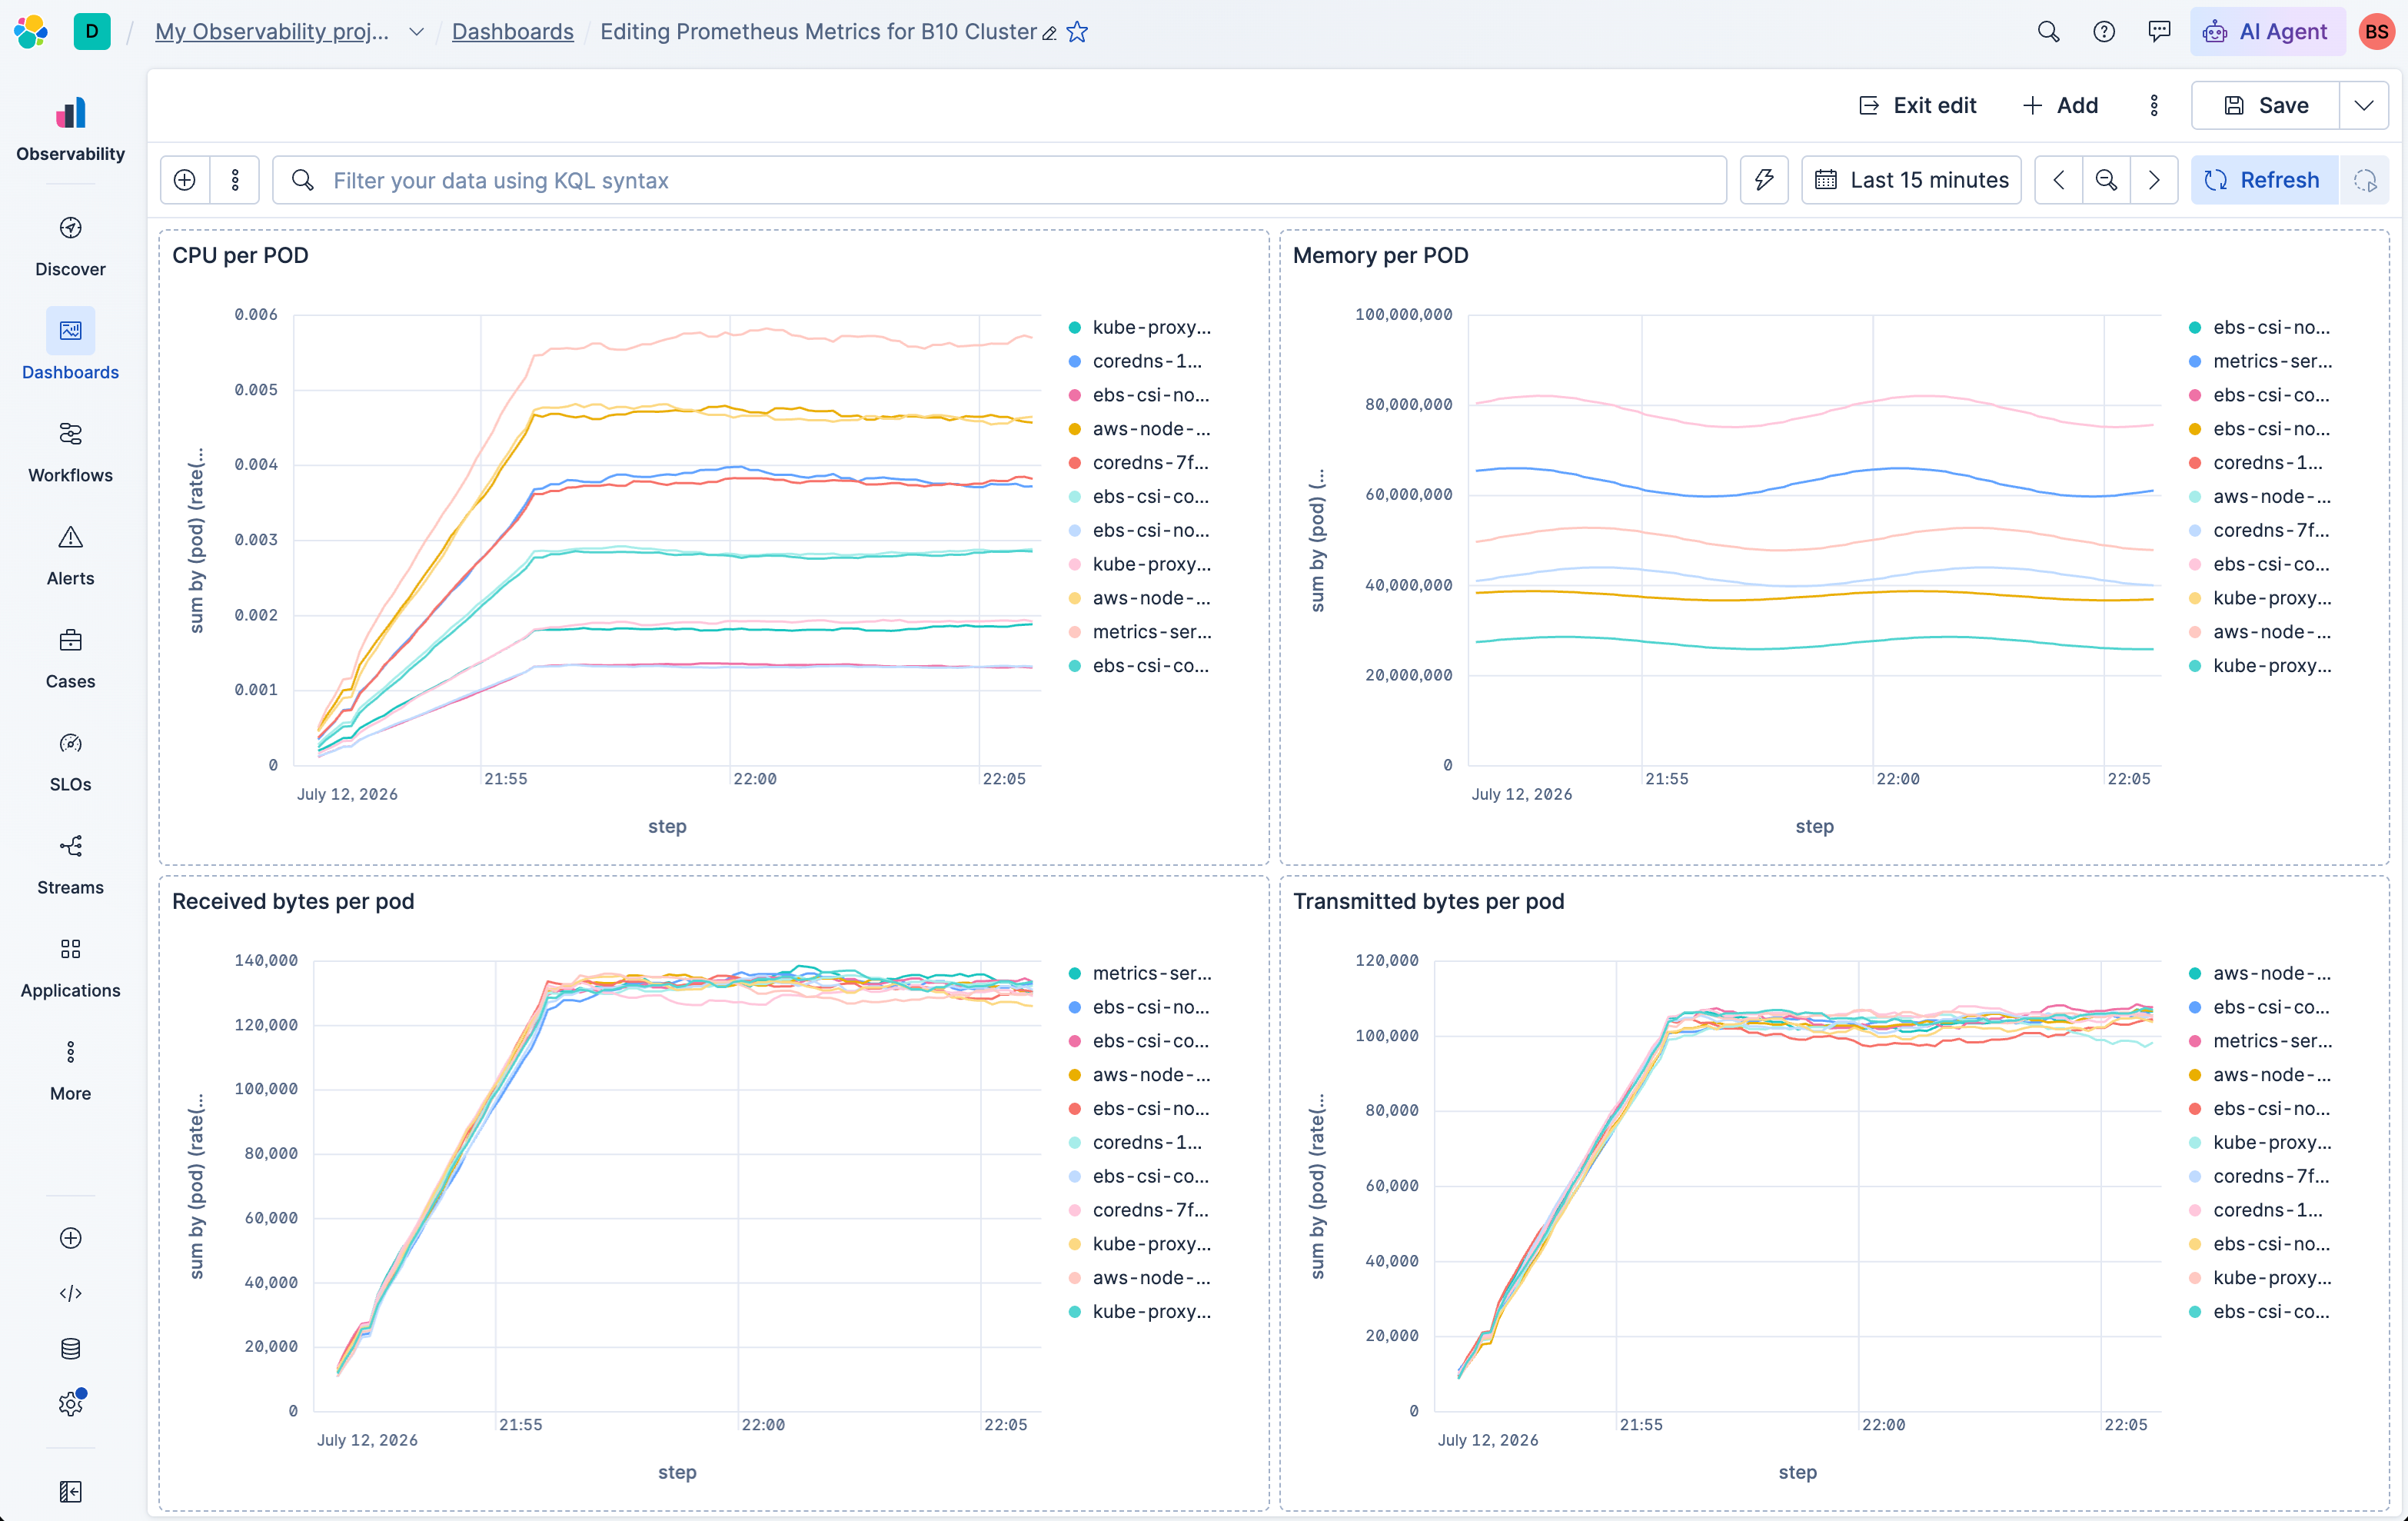
Prometheus metrics in Elastic Observability: your PromQL runs unchanged
Point Prometheus from your Kubernetes cluster at Elastic Observability with one config block. PromQL runs unchanged, keep your PromQL no cardinality billing.