APM Articles

How Elastic cut OpenTelemetry tail sampling memory by 65% with disk-backed trace storage
Elastic contributed two features upstream to the OTel Collector's tail sampling processor. The span-ingest strategy lets sampling decisions happen earlier, and Pebble tail storage moves trace buffering to disk. It costs more CPU, but operators can raise decision_wait and num_traces without OOM kills.

From five dashboards to one prompt: how we built an APM health monitor with Elastic Agent Builder
Five ES|QL tools score latency, errors, throughput and dependencies to find the root cause, so you don't dashboard-hop during an APM incident.
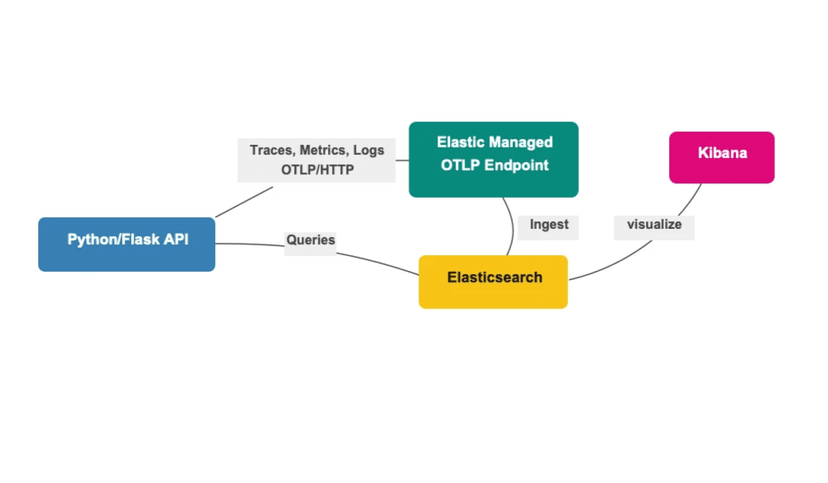
3 signals, 2 env vars, 0 collectors: OpenTelemetry with Python and Elastic's Managed OTLP Endpoint
Instrument a Flask API with OpenTelemetry and ship traces, metrics, and logs to Elastic Cloud using just 2 environment variables, no collector needed.

Contextual AI: Stop pinging the SRE: three MCP tools that turn Elastic Agent Builder into your team's runbook
Build three MCP tools in Elastic Agent Builder that read endpoint health, recent deploys and SLO burn rate directly in your editor. Encode your platform team's runbook once; every developer gets self-serve production context without pinging an SRE.
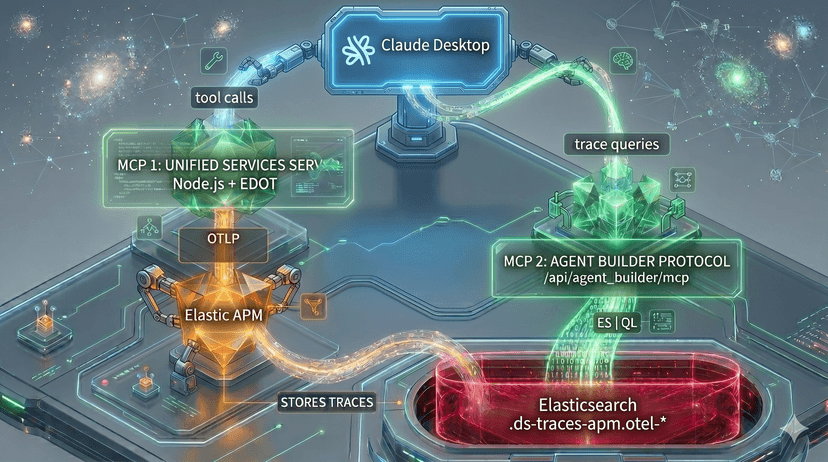
How to trace MCP server tool calls with OpenTelemetry and Elastic APM
Add OpenTelemetry tracing to an MCP server, visualize tool call performance in Elastic APM, and query the trace data from Claude Desktop using the Agent Builder MCP.

Connecting Cursor to Production Logs via the Elastic MCP Server
Learn how to connect Cursor to your Elastic APM data using the Elastic Agent Builder MCP server, so you can debug production errors and make UI decisions backed by real usage data without leaving your editor.

OpenTelemetry browser instrumentation using EDOT Browser & Kibana
A step-by-step guide on OpenTelemetry browser instrumentation. Learn how to add EDOT Browser to a web app, export browser telemetry via OTLP, and verify traces, spans, and service maps in Kibana.

ML and AI Ops Observability with OpenTelemetry and Elastic
Learn how to instrument ML and AI pipelines with OpenTelemetry and Elastic to correlate traces, logs, and metrics from notebooks to production inference services.

How we fixed head-based sampling in OpenTelemetry
Head-based sampling can break throughput charts without sampling metadata. Learn how OpenTelemetry tracestate probability fields fixed this in Java, JS, and Python.

Bridging the Gap: End-to-End Observability from Cloud Native to Mainframe
Achieving end-to-end observability in hybrid enterprise environments, where modern cloud-native applications interact with critical, yet often opaque, IBM mainframe systems is a challenge. By utilizing IBM Z Observability Connect, which enables OTel output, with Elastic Observability is a solution, transforming your mainframe black box into a fully observable component in your deployment
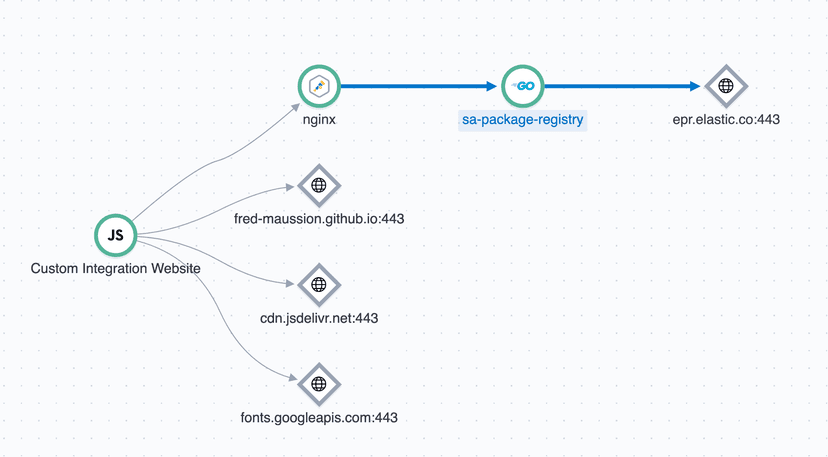
A Practical Guide to end-to-end distributed tracing for Nginx with OpenTelemetry in Elastic
Instrument Nginx with the OpenTelemetry tracing module and export spans to Elastic Observability's APM for full end-to-end distributed tracing.

Find answers quickly, correlate OpenTelemetry traces with existing ECS logs in Elastic Observability
In this blog we will discuss how EDOT enables you to collect existing ECS logs while ensuring a seamless and transparent move to OTel semantic conventions. The key benefit is that applications can continue sending logs as they do today, which minimizes the effort and impact on application developers.