Blogs
Hands-on, insight-driven content about observing your production and development environments using Elastic Observability.

Exploring Nginx metrics with Elastic time series data streams
Elasticsearch recently released time series metrics as GA. In this blog, we dive into details of what a time series metric document is and the mapping used for enabling time series by using an existing OOTB Nginx integration.

How to capture custom metrics without app code changes using the Java Agent Plugin
When the application you're monitoring doesn't emit the custom metrics you'd like, and you can't directly change the app code, you can use a Java Agent Plugin to automatically instrument the application and emit the custom metrics you desire.

Improving the Elastic APM UI performance with continuous rollups and service metrics
We made significant improvements to the UI performance in Elastic APM to make it scale with even the most demanding workloads, by pre-aggregating metrics at the service level, and storing the metrics at different levels of granularity.

3 models for logging with OpenTelemetry and Elastic
Because OpenTelemetry increases usage of tracing and metrics with developers, logging continues to provide flexible, application-specific, and event-driven data. Explore OpenTelemetry logging and how it provides guidance on the available approaches.

Pruning incoming log volumes with Elastic
To drop or not to drop (events) is the question, not only in deciding what events and fields to remove from your logs but also in the various tools used. Learn about using Beats, Logstash, Elastic Agent, Ingest Pipelines, and OTel Collectors.

How to remove PII from your Elastic data in 3 easy steps
Personally Identifiable Information compliance is an ever increasing challenge for any organization. With Elastic's intuitive ML interface and parsing capabilities, sensitive data may be easily redacted from unstructured data with ease.

Using the Elastic Agent to monitor Amazon ECS and AWS Fargate with Elastic Observability
In this article, we’ll guide you through how to install the Elastic Agent with the AWS Fargate integration as a sidecar container to send host metrics and logs to Elastic Observability.

Simplifying log data management: Harness the power of flexible routing with Elastic
The reroute processor, available as of Elasticsearch 8.8, allows customizable rules for routing documents, such as logs, into data streams for better control of processing, retention, and permissions with examples that you can try on your own.

How to enable Kubernetes alerting with Elastic Observability
In the Kubernetes world, different personas demand different kinds of insights. In this post, we’ll focus on alerting and provide an overview of how alerts in Elastic Observability can help users quickly identify Kubernetes problems.

Gaining new perspectives beyond logging: An introduction to application performance monitoring
Change is on the horizon for the world of logging. In this post, we’ll outline a recommended journey for moving from just logging to a fully integrated solution with logs, traces, and APM.
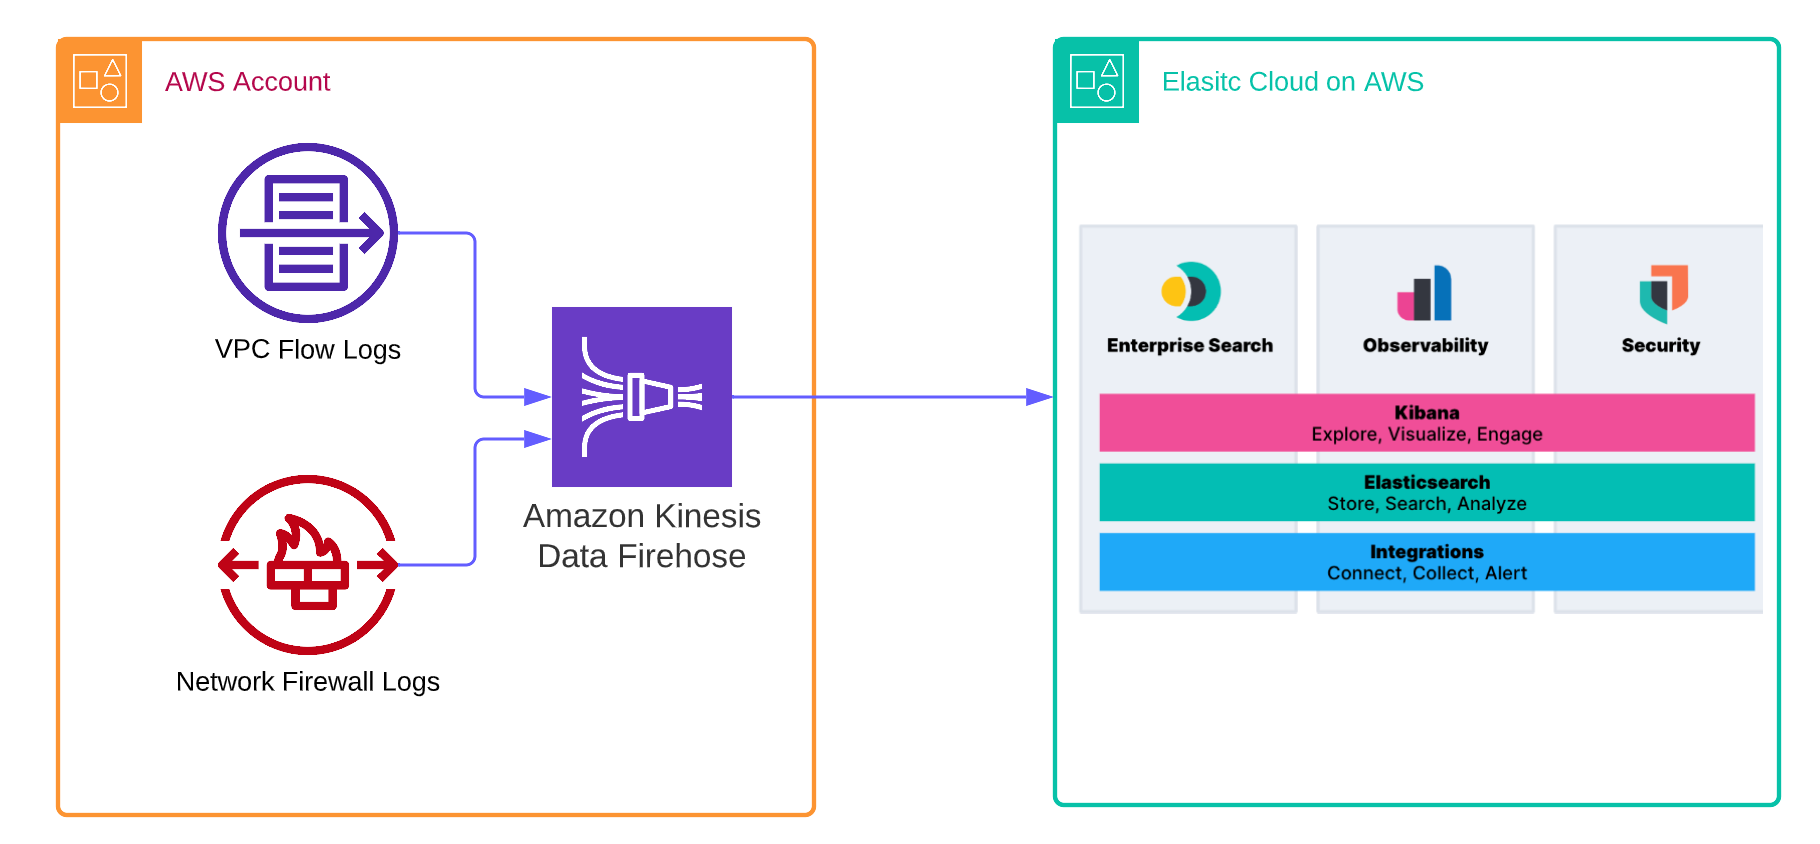
Unleash the power of Elastic and Amazon Kinesis Data Firehose to enhance observability and data analytics
AWS users can now leverage the new Amazon Kinesis Firehose Delivery Stream to directly ingest logs into Elastic Cloud in real time for centralized alerting, troubleshooting, and analytics across your cloud and on-premises infrastructure.
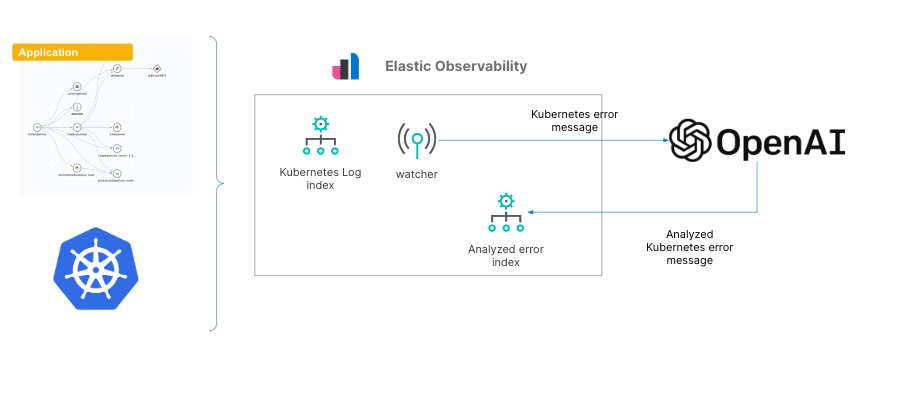
Gain insights into Kubernetes errors with Elastic Observability logs and OpenAI
This blog post provides an example of how one can analyze error messages in Elasticsearch with ChatGPT using the OpenAI API via Elasticsearch.