Category: Metrics
Articles tagged Metrics

Elastic now alerts at 80% OpenAI rate limit usage, before your app gets throttled
OpenAI rate limit monitoring in Elastic maps headroom across every project and model. Compare configured RPM, TPM and IPM limits against real usage and plan capacity before a throttling alert fires.
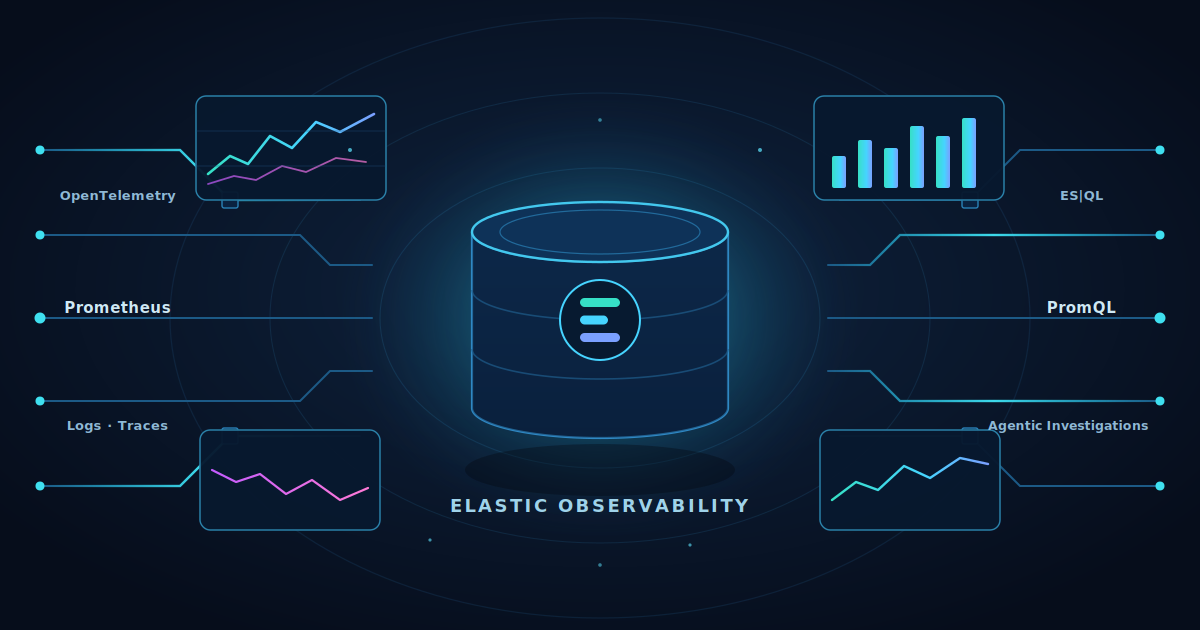
Elasticsearch: best-in-class for logs, now best-in-class for metrics
Elasticsearch is now best-in-class for metrics: 30× faster than Prometheus, up to 2.5× more storage-efficient, 50% less than Datadog. Learn about all the capabilities we’ve added.
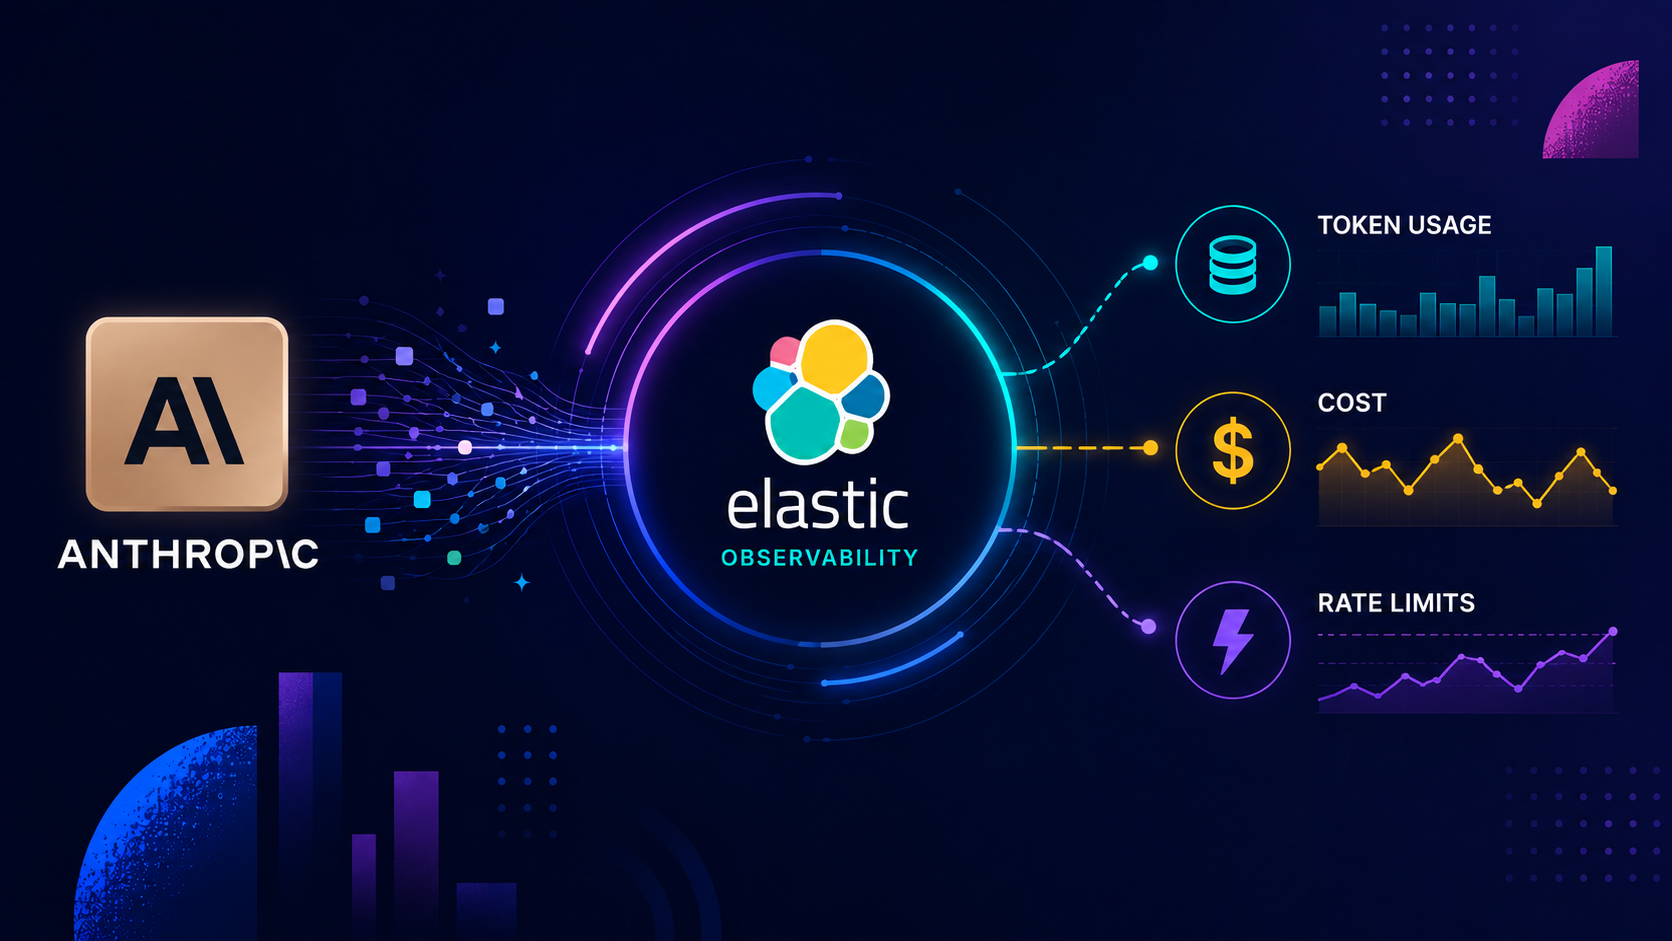
Stop finding out about your Claude bill on invoice day: Anthropic API monitoring is now in Elastic
Track Anthropic API spend and rate limit headroom across every workspace, model, and service tier, so cost surprises and throttling stop being production-time discoveries.
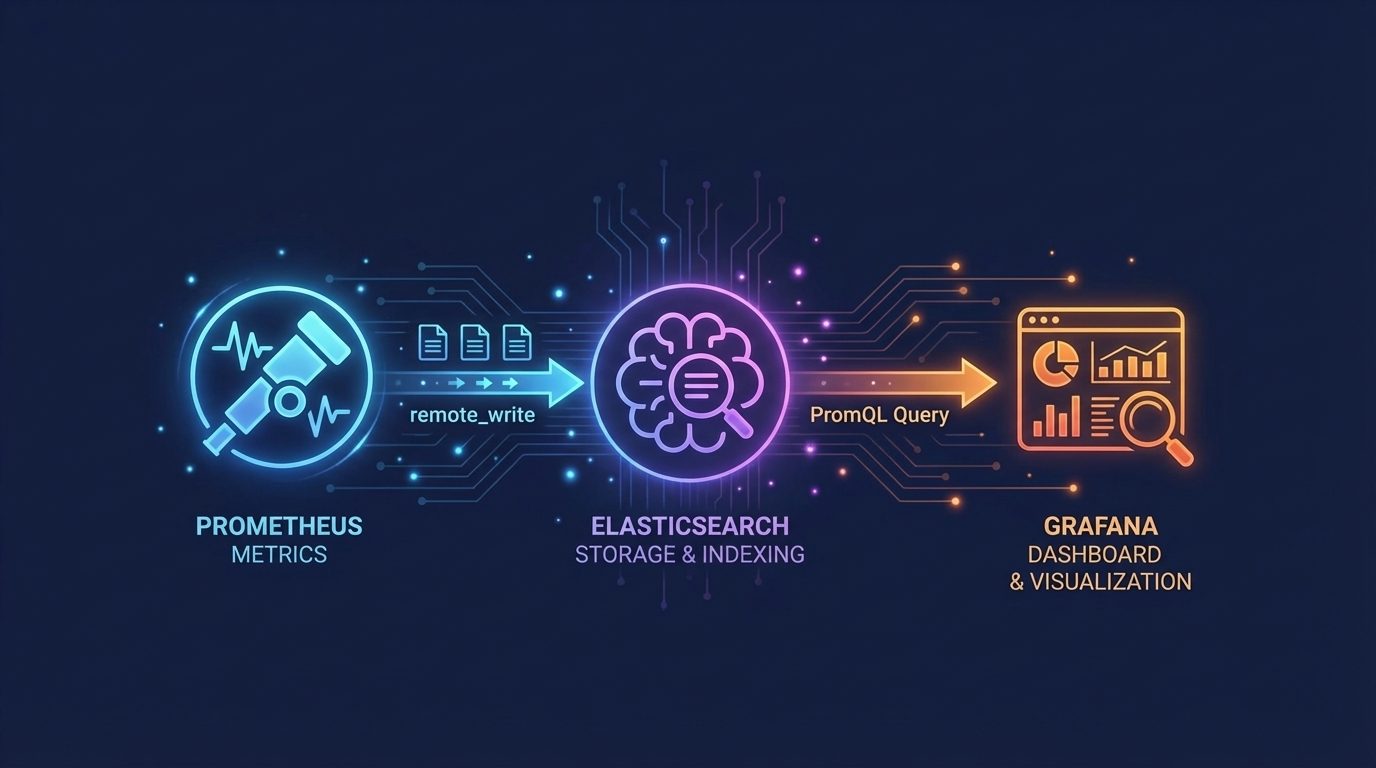
Use Elasticsearch as a Drop-In Prometheus Backend for Grafana
Use Elasticsearch as a Prometheus backend for Grafana dashboards, autocomplete, Metrics Drilldown, and alerting without changing PromQL workflows.
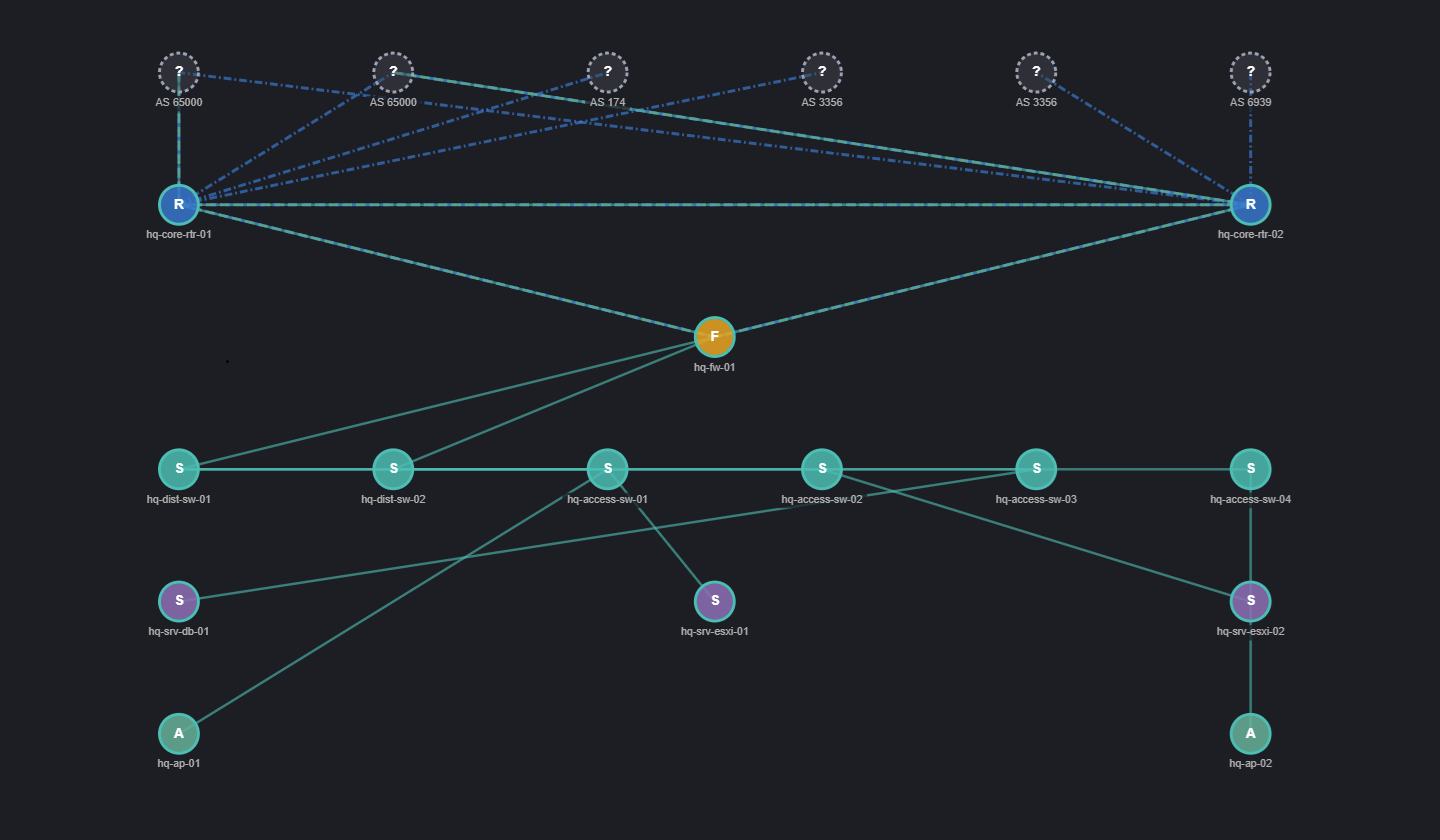
SNMP Topology Data in Kibana: Collection to Canvas
The Network Topology plugin for Kibana provides a ready-to-deploy Logstash pipeline, a structured schema, and a topology view that shows what's connected to what.

Configure downsampling directly in Elastic Streams, no more JSON editing needed
Configure downsampling in Elastic Streams alongside retention and tiers, with a live preview and validation. No more editing ILM or lifecycle JSON.
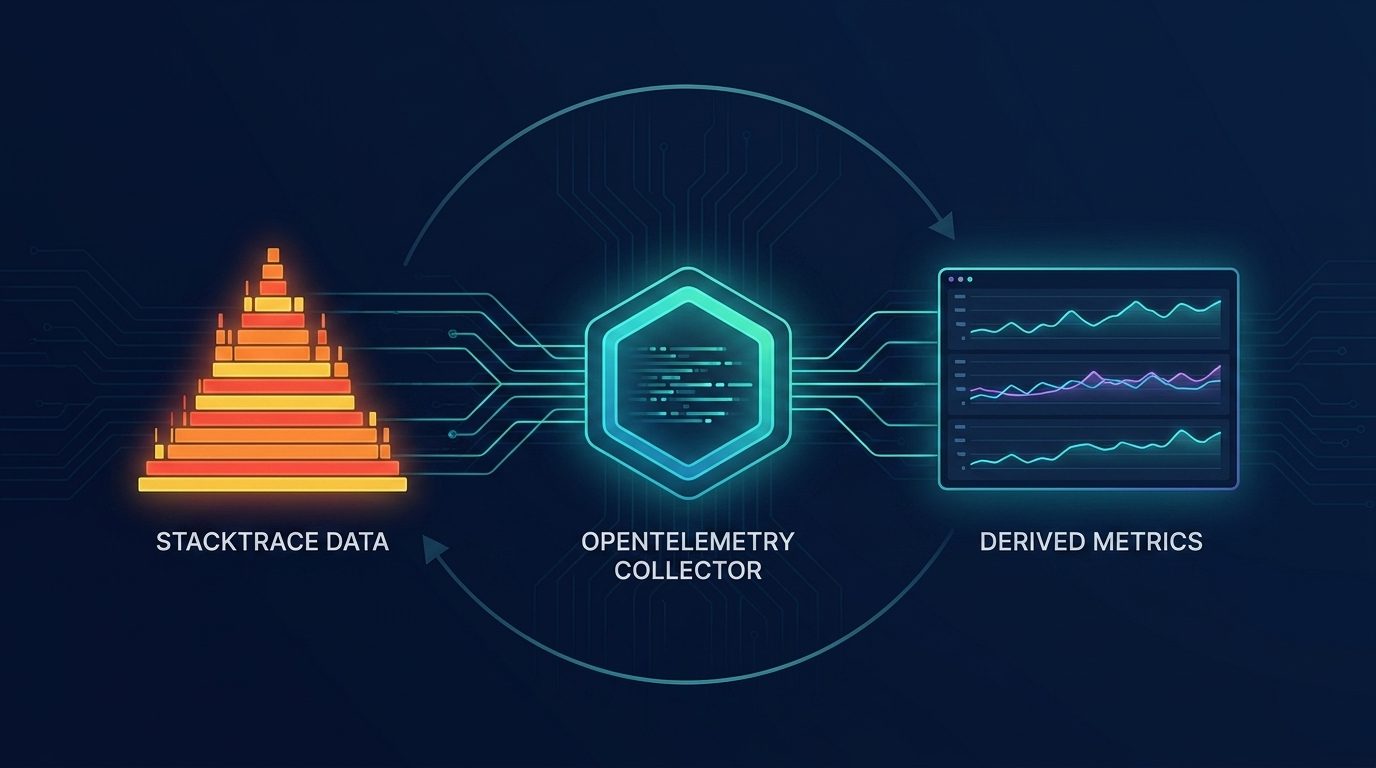
Self-Driving Observability: From Stacktraces to Profiling-Derived Metrics
Profiling-derived metrics turn raw stacktraces into time-series KPIs, unlock continuous profiling for every user and lay the foundation for an observability system that detects, investigates, and acts on its own.

Don't leave metrics on the table: query them with the ES|QL TS command
Recalibrate your mental model for time series queries: learn why FROM can produce inaccurate results for metrics, how TS fixes that, and when to use each command.
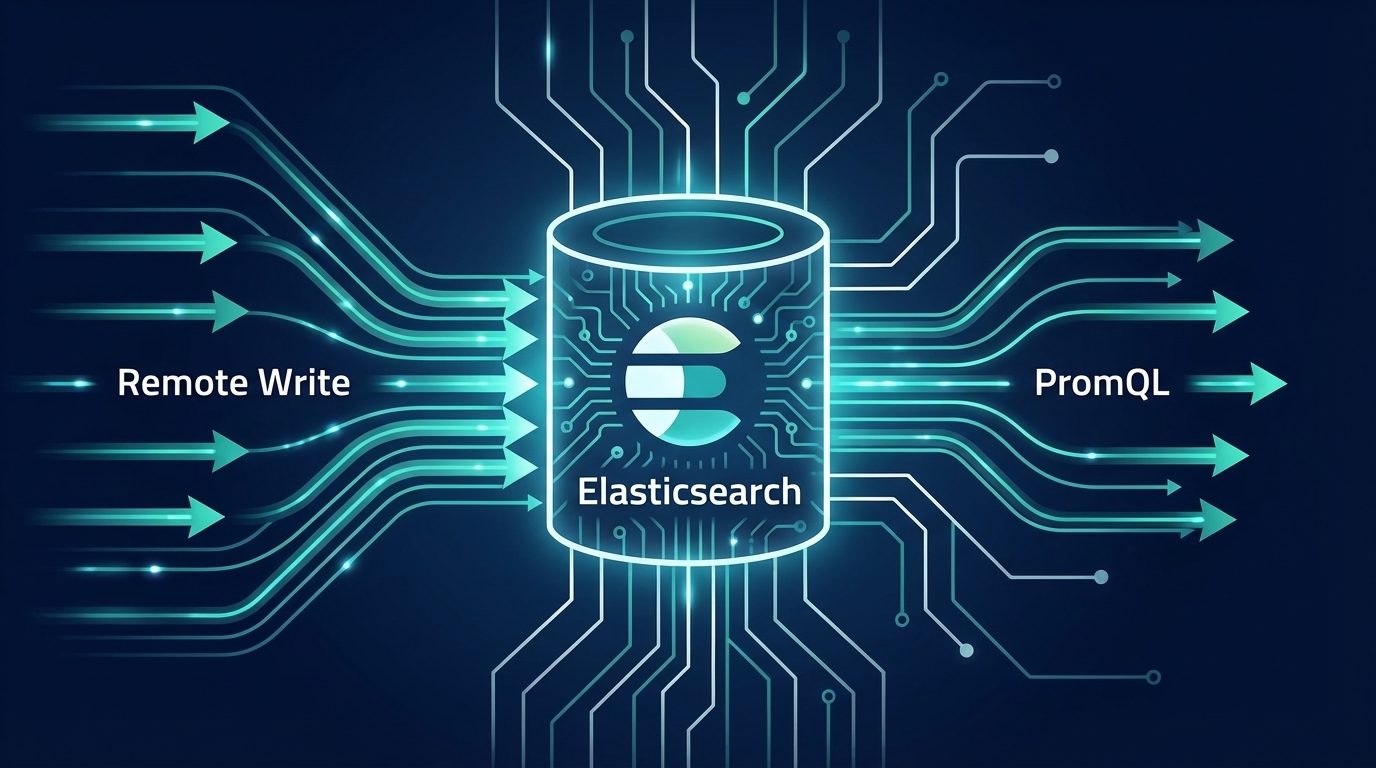
Bringing Fire to Elasticsearch: Adding Native Prometheus API Support
Query Elasticsearch directly from Prometheus-compatible clients via native PromQL, discovery, and metadata endpoints. Send data to Elasticsearch with Prometheus Remote Write.
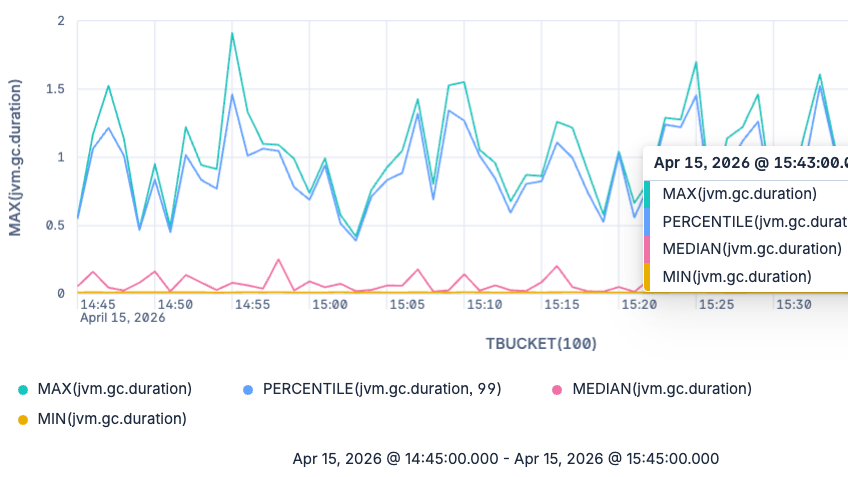
From averages to any percentile: Elasticsearch ships native exponential histogram support in ES|QL
Query any percentile at any time. Elasticsearch natively stores OTel exponential histograms and lets you analyze distributions in ES|QL without fixed buckets or lossy conversions.

30x faster than Prometheus: how we rebuilt Elasticsearch as a leading columnar metrics datastore
Elasticsearch now stores OTel metrics at 3.75 bytes per data point and queries them up to 30x faster than Prometheus. Here's how we rebuilt TSDS and ES|QL.