Category: Metrics
Articles tagged Metrics
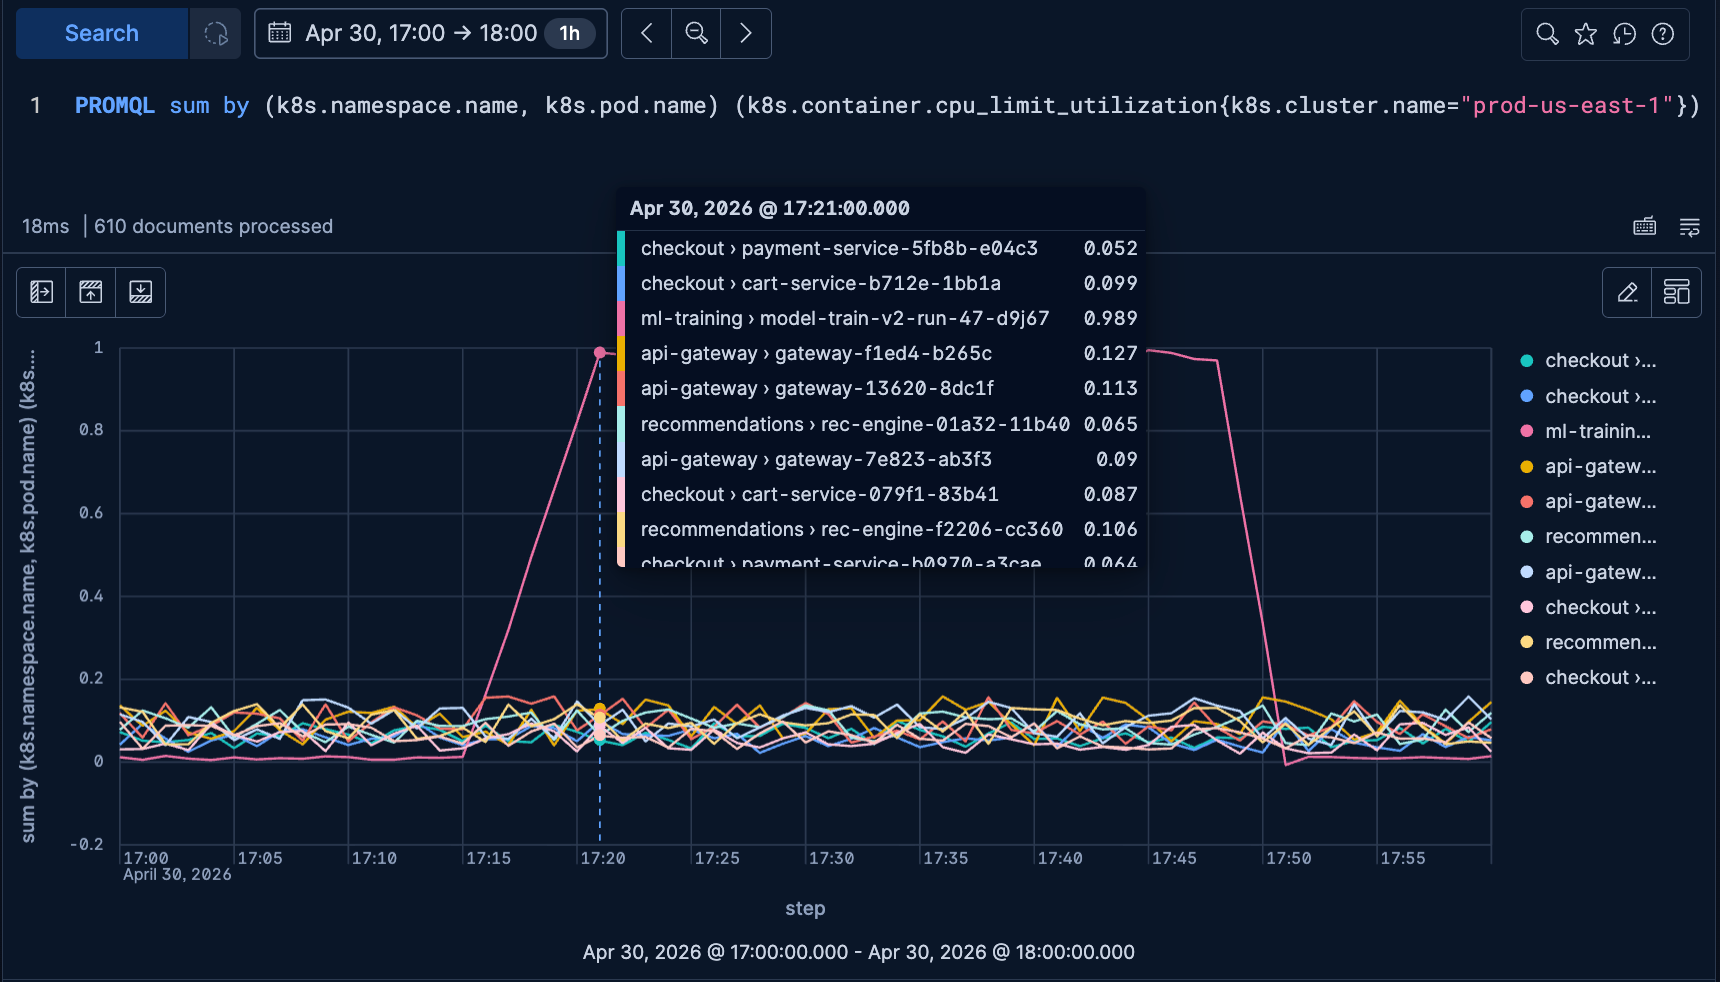
Investigate Kubernetes infrastructure issues with PromQL in Elasticsearch & Kibana
Walkthrough of a Kubernetes fleet-wide CPU investigation in Elastic Observability, from cluster to namespace to the noisy pod, using PromQL in Elasticsearch and Kibana.

Migrating Datadog and Grafana dashboards and alerts to Kibana with the Observability Migration Platform
Learn how to migrate supported Datadog and Grafana dashboards and alerts to Kibana with the Observability Migration Platform.
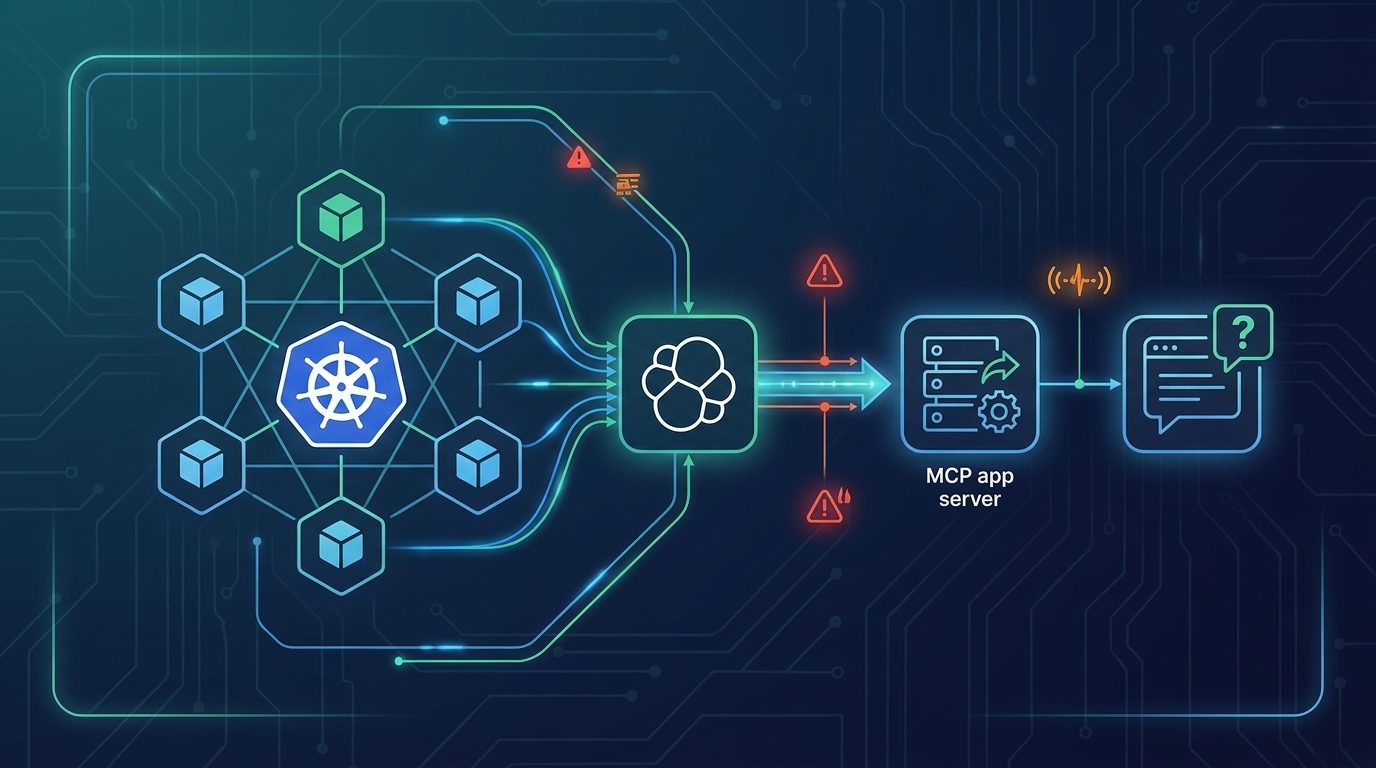
Agentic Powered Kubernetes Investigations with Elastic Observability and MCP
See how Elastic's Agentic powered Kubernetes observability uses MCP App, agent skills to let agents investigate clusters, detect anomalies, and automate root cause analysis.
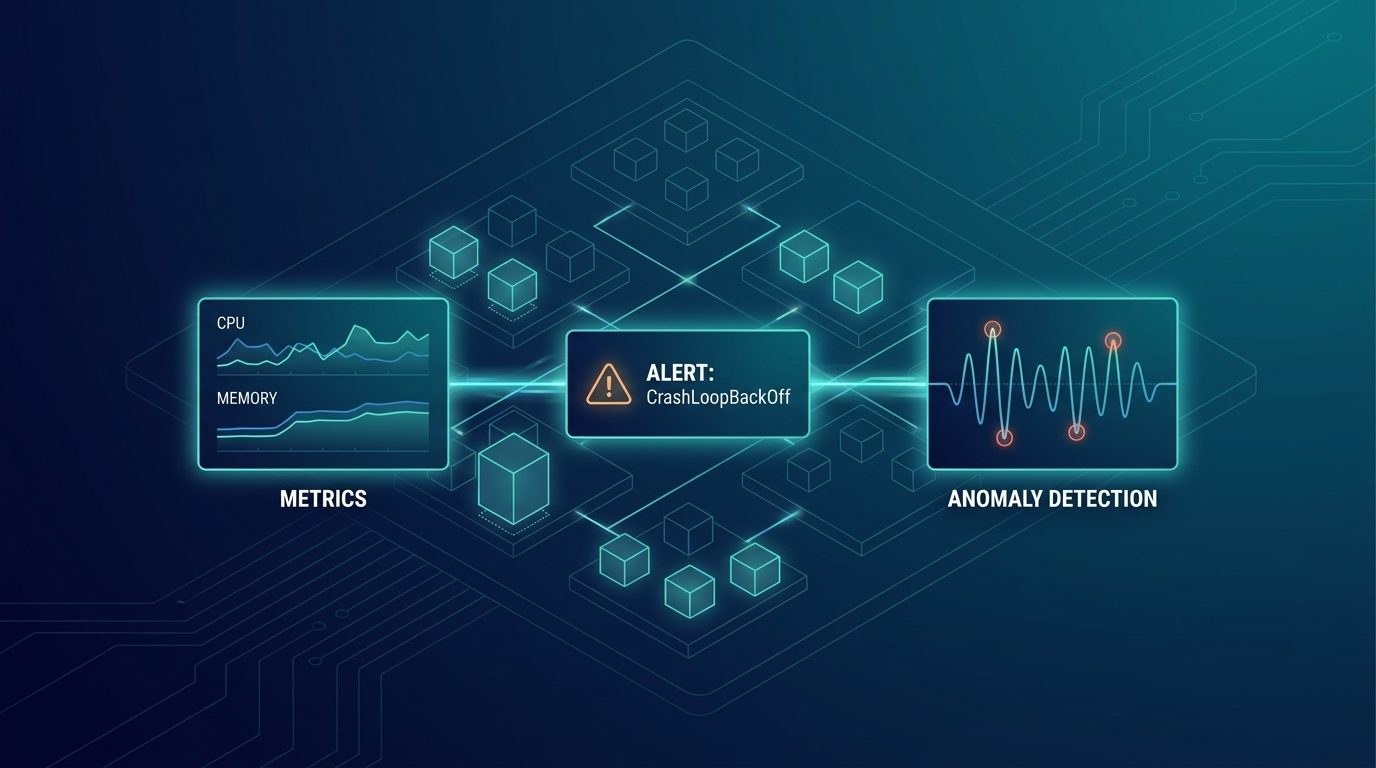
Kubernetes Observability from alert to root cause: Dashboards, Alerts, and Anomaly Detection with Elastic
Kubernetes observability with Elastic includes dashboards, alert rules, and ML anomaly detection for alerts with root-cause context.
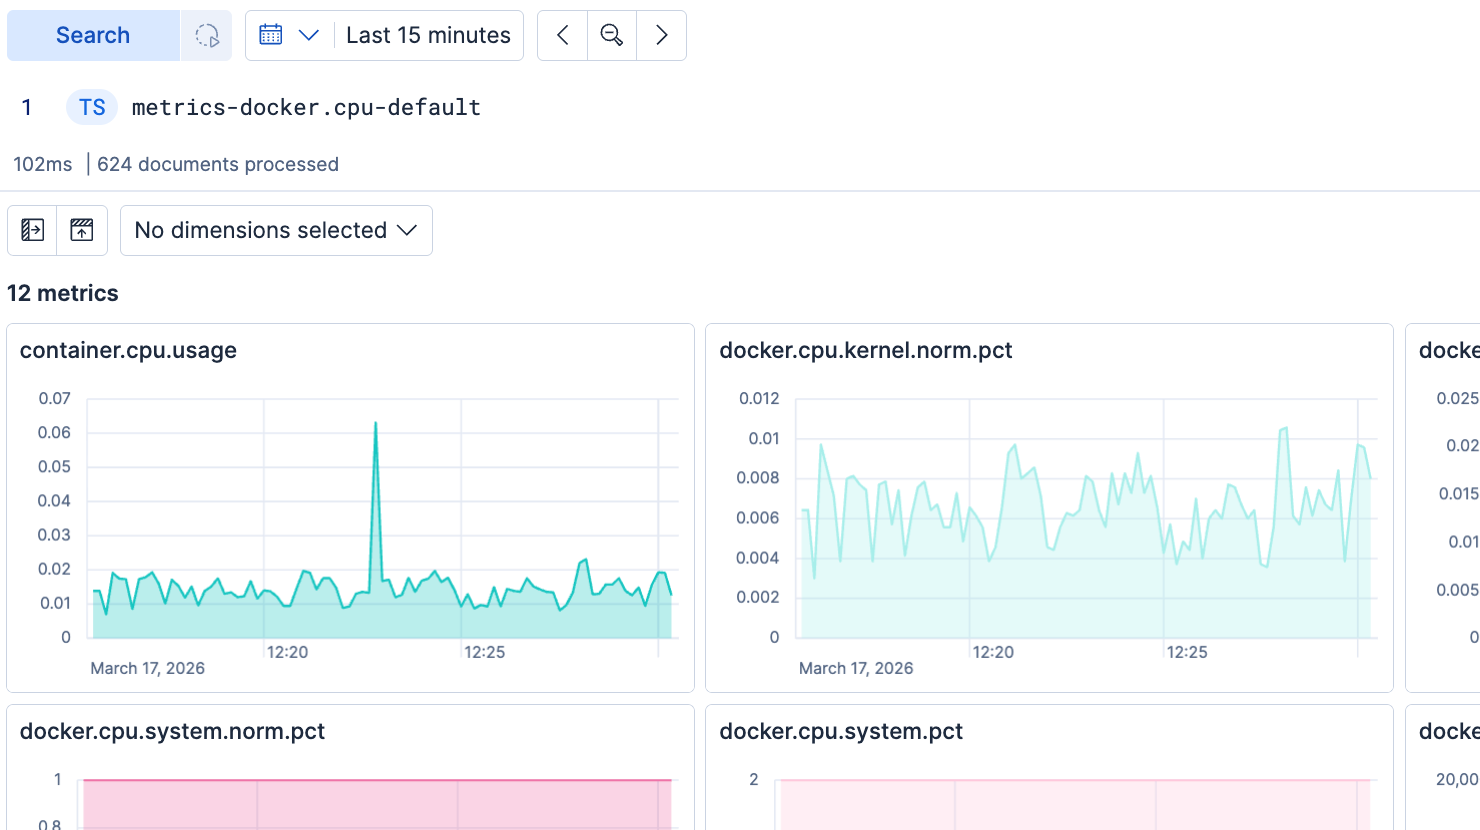
Exploring metrics from a new time series data stream in Discover
Discover helps you see and understand the metrics in a time series stream, with no manual work required. Once you see that your metrics data is flowing, you're ready to build dashboards, alerts, SLOs, and more.
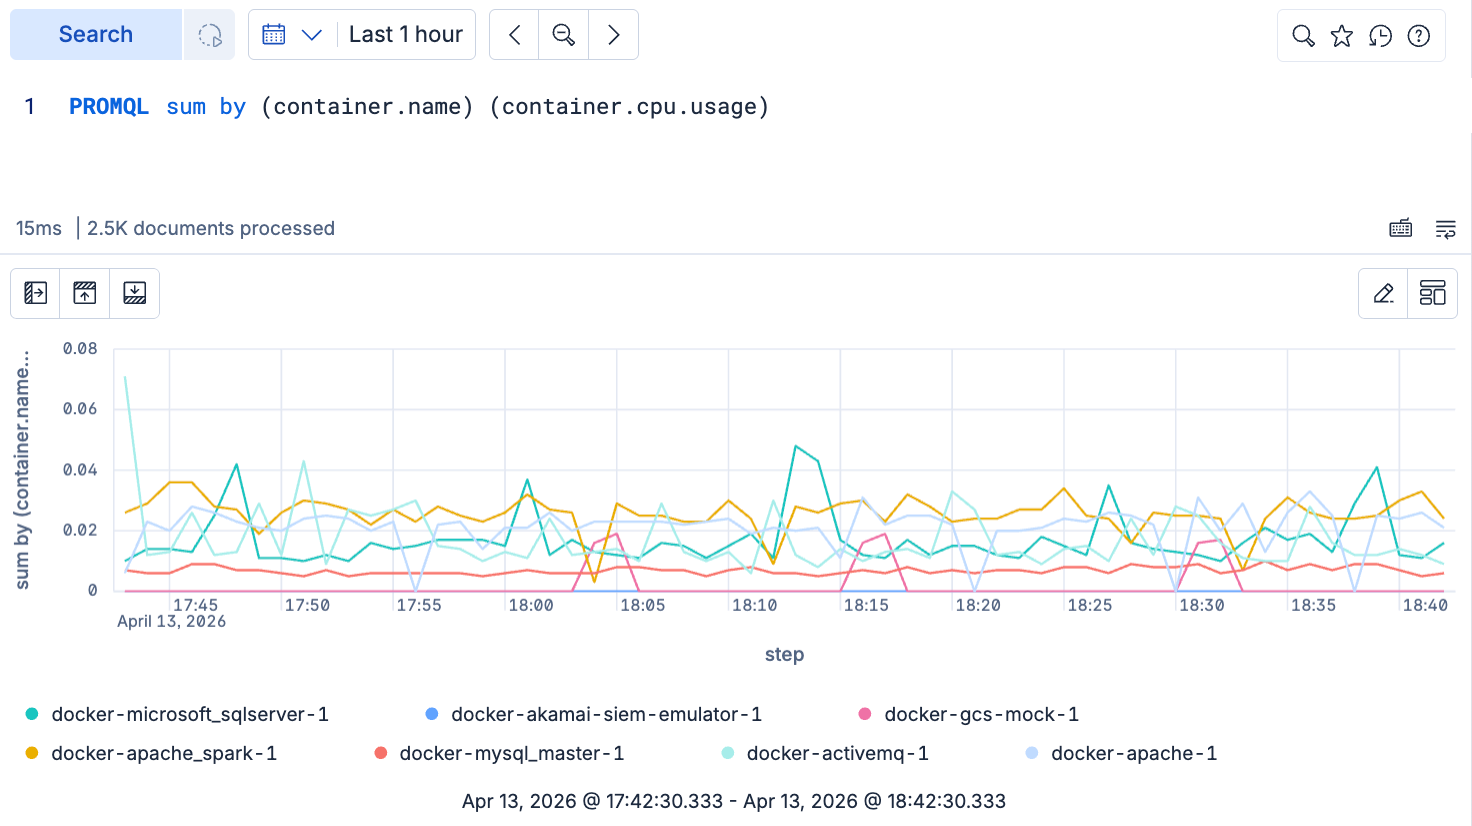
Your PromQL queries now run in Kibana!
With PromQL now natively supported in Kibana, write and execute PromQL for analyzing metrics in Discover, in Dashboards visualizations, in alerting rules and wherever else ES|QL is supported. PromQL is currently available in Tech Preview for common metrics analytics use cases.
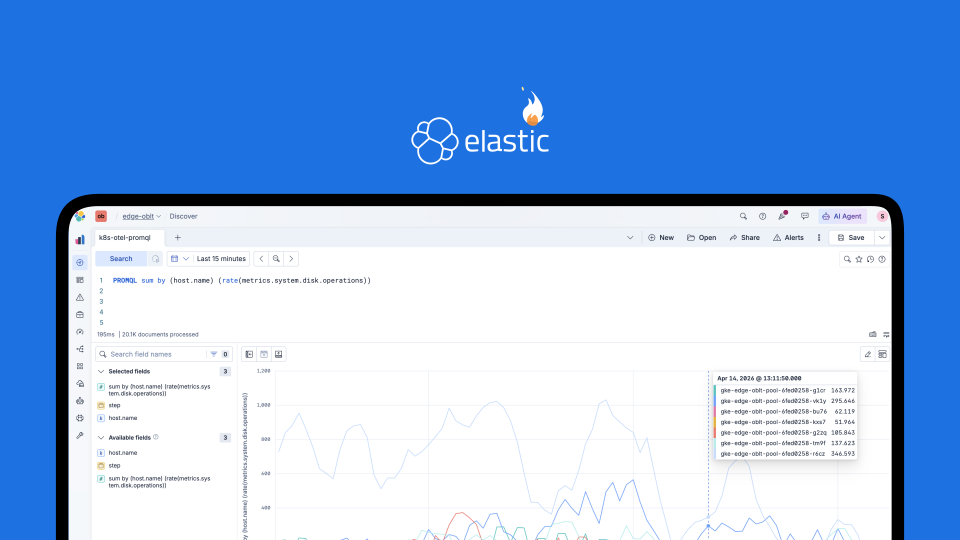
Query Prometheus Metrics in Elasticsearch with Native PromQL Support
Elasticsearch now supports PromQL natively as a first-class source command in ES|QL. Run familiar Prometheus queries on your time series data directly in Kibana.

Ship Prometheus Metrics to Elasticsearch with Remote Write
Elasticsearch natively supports Prometheus Remote Write. Add a single remote_write block to your Prometheus config and use Elasticsearch as Prometheus-compatible long-term storage.
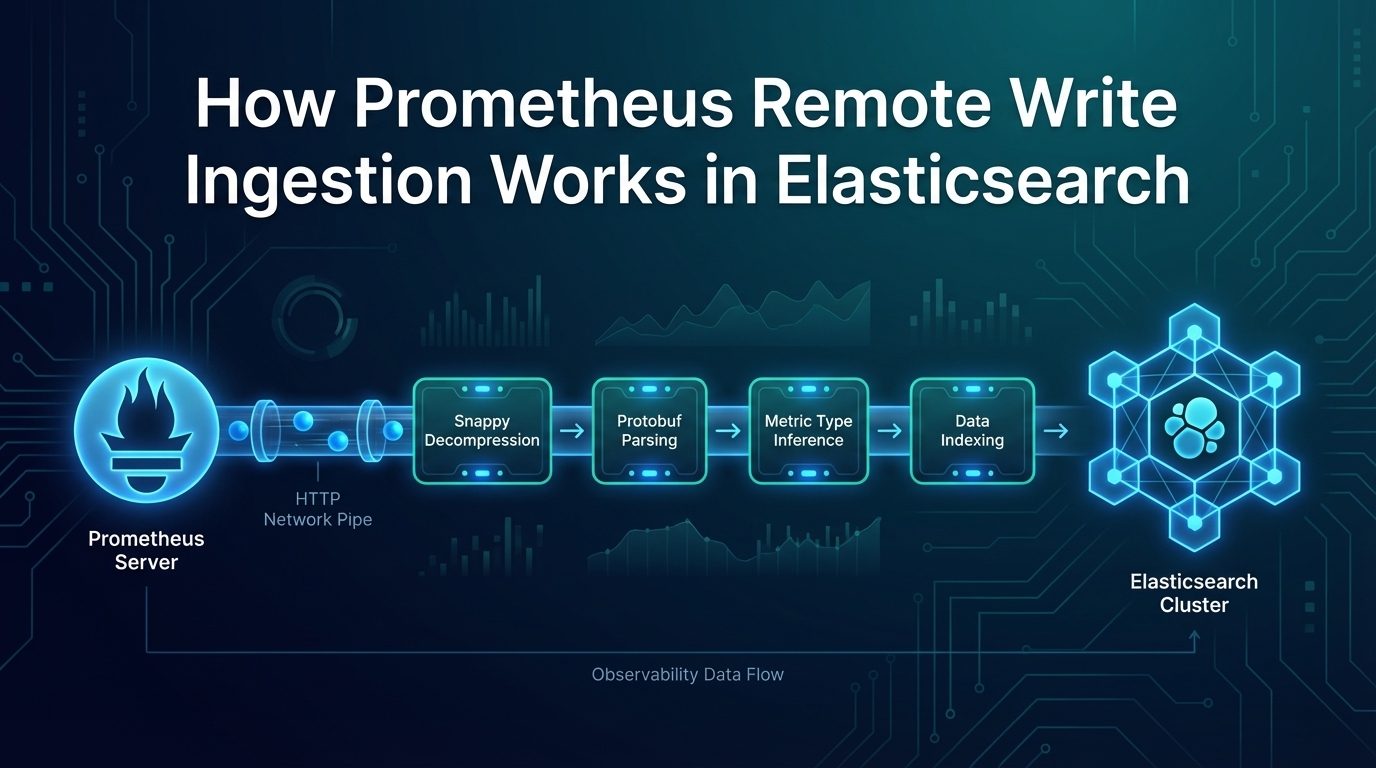
How Prometheus Remote Write Ingestion Works in Elasticsearch
A look under the hood at Elasticsearch's Prometheus Remote Write implementation: protobuf parsing, metric type inference, TSDS mapping, and data stream routing.

Visualizing OpenTelemetry Data in Elastic with OpenTelemetry Content Packages
Learn and explore how OpenTelemetry Content Packages in Elastic provide instant dashboards, alerts, and SLOs for your telemetry data.
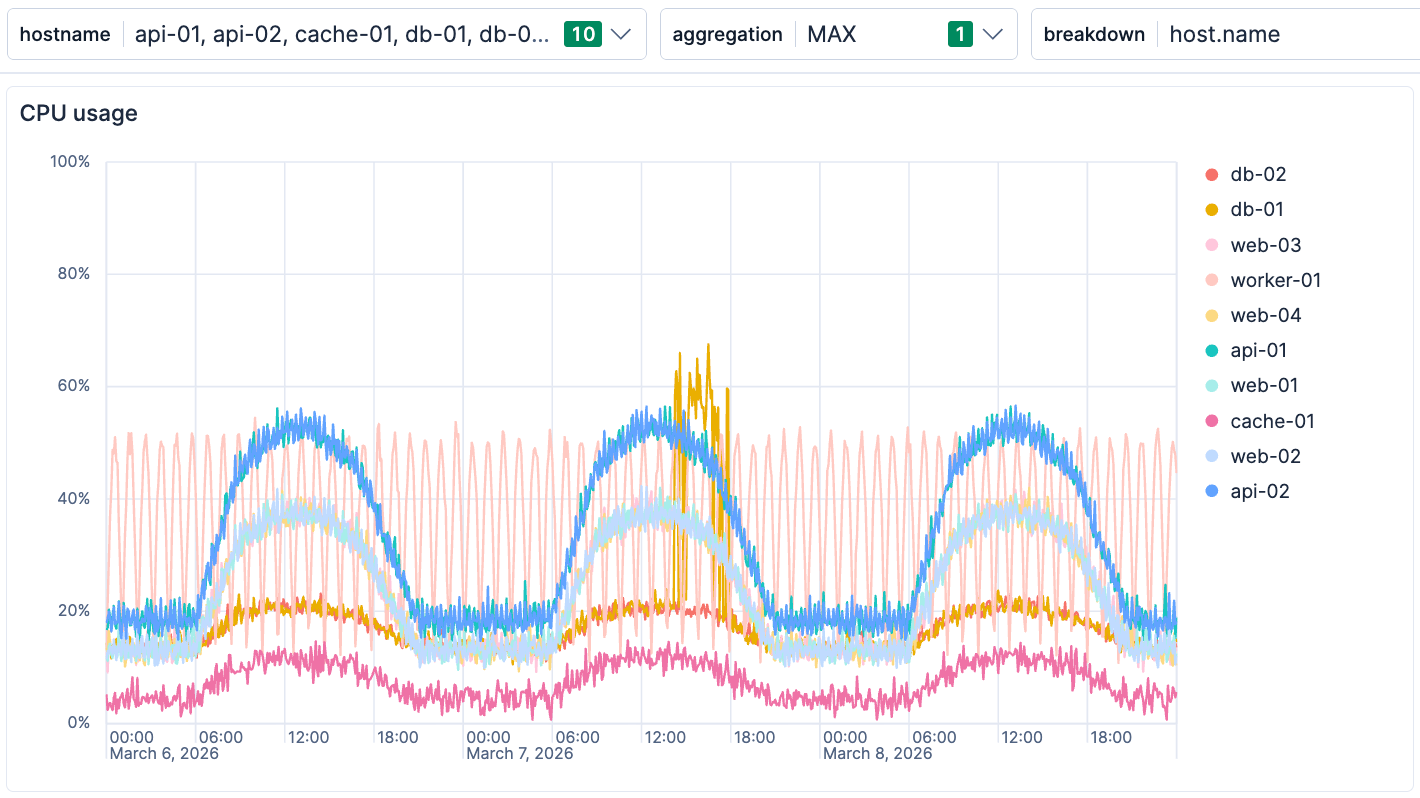
Turn Dashboards Into an Investigation Tool with ES|QL Variable Controls
Learn how to use ES|QL variables in Kibana to turn a dashboard into an investigation tool, applying value and structure controls to uncover problems.