View and manage alerts in Kibana
When the conditions of a rule are met, it creates an alert. If the rule has actions, they run at the defined frequency. For example, the rule can send email notifications for each alert at a custom interval. For an introduction to the concepts of rules, alerts, and actions, refer to Alerting.
Manage alerts from the following places:
- Rule details page: On a rule's details page, alerts the rule generates appear in the Alerts table. To access a rule's details page, find the Rules management page in the navigation menu or using the global search field (Alerts and Insights > Rules), then click its name.
- Alerts management page: Alerts generated by Stack Management rules appear on the Alerts management page. Accessing this page differs based on the navigation view that you're using:
- Classic navigation: Find the Alerts management page in the navigation menu or use the global search field (Stack Management > Alerts).
- Solution navigation: Use the global search field (Alerts and Insights > Alerts).

You must have the appropriate Kibana alerting features and index privileges to view alerts. Refer to Alerting security requirements.
This functionality is in technical preview and may be changed or removed in a future release. Elastic will work to fix any issues, but features in technical preview are not subject to the support SLA of official GA features.
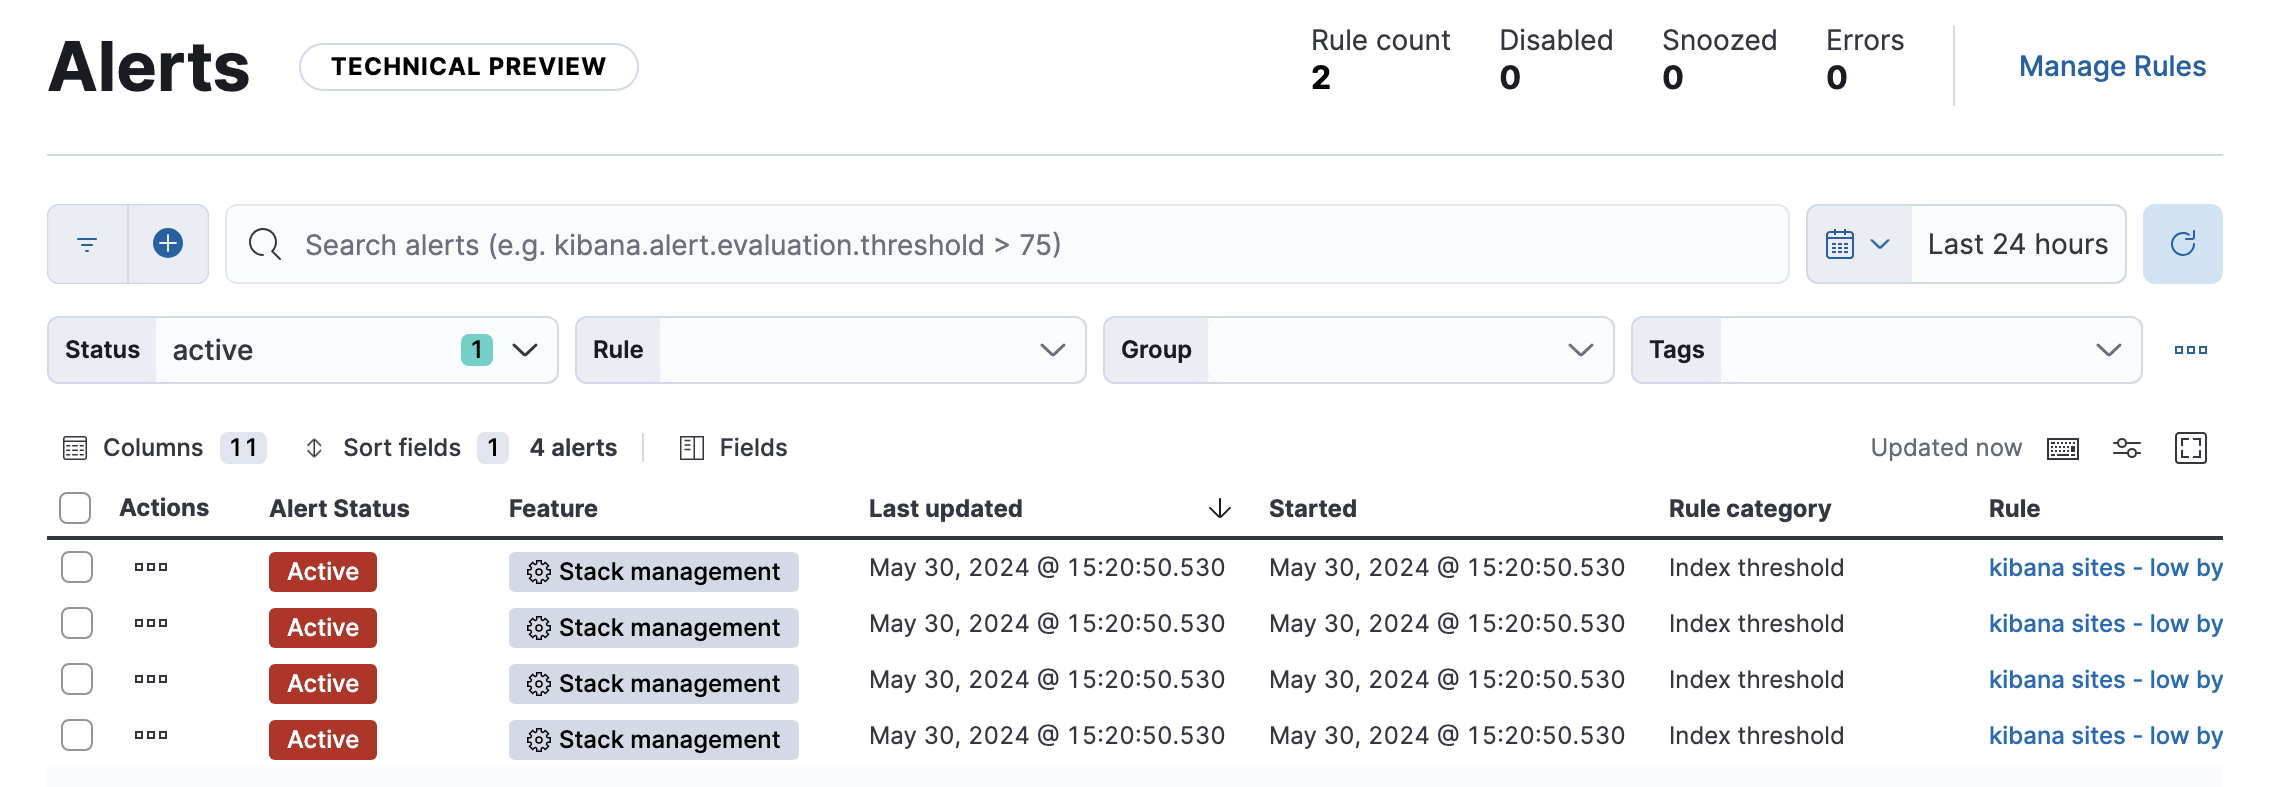
In Stack Management > Alerts, you can filter the list (for example, by alert status or rule type) and customize the filter controls. To search for specific alerts, use the KQL bar to create structured queries using Kibana Query Language.
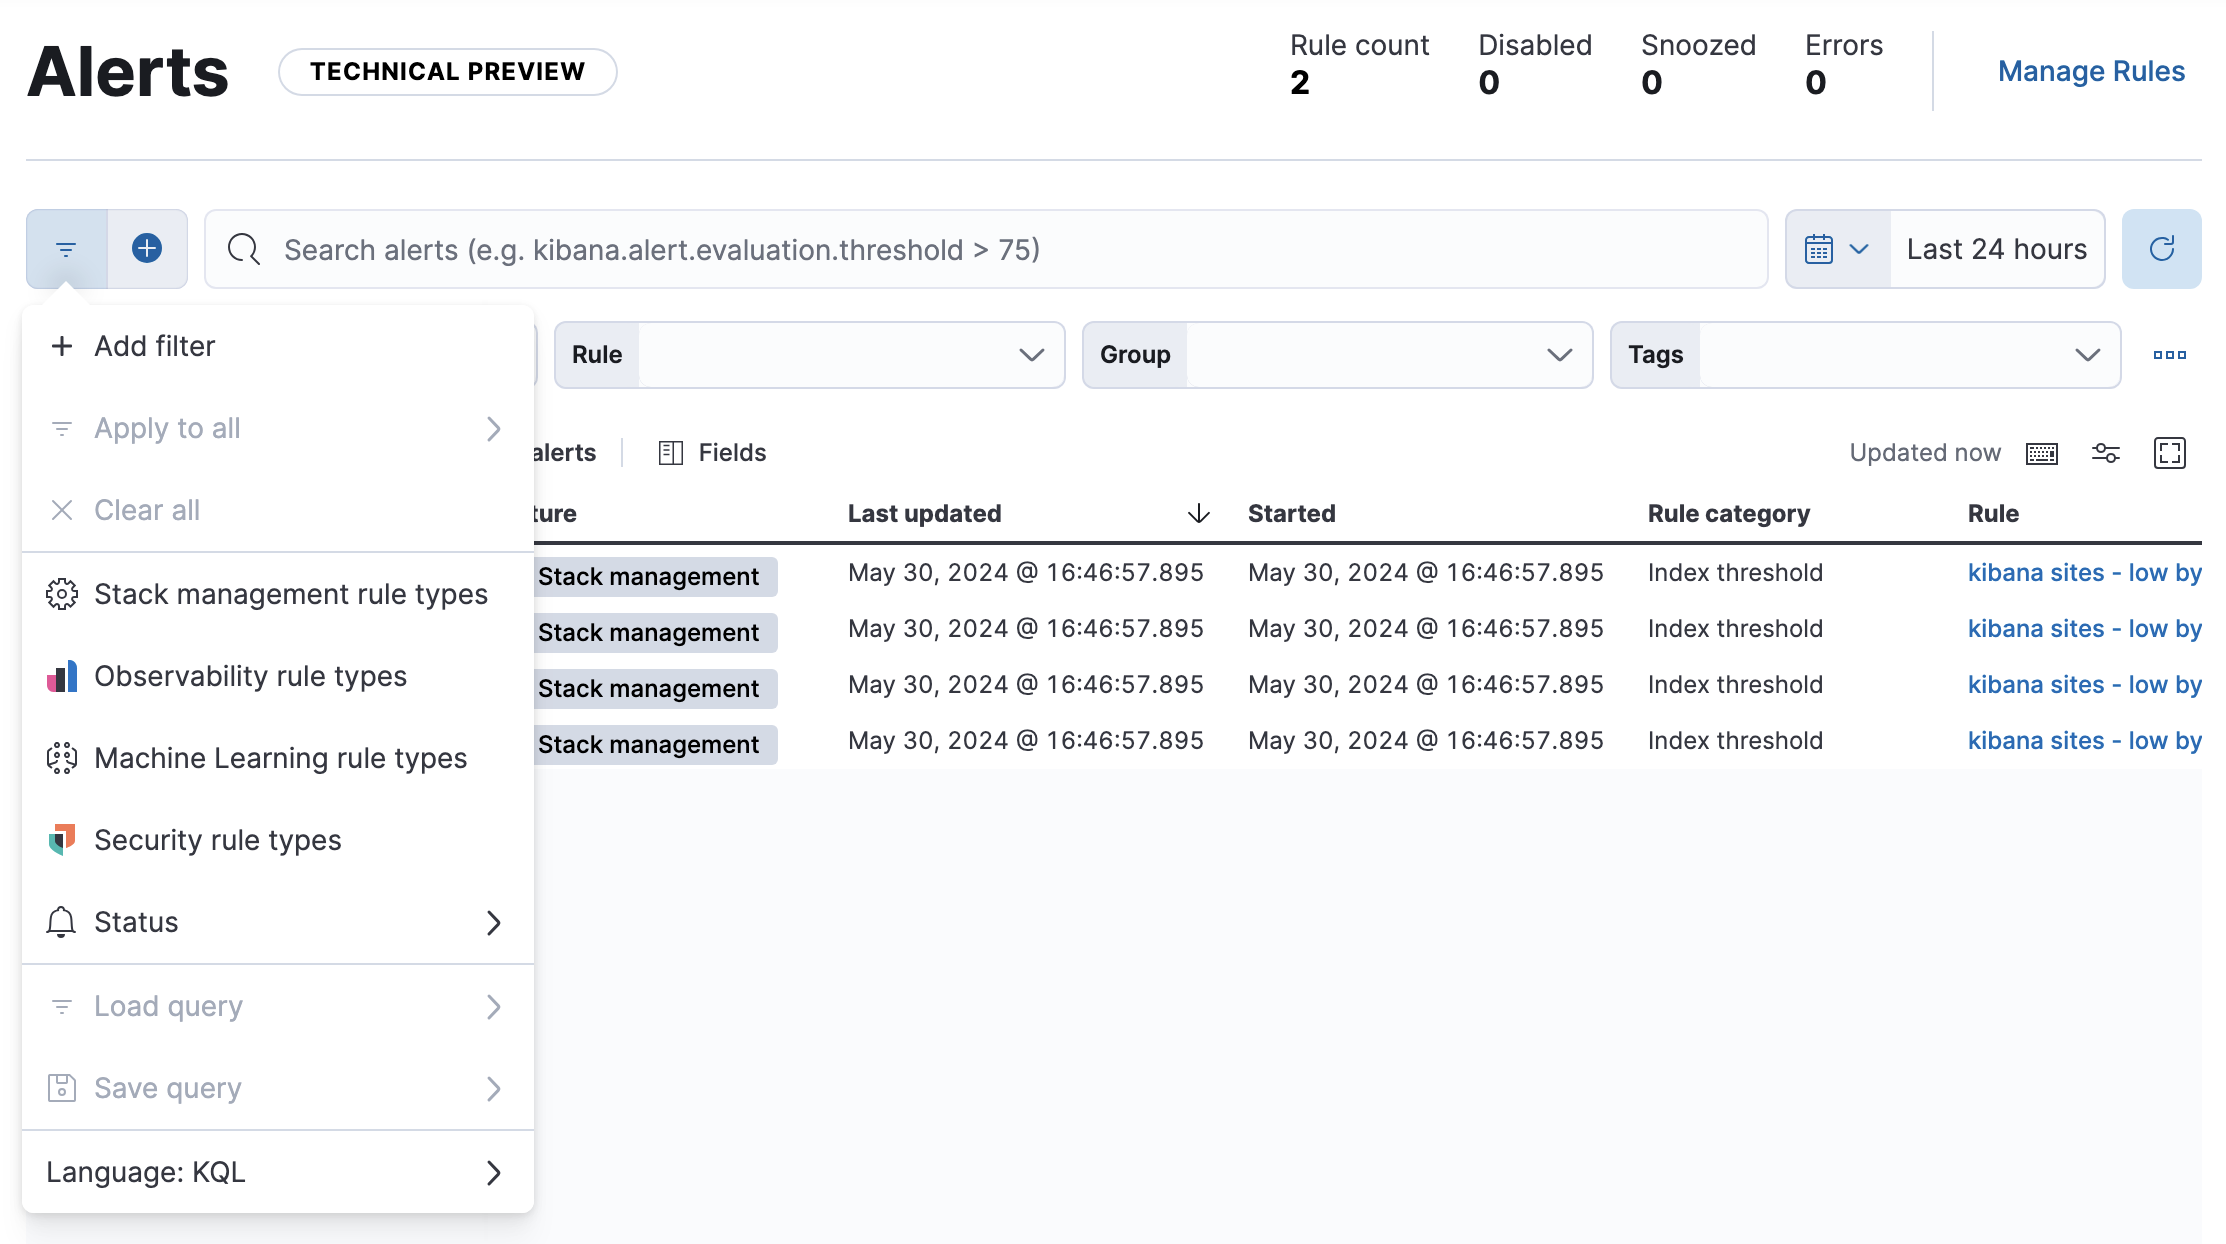
By default, the list contains all the alerts that you have authority to view in the selected time period except those associated with Security rules. To view alerts for Security rules, click the query menu and select Security rule types:

Alternatively, view those alerts in the Elastic Security app.
To get more information about a specific alert, click the action menu icon and select View alert details in either Stack Management > Alerts or Rules. There you’ll see the current status of the alert, its duration, and when it was last updated. To help you determine what caused the alert, there is information such as the expected and actual threshold values and a summarized reason for the alert.
If an alert is affected by a maintenance window, the alert details include its identifier. For more information about their impact on alert notifications, refer to Maintenance windows.
There are four common alert statuses:
active- The conditions for the rule are met. If the rule has actions, Kibana generates notifications based on the actions' notification settings.
flapping- The alert switched repeatedly between active and recovered states. If actions are configured to run when its status changes, they are suppressed. Refer to Alert flapping to learn more about configuring alert flapping for rules.
recovered-
The conditions for the rule are no longer met. If the rule has recovery actions, Kibana generates notifications based on the actions' notification settings. Recovery actions only run if the rule's conditions aren't met during the current rule execution, but were in the previous one.
An active alert changes to recovered if the conditions for the rule that generated it are no longer met.
A flapping alert changes to recovered when the rule's conditions are unmet for a specific number of consecutive runs. This number is determined by the Alert status change threshold setting, which you can configure under the Alert flapping detection settings.
For example, if the threshold requires an alert to change status at least 6 times in the last 10 runs to be considered flapping, then to recover, the rule's conditions must remain unmet for 6 consecutive runs. If the rule's conditions are met at any point during this recovery period, the count of consecutive unmet runs will reset, requiring the alert to remain unmet for an additional 6 consecutive runs to finally be reported as recovered.
Once a flapping alert is recovered, it cannot be changed to flapping again. Only new alerts with repeated status changes are candidates for the flapping status.
untracked- The rule is disabled, or you’ve marked the alert as untracked. To mark the alert as untracked, go to the Alerts table, click the action menu icon and select Mark as untracked. When an alert is marked as untracked, actions are no longer generated and the alert's status can no longer be changed. You can choose to move active alerts to this state when you disable or delete rules.
If an alert is active or flapping, you can mute it to temporarily suppress future actions. While muted, the alert's status will continue to update but rule actions won't run. All future alerts with the same alert ID will also be muted. You can mute alerts in the following ways:
You can mute individual alerts or multiple ones:
- Mute individual alerts: Find the Alerts management page using the navigation menu or the global search field, open the action menu ( ) for the appropriate alert, then select Mute.
- Bulk-mute alerts: Select one or more alerts from the Alerts management page, click Selected x alerts at the upper-left above the table, then select Mute selected. Select the Unmute selected option to unmute alerts. Muted alerts display the icon in the Alerts table.
You can only mute individual alerts. To mute an alert, find the Alerts management page using the navigation menu or the global search field, click the action menu icon for the appropriate alert, then select Mute.
To permanently suppress an alert's actions, open the actions menu for the appropriate alert, then select Mark as untracked. In this case, the alert's status is no longer updated and actions are no longer run. These changes are only applied to the alert that you untracked and cannot be reverted. Future alerts with the same alert ID are unaffected.
To affect the behavior of the rule rather than individual alerts, check out Snooze and disable rules.
Use alert tags to organize related alerts into categories that you can filter and group. For example, use the Production alert tag to label a group of alerts as notifications from your production environment. Then, to find alerts with the Production tag, enter the kibana.alert.workflow_tags : "Production" query into the Alert's table KQL bar.
To display alert tags in the Alerts table, click Fields, then add the kibana.alert.workflow_tags field.
To apply or remove alert tags on individual alerts:
Go to the Alerts table, click the More actions menu in an alert’s row, then select Edit tags.
In the flyout, do one of the following:
Apply a new tag: Enter a new tag into the search bar, then select the Add tag name as a tag or click enter on your keyboard to apply your changes.
Remove existing tags: Click the tag that you want to remove. To remove all tags from the alert, click Select none.
ImportantRemoving tags from an alert permanently deletes them.
Click Save selection to apply your changes to the alert.
To apply or remove alert tags on multiple alerts, select the alerts you want to change, then click Selected x alerts at the upper-left above the table. Click Edit alert tags, select or unselect tags, then click Save selection.
Manage the size of alert indices in your space by clearing out alerts that are older or infrequently accessed. You can do this by running an alert cleanup task, which deletes alerts according to the criteria that you define.
The alert cleanup task permanently deletes alerts in your .alert-* indices. Make sure to take regular snapshots of your cluster to back up your alert data in case you ever need to restore it.
- To run the alert cleanup task, your role must have
Allprivileges for the Alert deletion feature. When setting your role’s Kibana privileges, go to Management > Rule Settings, enable Customize sub-feature privileges, then selectAllfor the Alert deletion feature. - Alerts in your space must be older than a day. The minimum threshold for the alert cleanup task is one day.
Remove old or rarely-accessed alerts in your space by running an alert cleanup task, which deletes alerts according to the criteria that you define. Alerts that are attached to cases are not deleted.
Open the Rules page by going to Stack Management > Alerts and Insights > Rules in the main menu or using the global search field.
Click Settings to open the settings for all rules in the space.
In the Clean up alert history section, click Clean up.
Define criteria for the alert cleanup task. You can choose to delete alerts that are active or inactive and meet a certain age.
TipAt the bottom of the modal, you can find a preview of the number of alerts that will be deleted according to the criteria that you define.
Active alerts: Choose to delete alerts that haven't had their status changed since they were initially generated and are older than the threshold that you specify.
For example, if you specify two years as the threshold, the cleanup task will delete alerts that were generated more than two years ago and have never had their status changed.
Inactive alerts: Choose to delete alerts that have had their statuses changed since they were initially created and are older than the threshold that you specify. Inactive alerts have had their status changed to recovered, closed, acknowledged, or untracked.
For example, if you specify two years, the cleanup task will delete alerts that have had their status changed to recovered, closed, acknowledged, or untracked more than two years ago.
Enter Delete to verify that you want to run the alert cleanup task, then click Run cleanup task.
A message confirming that the alert cleanup task has started running appears. This information is also provided at the top of the alert cleanup modal in the Last cleanup task: details field. Note the field doesn't display in the modal until an alert cleanup task is run.