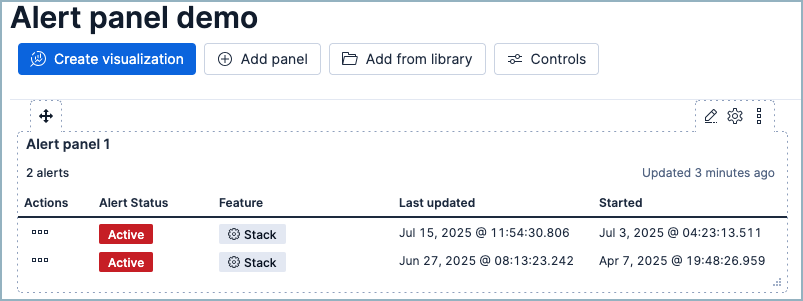
Alert panels
To view alerts in a dashboard, add Alerts panels that show selected alerts. Each panel can display either Observability or Security alerts with the rule tags and rule types that you select.
- From your dashboard, select Add panel.
- In the Add panel flyout, select Alerts. The configuration flyout appears.
- (Elastic Stack deployments only) Under Solution, select either Observability or Security to specify the type of alerts you want to display.
- Under Filter by select either Rule tags or Rule types.
- (Optional) To use both types of filters, first define one filter, then use the boolean + OR or + AND options that appear to define the second filter.
- Click Save. Your panel appears on the dashboard.

There are several actions you can take on alerts in the alerts panel. Under Actions, click the three dots next to an alert to open a menu with the following options:
- View rule details: Open the details page for the rule that created the alert.
- View alert details: Open the alert details flyout.
- (Active rules only) Mark as untracked: Change the alert's status from Active to Untracked.
- (Active rules only) Mute: Mute alerts from the associated rule.
To edit an existing alerts panel, hover over the panel. Three buttons appear:
- Edit : Update which alerts appear in the panel.
- Settings : Update the panel's title or description, or add a custom time range.
- More actions : Duplicate, maximize, copy to another dashboard, or remove the panel.