Blogs
Hands-on, insight-driven content about observing your production and development environments using Elastic Observability.
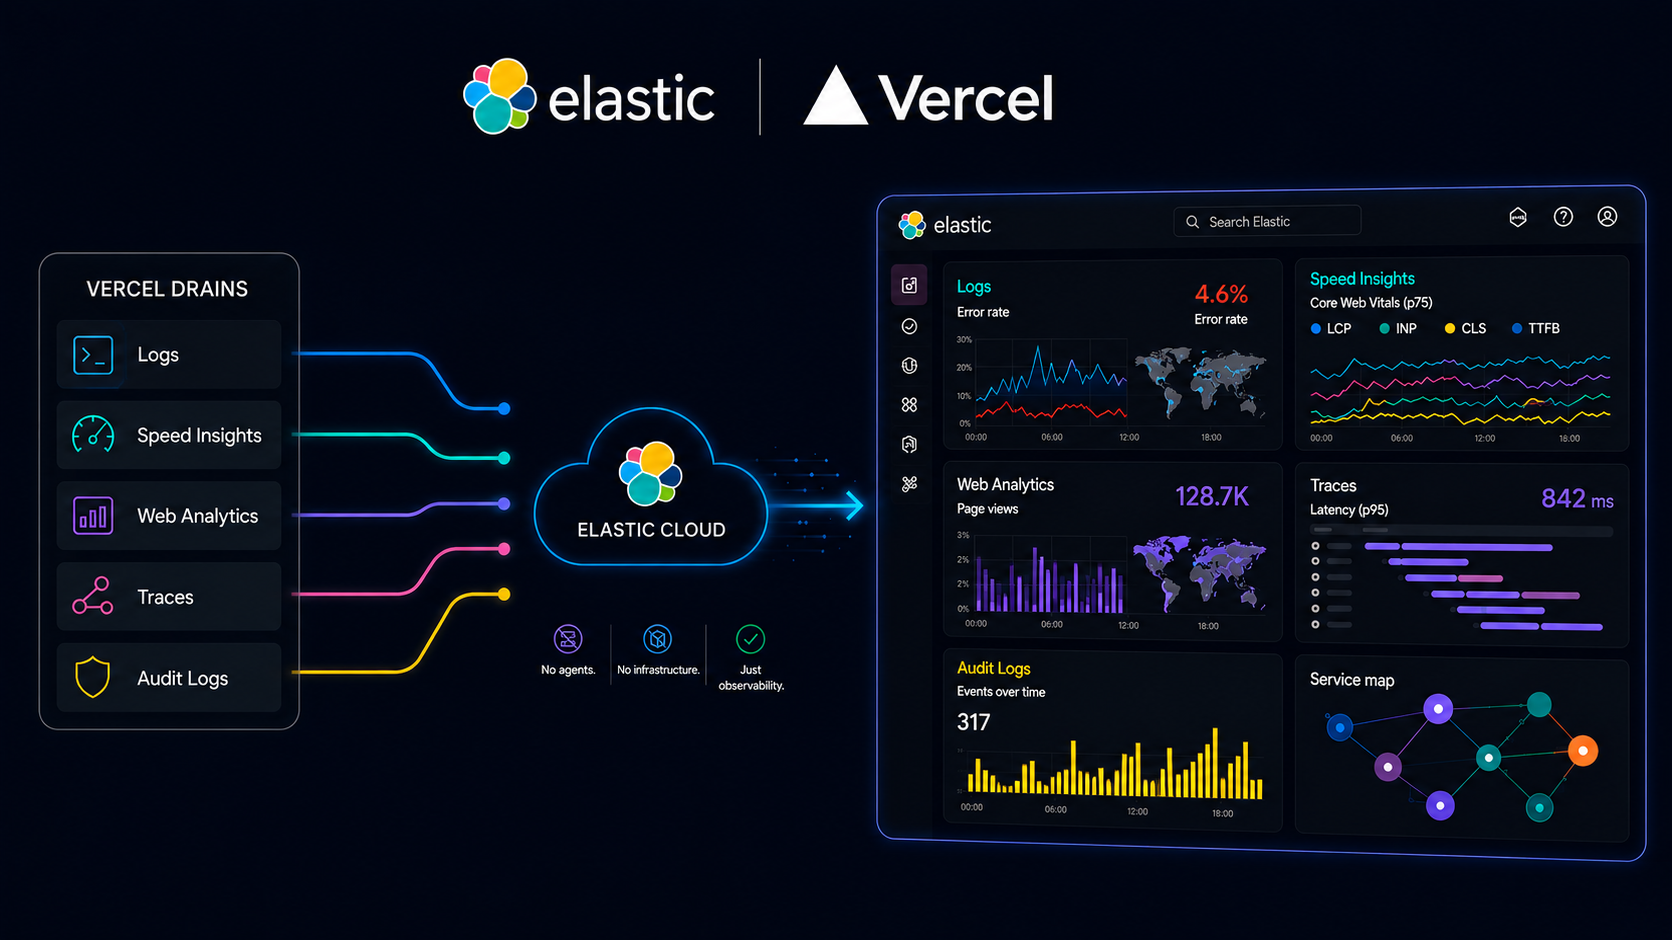
Drain Vercel into Elastic: serverless observability with nothing to install
A drain and an API key put Vercel logs, traces, and Speed Insights into Elastic Cloud, where you can follow a slow request from the edge to the Lambda function behind it.
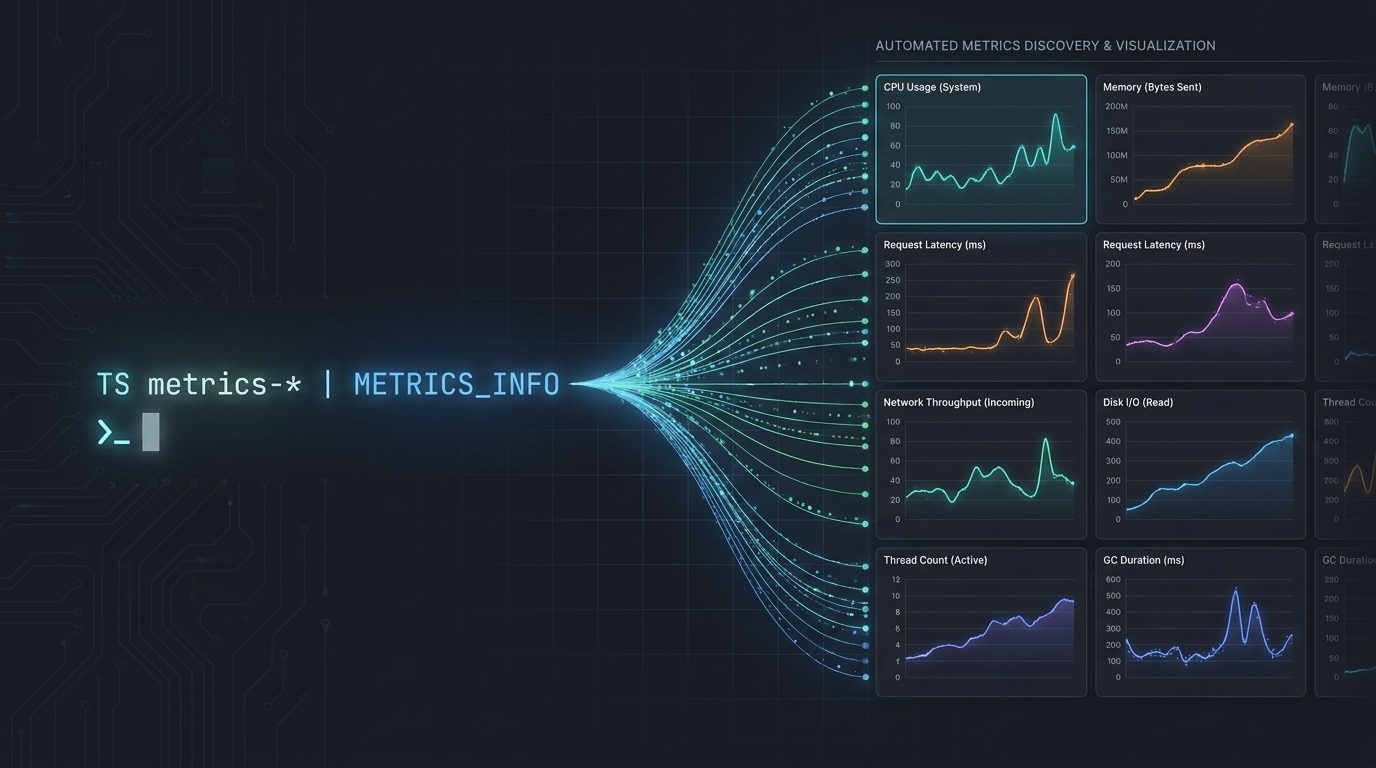
How one ES|QL query builds a metric chart for every metric in Elasticsearch
METRICS_INFO reports what metrics are in your data and how to aggregate each one, so Kibana Discover can chart counters, gauges and histograms correctly with no configuration and no field names to look up.
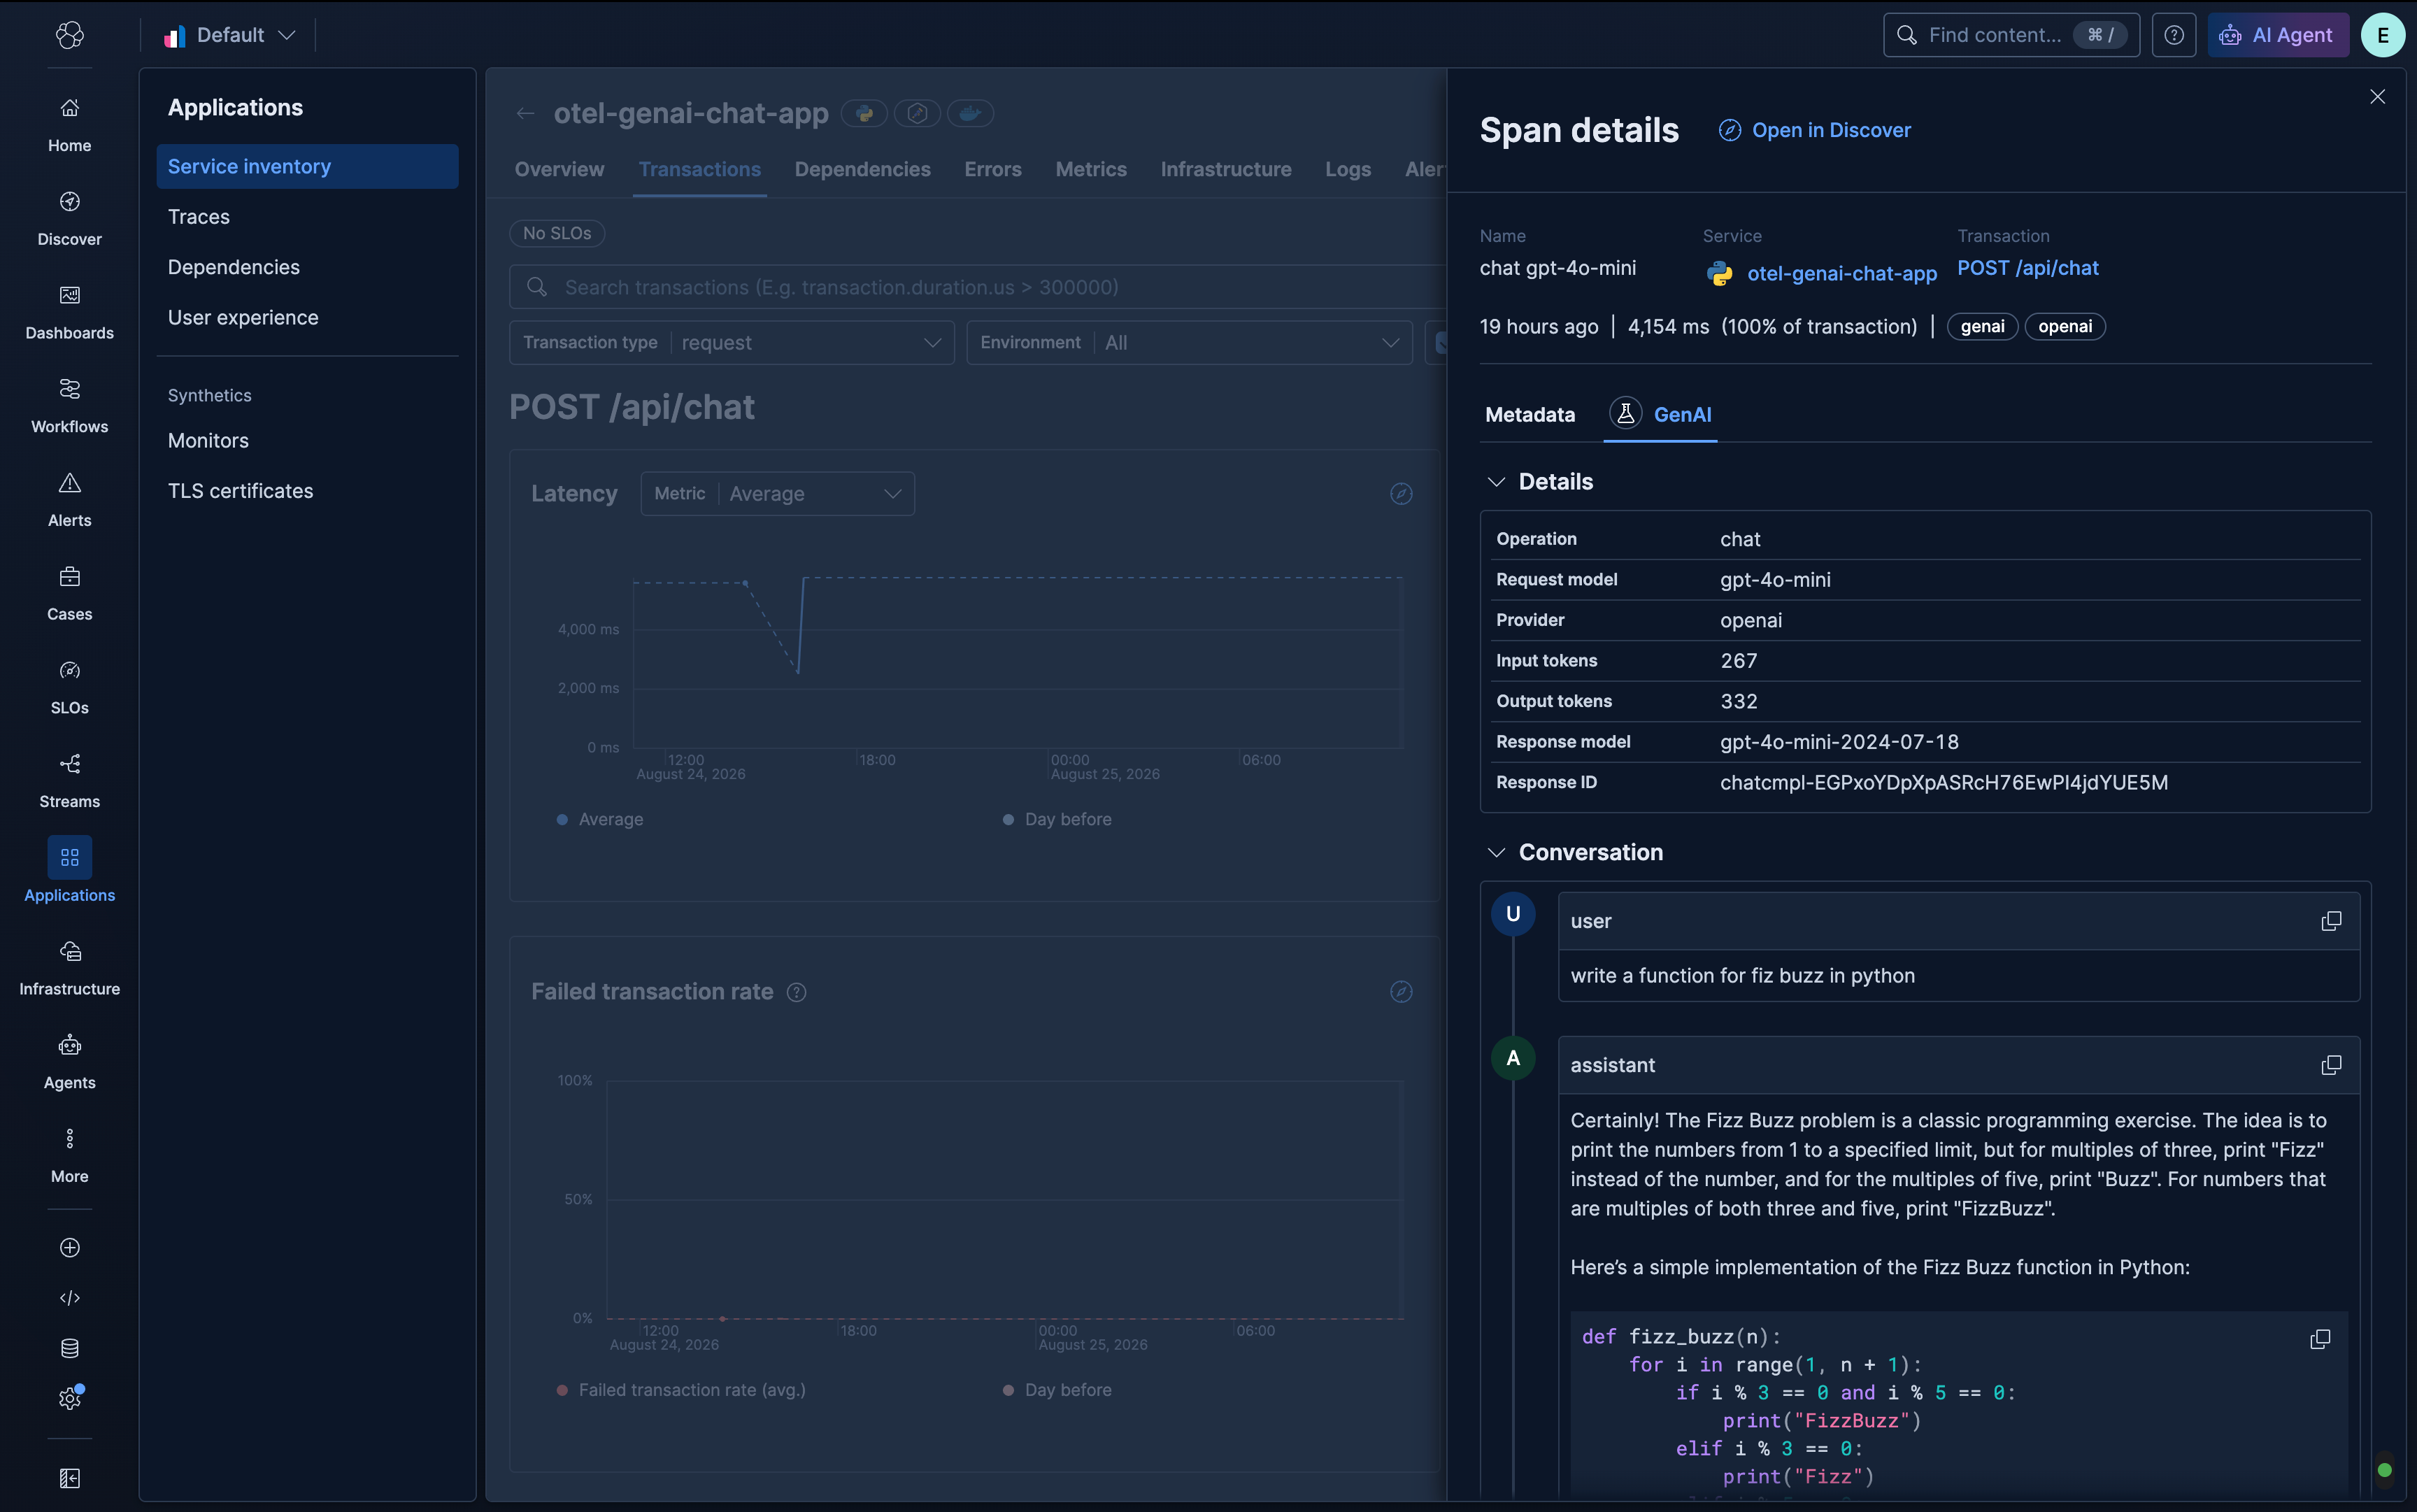
LLM tracing in Elastic APM: prompts, responses, and token counts in the span view
In a twenty-call agentic trace, you can see which span is using the most tokens and read the prompt that caused it. Both live in Elastic APM, so there is no second tool to run.
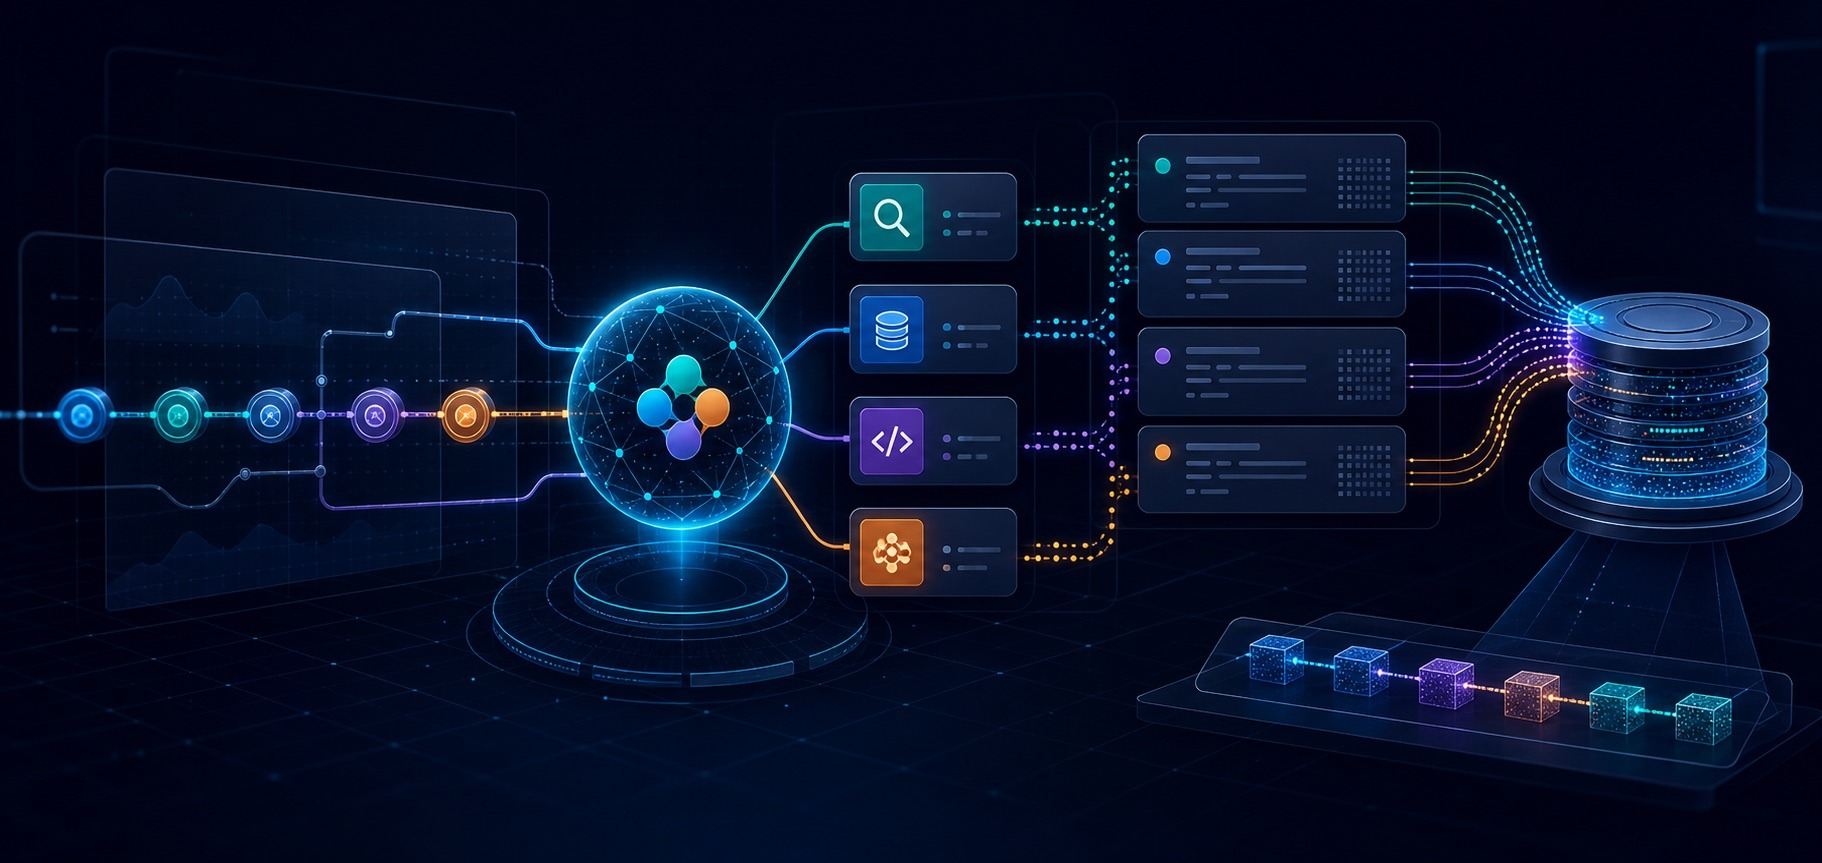
Your AI agent needs an alibi: Observability and audit trails for Agent Builder in Elastic
Elastic 9.5 traces every Agent Builder run as OpenTelemetry spans in your own cluster, so tool calls and token counts are queryable with ES|QL. One workflow step adds the approval record, in a data stream the pipeline cannot rewrite.
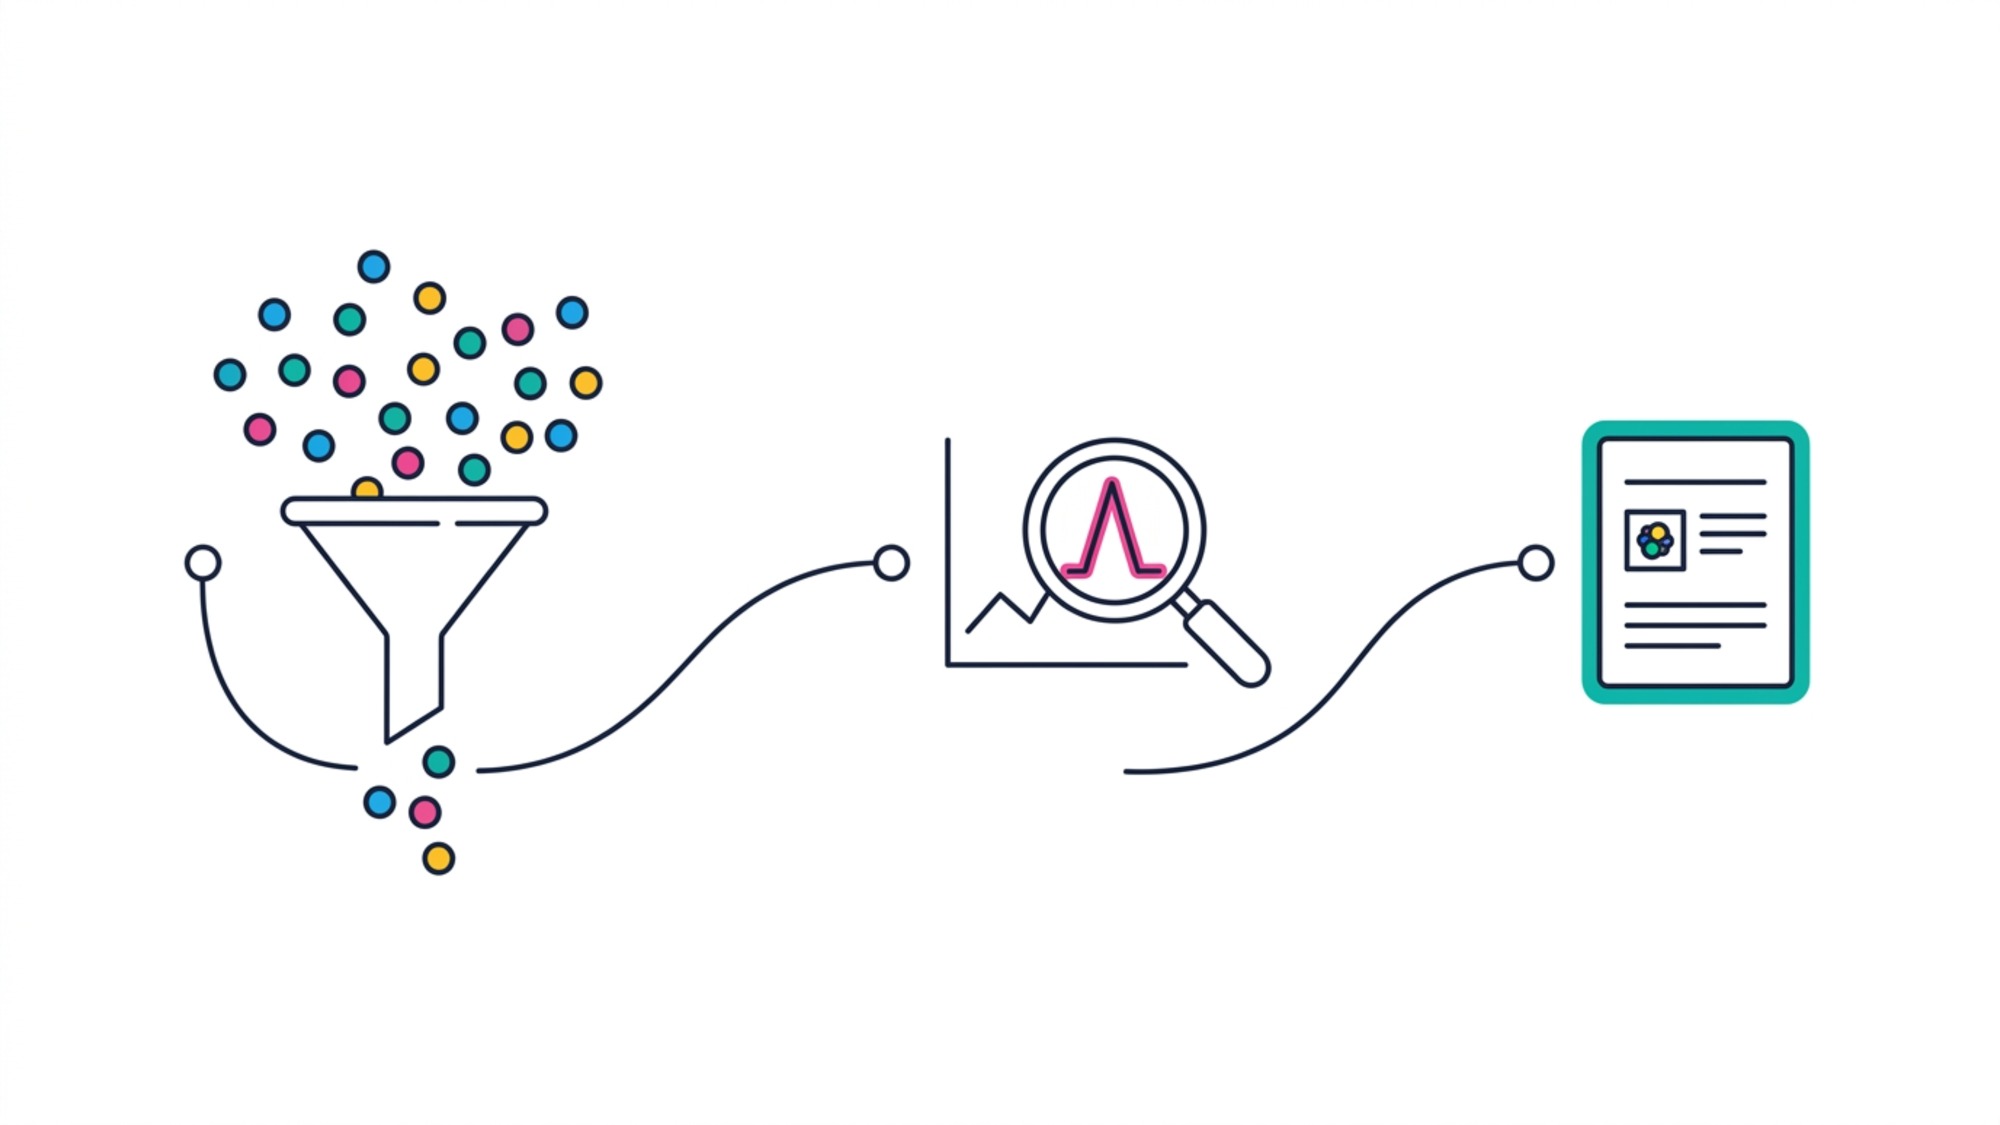
From a 582ms latency spike to the team that owns it, using Kibana Discover
Getting there takes a data view, some filter pills, a KQL query and a switch to Lucene query syntax, but the part that actually names the team is one ES|QL LOOKUP JOIN against a service catalog index.
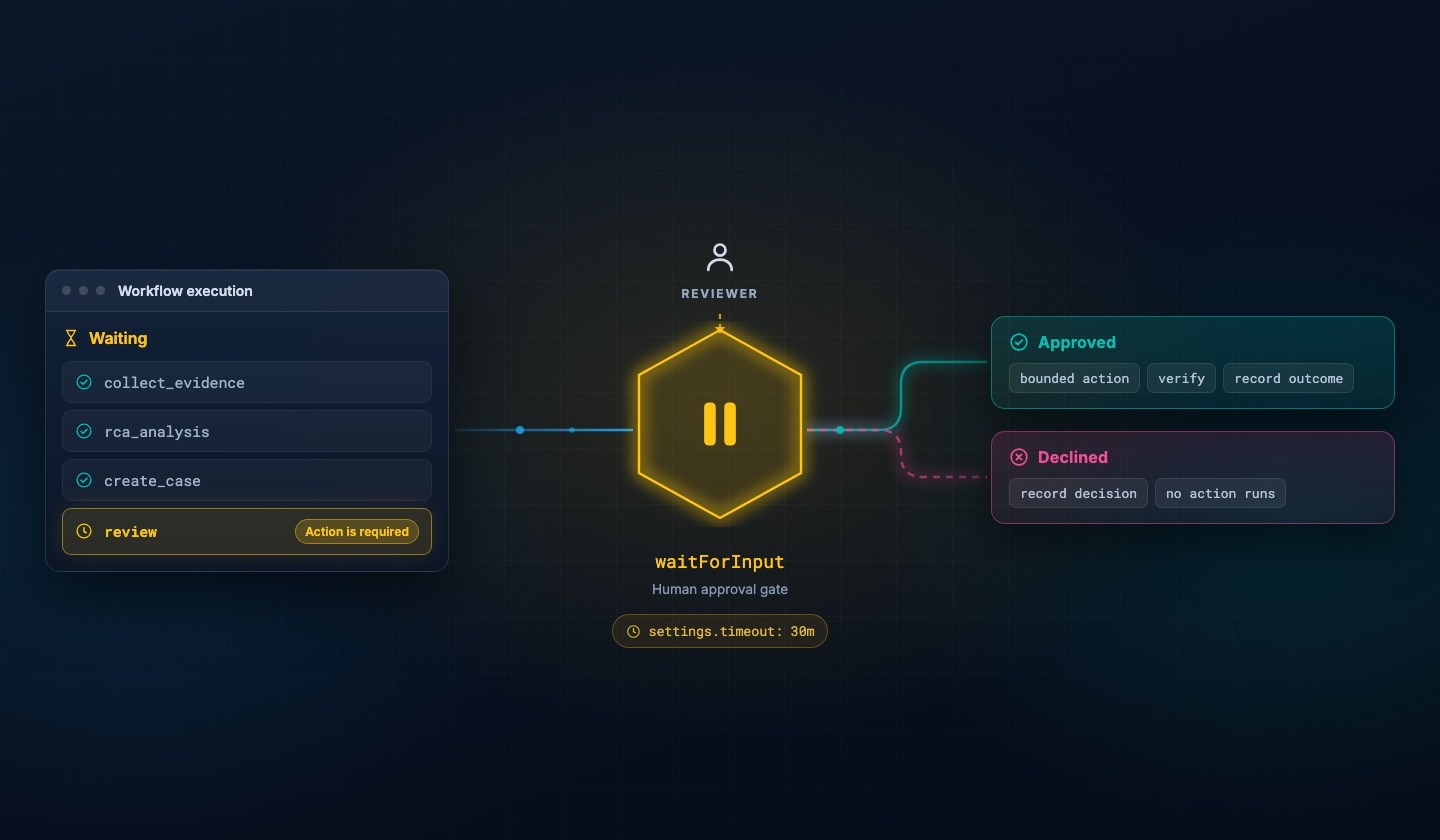
From recommendation to remediation in 4 stages: human-in-the-loop automation with Elastic Workflows
An approval gate that pauses incident response automation before the action and gives the reviewer enough evidence to decide in seconds. Whatever happens next, approved or declined, lands in one auditable record.
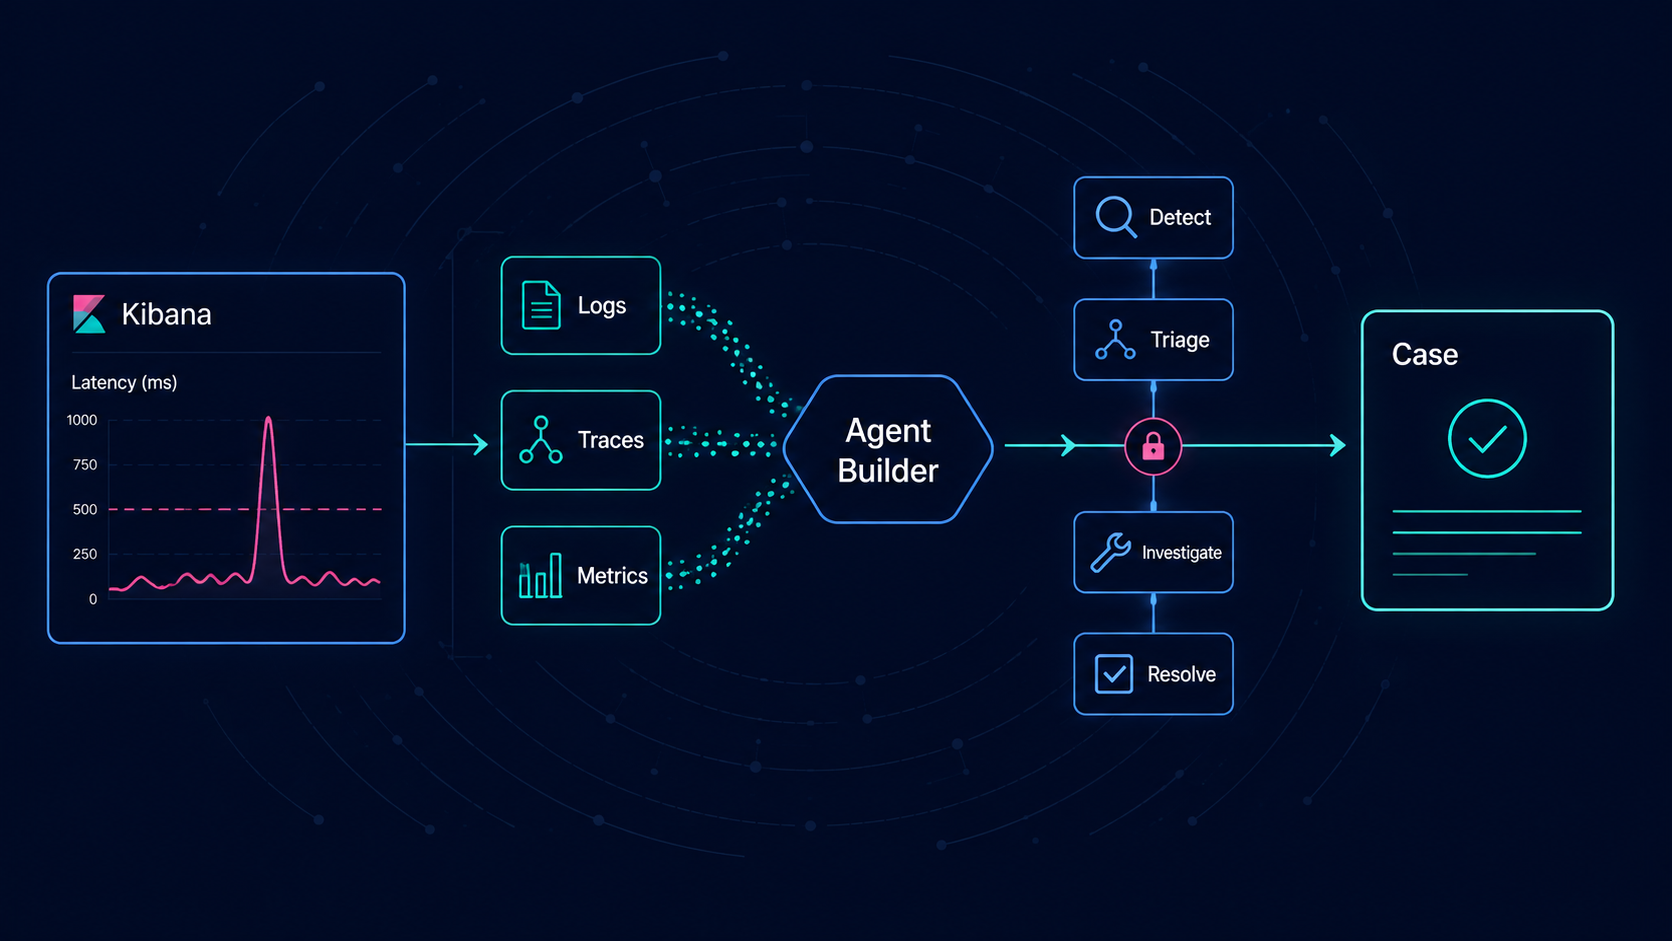
From alert to root cause in 3 minutes: automated root cause analysis with Elastic Agent Builder
Automated root cause analysis only works if the agent compares the incident window against the last healthy one. Skip that step and you get a summariser. The read-only skill, the scoped role and the Elastic Workflow are all here.

AI agent observability for Microsoft Foundry: two env vars, no collector
Set up LLM tracing once and every model call, tool execution and handoff from your Foundry agent arrives in Kibana as one queryable trace, with token counts on each span and code for Agent Framework, LangGraph and Node.js.
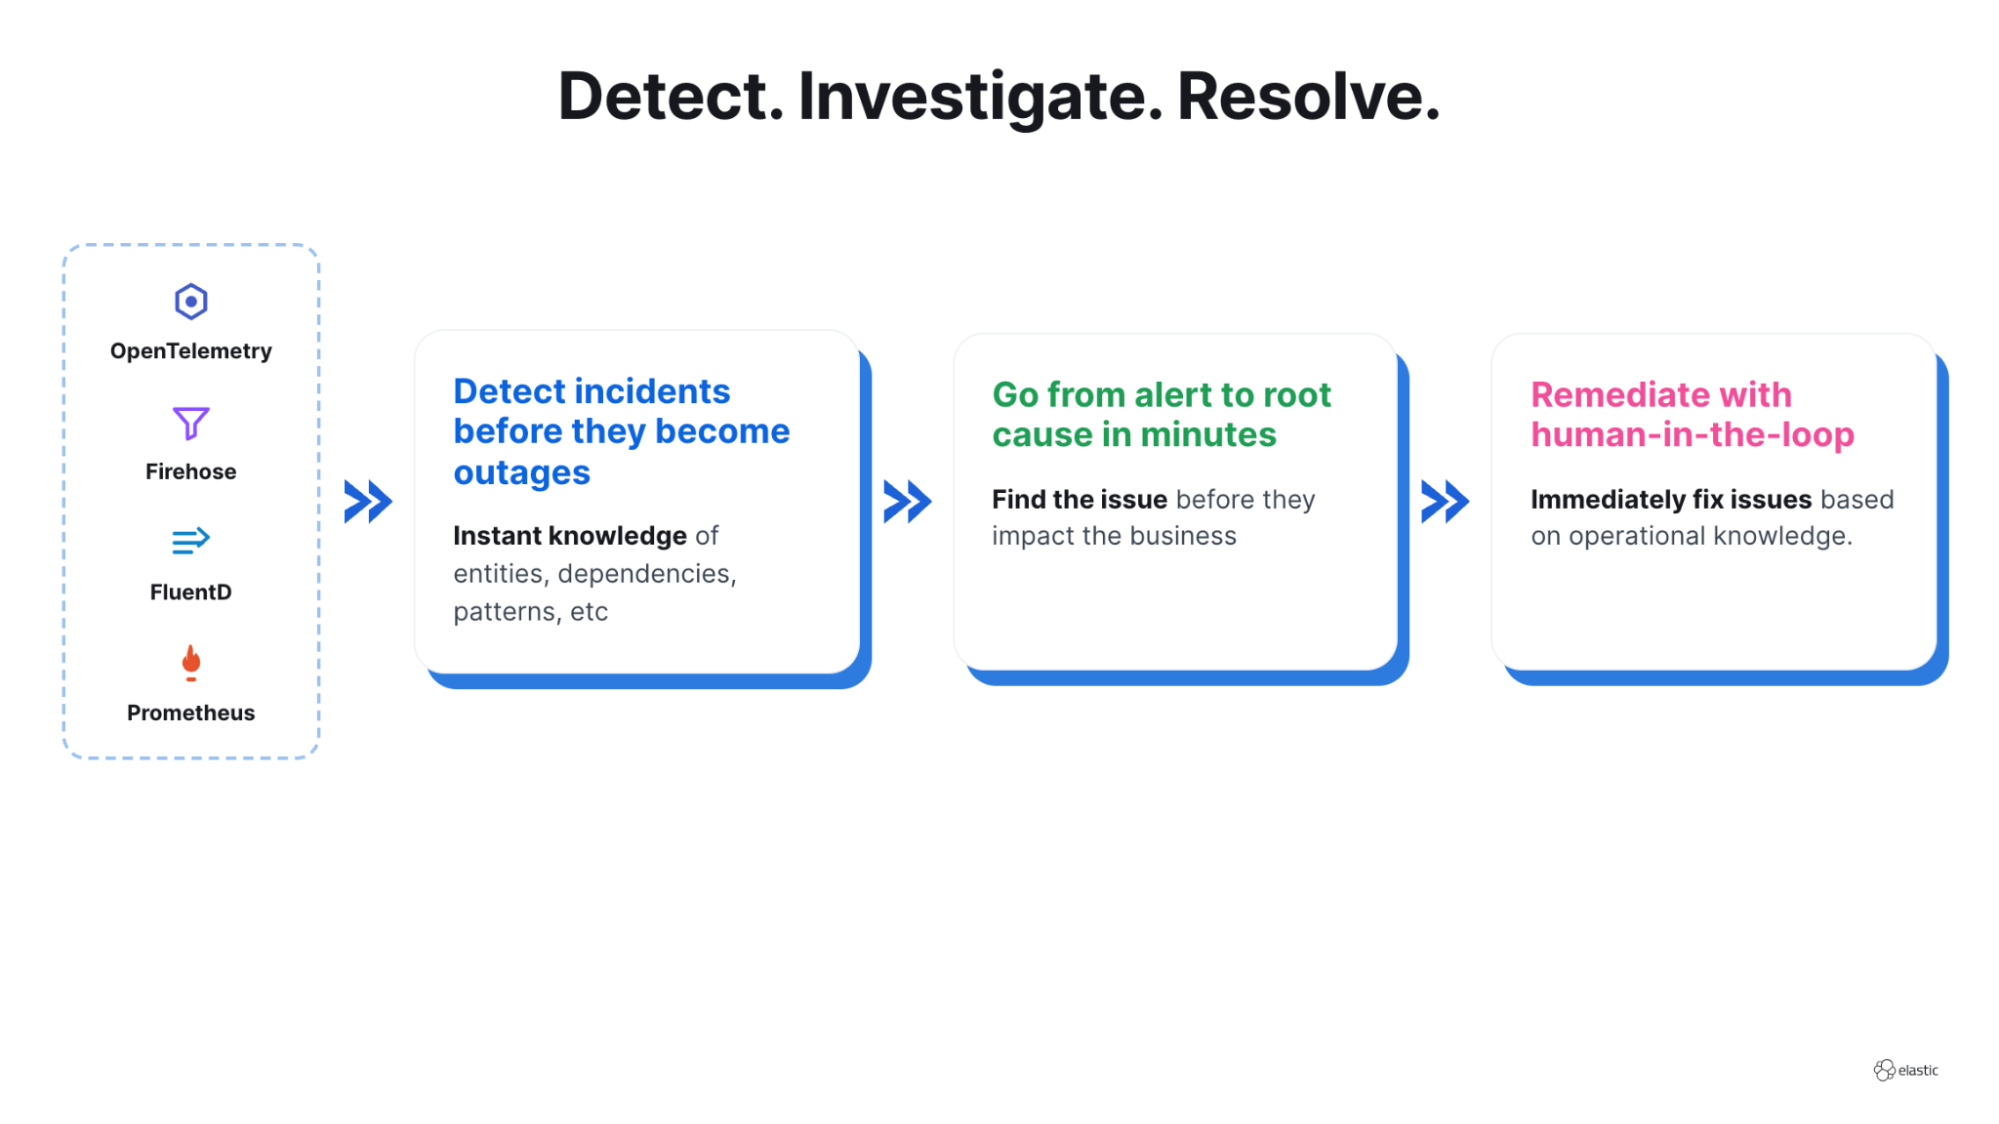
Sleep through the 3am page: automated incident response with Elastic on Red Hat OpenShift
Elastic Observability handles three routine incidents on its own: it scales, restarts or rolls back the workload, then confirms the service recovered, all with the reasoning model inside your own cluster.
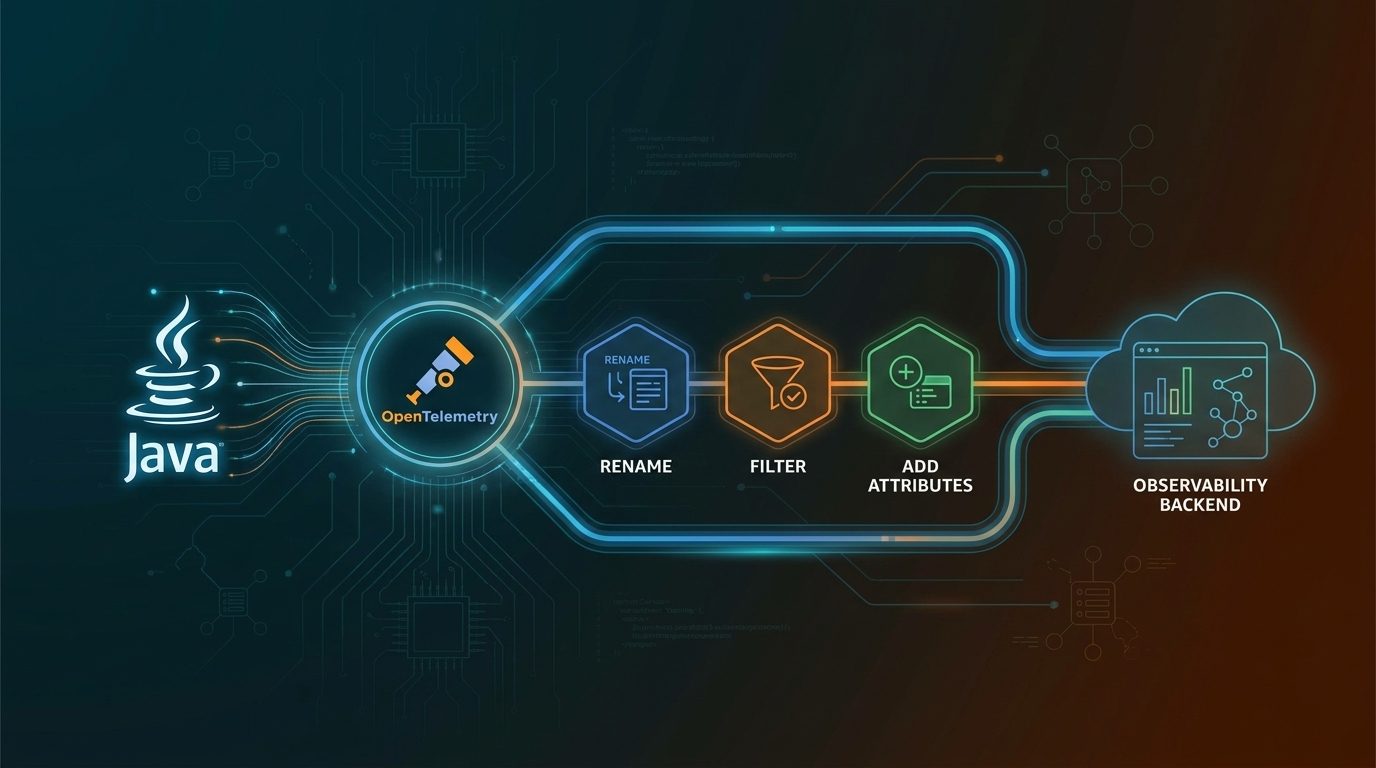
OpenTelemetry Java extensions: customize traces without forking the agent
One JAR, loaded at startup by the OpenTelemetry Java agent, lets you filter health checks, rename spans, add resource attributes, and control sampling with no application code changes.

Kubernetes observability: SLO templates that turn alerts into error budgets
Two bad rollouts burned 88% of a 30-day error budget while the SLI still read 99.56%. This post adds four SLO templates that bring burn-rate tracking to the OTel-based alert rules from Part 1, no new instrumentation required.

Elastic Agent now runs as an OpenTelemetry Collector: Less memory overhead, zero config changes
Elastic Agent 9.3 sends logs, metrics and traces through one OTel Collector pipeline, running Beats integrations alongside native OTel sources in a single Fleet-managed agent.