Blogs
Hands-on, insight-driven content about observing your production and development environments using Elastic Observability.

30x faster than Prometheus: how we rebuilt Elasticsearch as a leading columnar metrics datastore
Elasticsearch now stores OTel metrics at 3.75 bytes per data point and queries them up to 30x faster than Prometheus. Here's how we rebuilt TSDS and ES|QL.

How Elastic's ML and AI Assistant cut 802.1x triage from 20 minutes to seconds in the NOC
Find out how Network Operations Center (NOC) teams use Elasticsearch, ML, and the Elastic AI Assistant to cut MTTR, tame alert fatigue, and solve network issues fast.
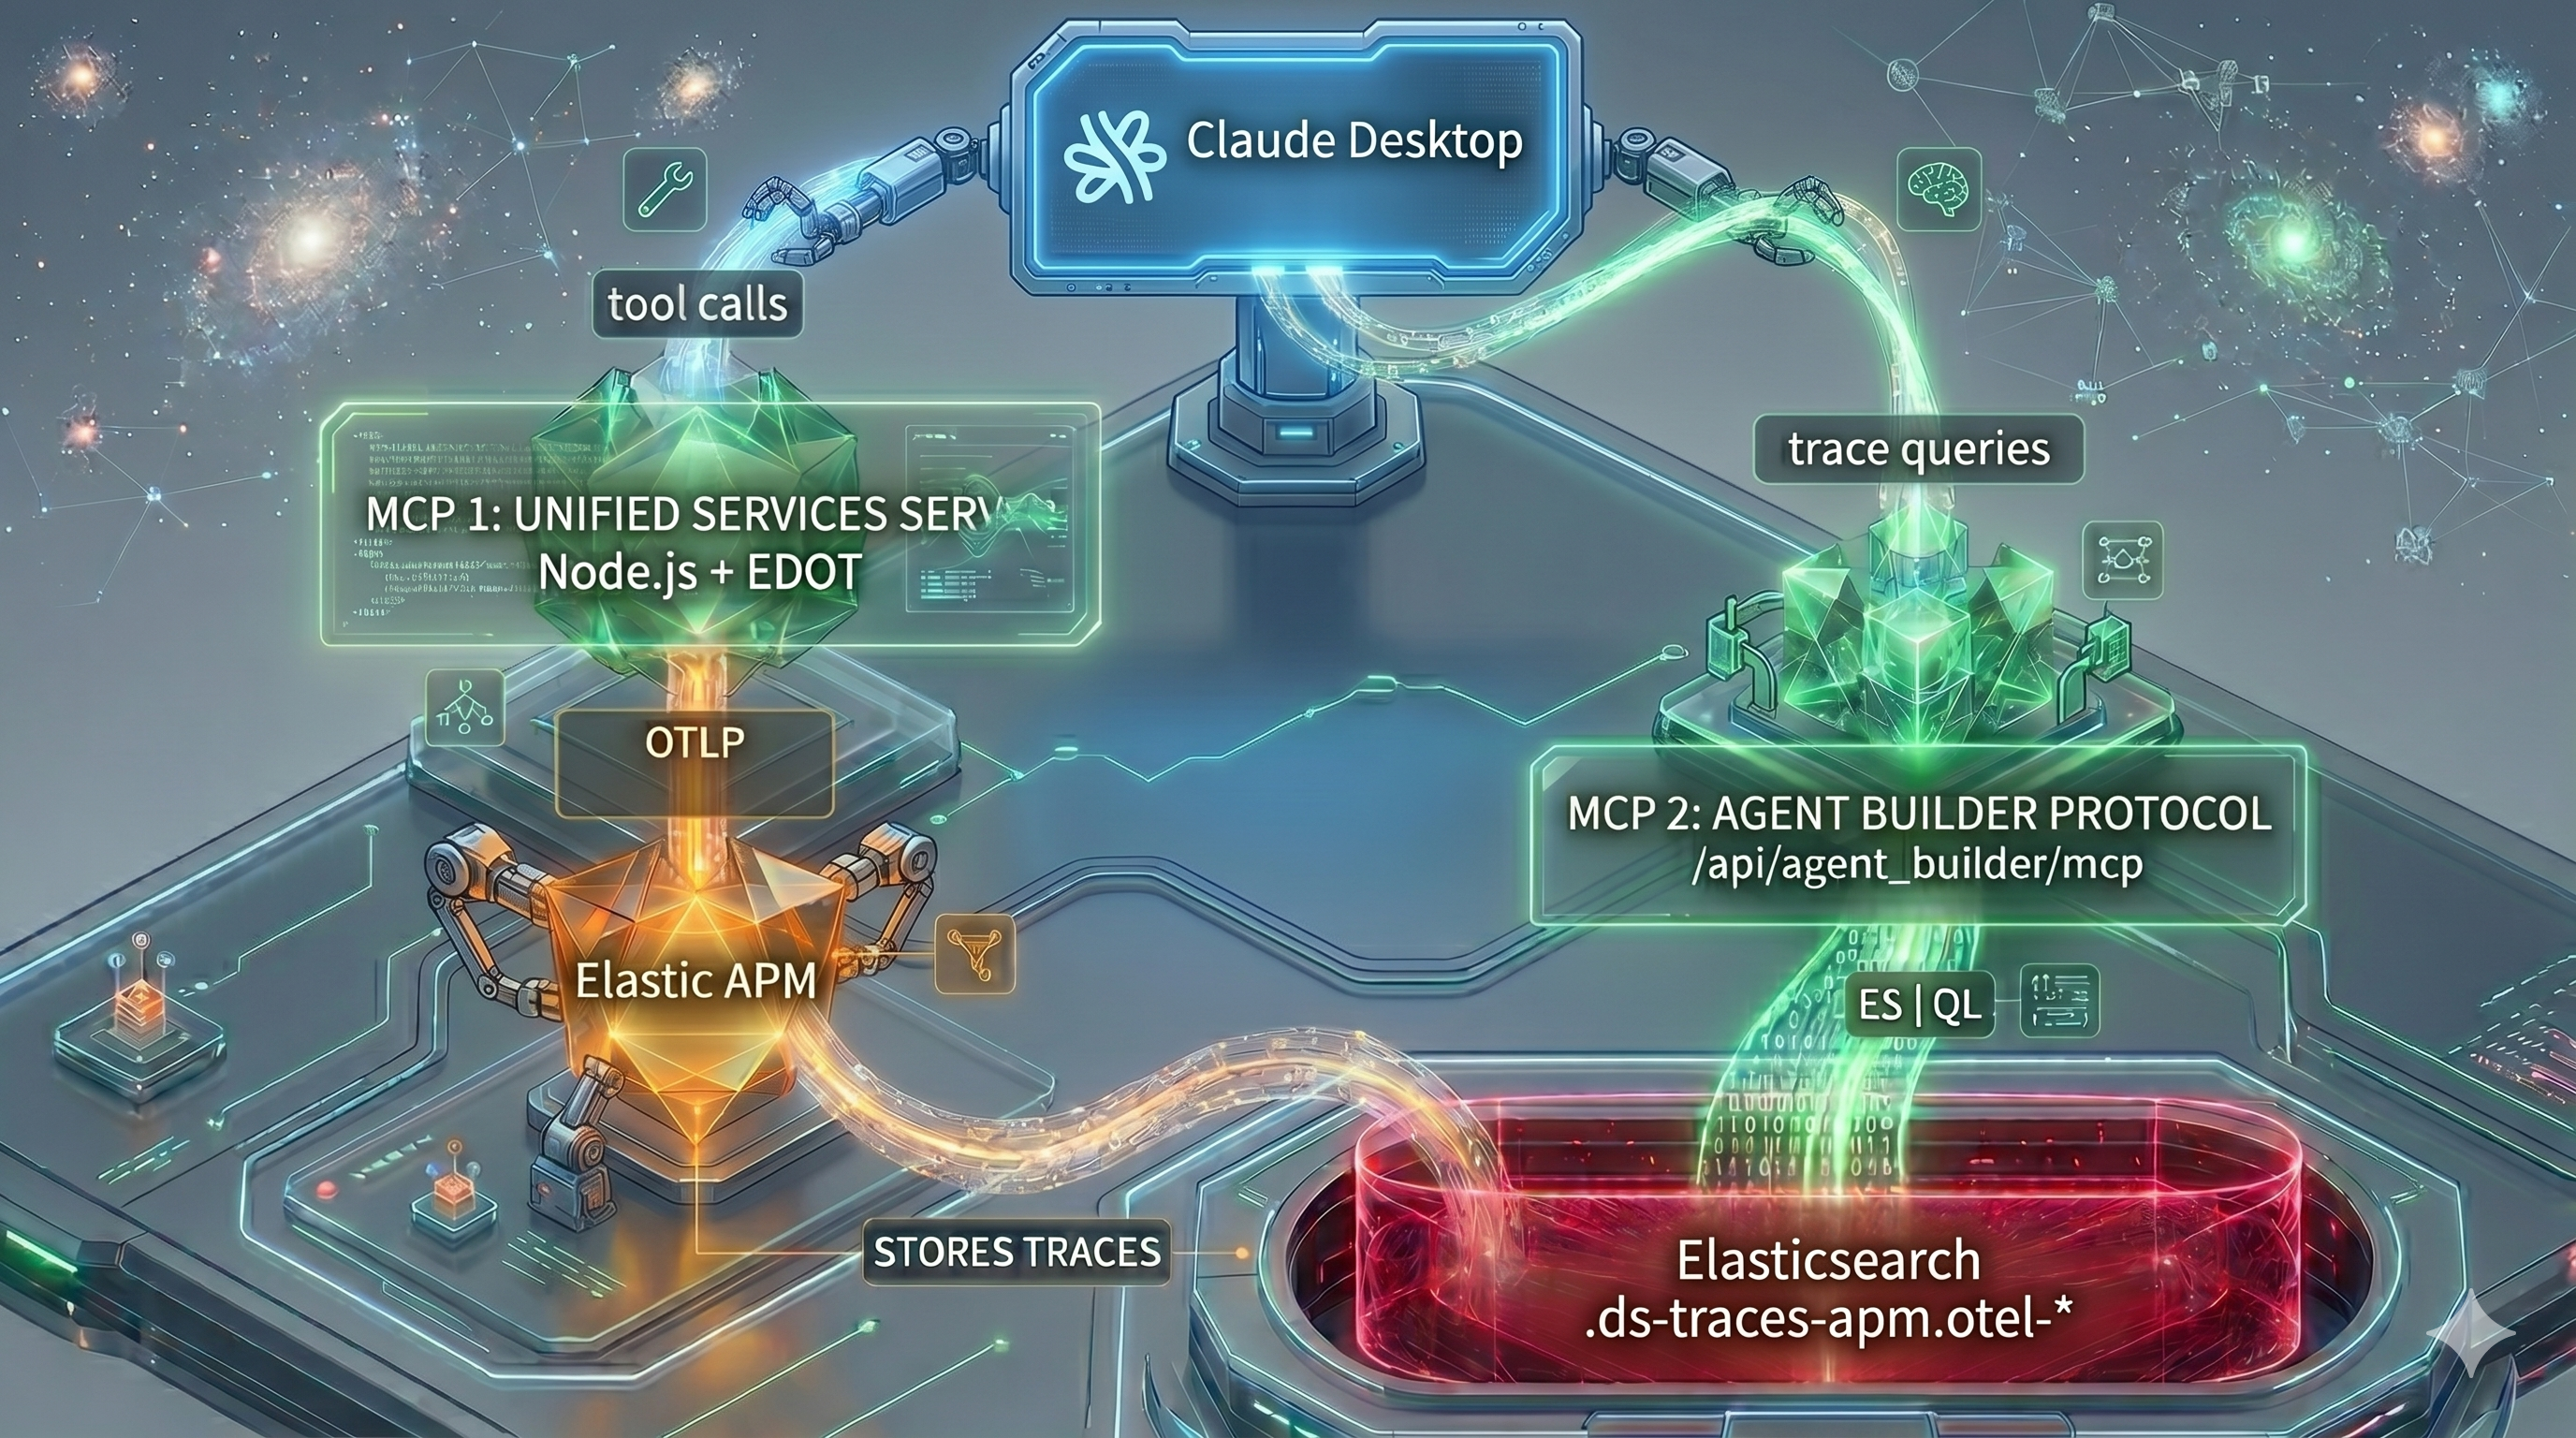
How to trace MCP server tool calls with OpenTelemetry and Elastic APM
Add OpenTelemetry tracing to an MCP server, visualize tool call performance in Elastic APM, and query the trace data from Claude Desktop using the Agent Builder MCP.

Piping Hot: Bringing ES|QL to Your Grafana Dashboards Using the Elasticsearch Plugin
You can now write ES|QL queries in Grafana with the Elasticsearch plugin. Learn how to enable it and write pipe-based queries directly in the Grafana UI.

Kubernetes observability: MCP specialist agents for safer EKS triage
Scope a specialist EKS MCP agent for cluster checks while the Elastic AI Agent triages; fix a service misconfiguration using the specialist agent in a few prompts.
Migrate Logstash Pipelines from Azure Event Hubs to OTel Collector Kafka Receiver
Step-by-step guide to migrating Logstash pipelines from the Azure Event Hubs plugin to the OpenTelemetry Collector Kafka receiver.
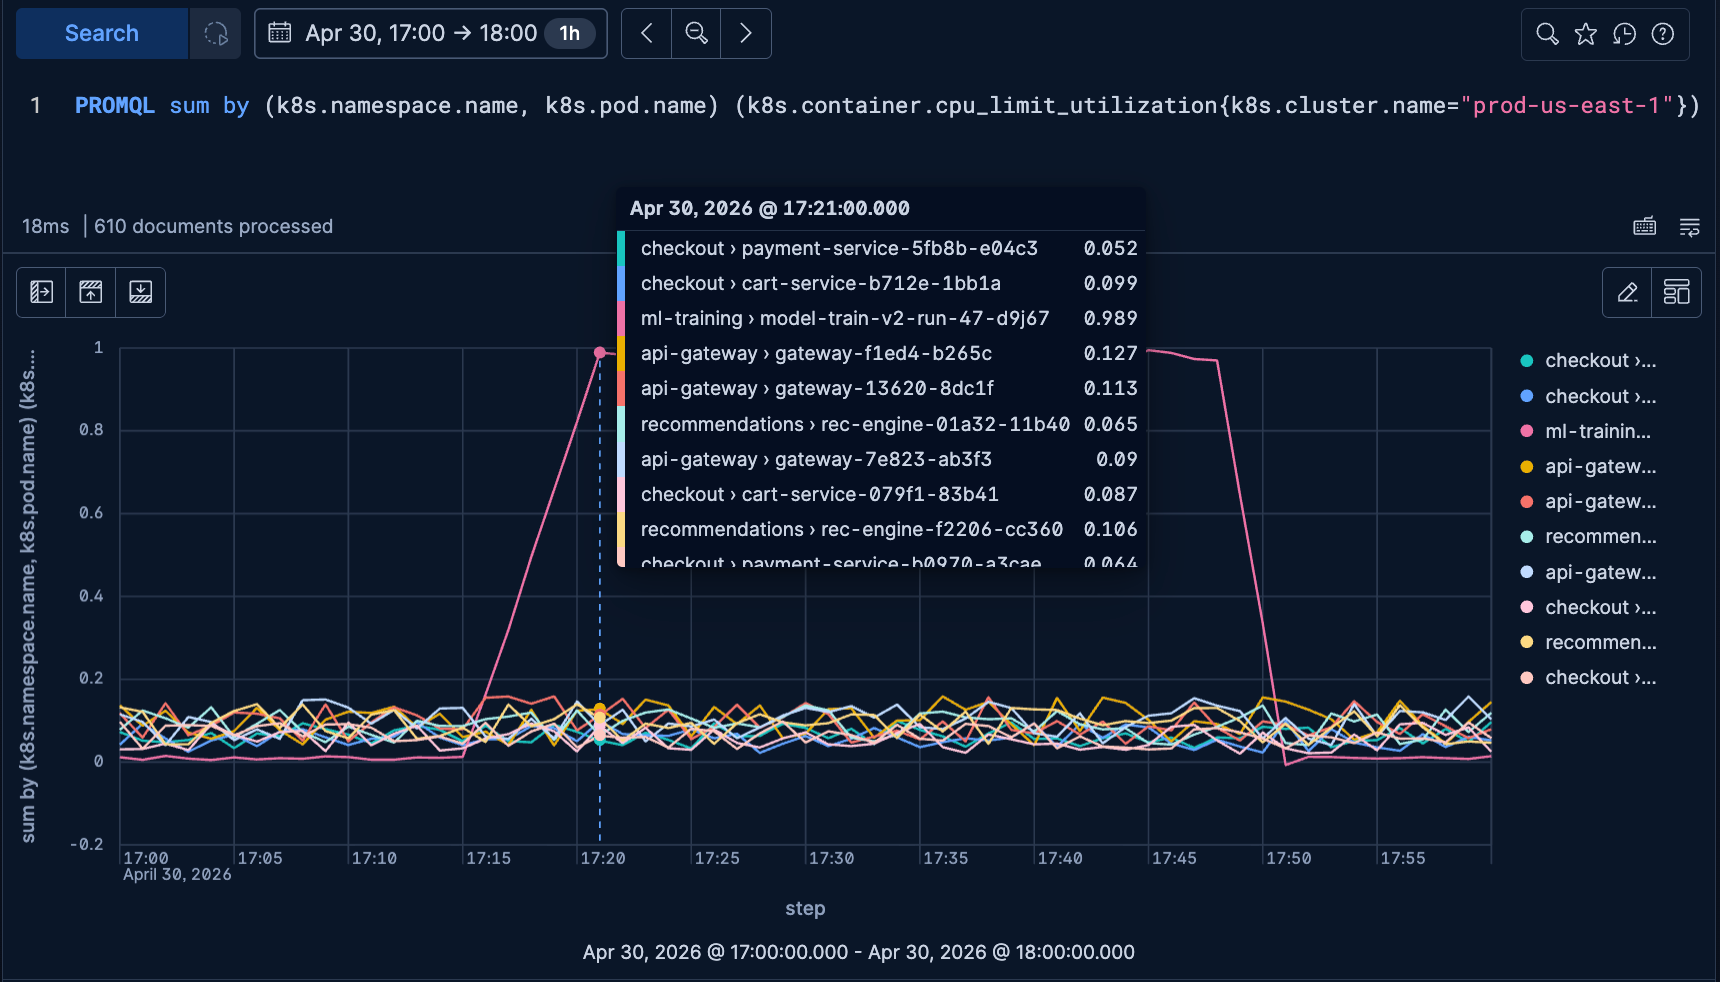
Investigate Kubernetes infrastructure issues with PromQL in Elasticsearch & Kibana
Walkthrough of a Kubernetes fleet-wide CPU investigation in Elastic Observability, from cluster to namespace to the noisy pod, using PromQL in Elasticsearch and Kibana.

TLS certificate monitoring with Elastic Workflows, Synthetics, and Osquery: Eliminate manual renewals
Automate TLS certificate monitoring with Elastic Workflows, Synthetics, and Osquery. Detect expiring certificates, rotate, and verify without human intervention.
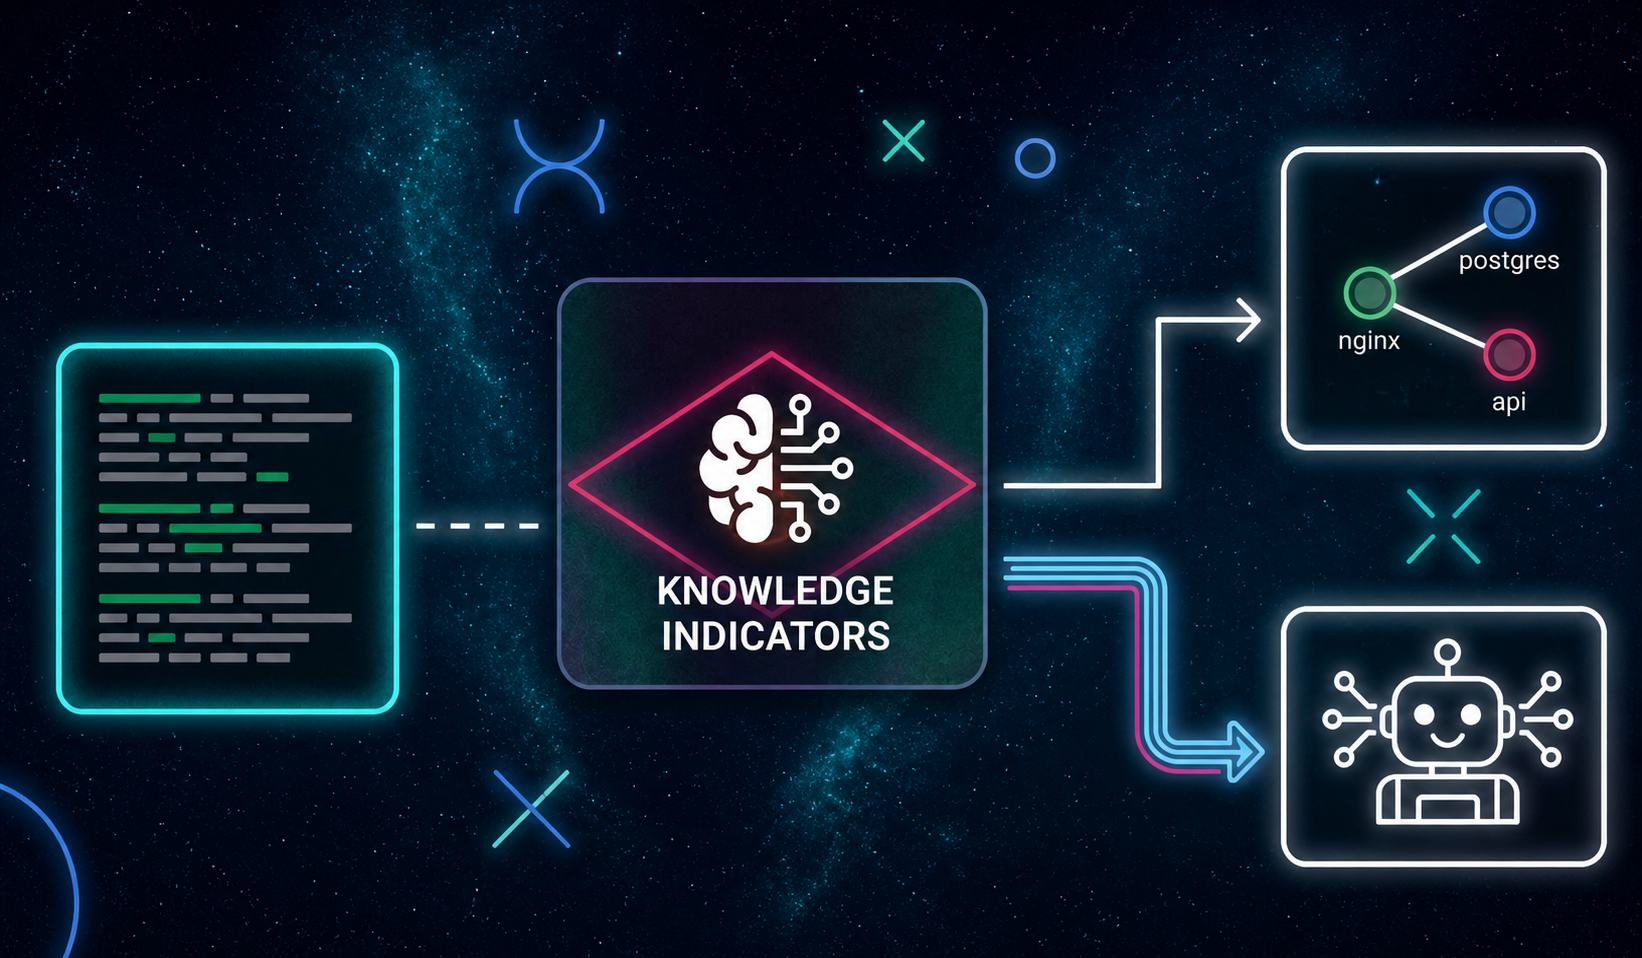
From raw logs to system knowledge: the AI context layer observability is missing
A self-updating knowledge base built from your logs: services, dependencies, and failure modes, so your AI agents always know what they are looking at.
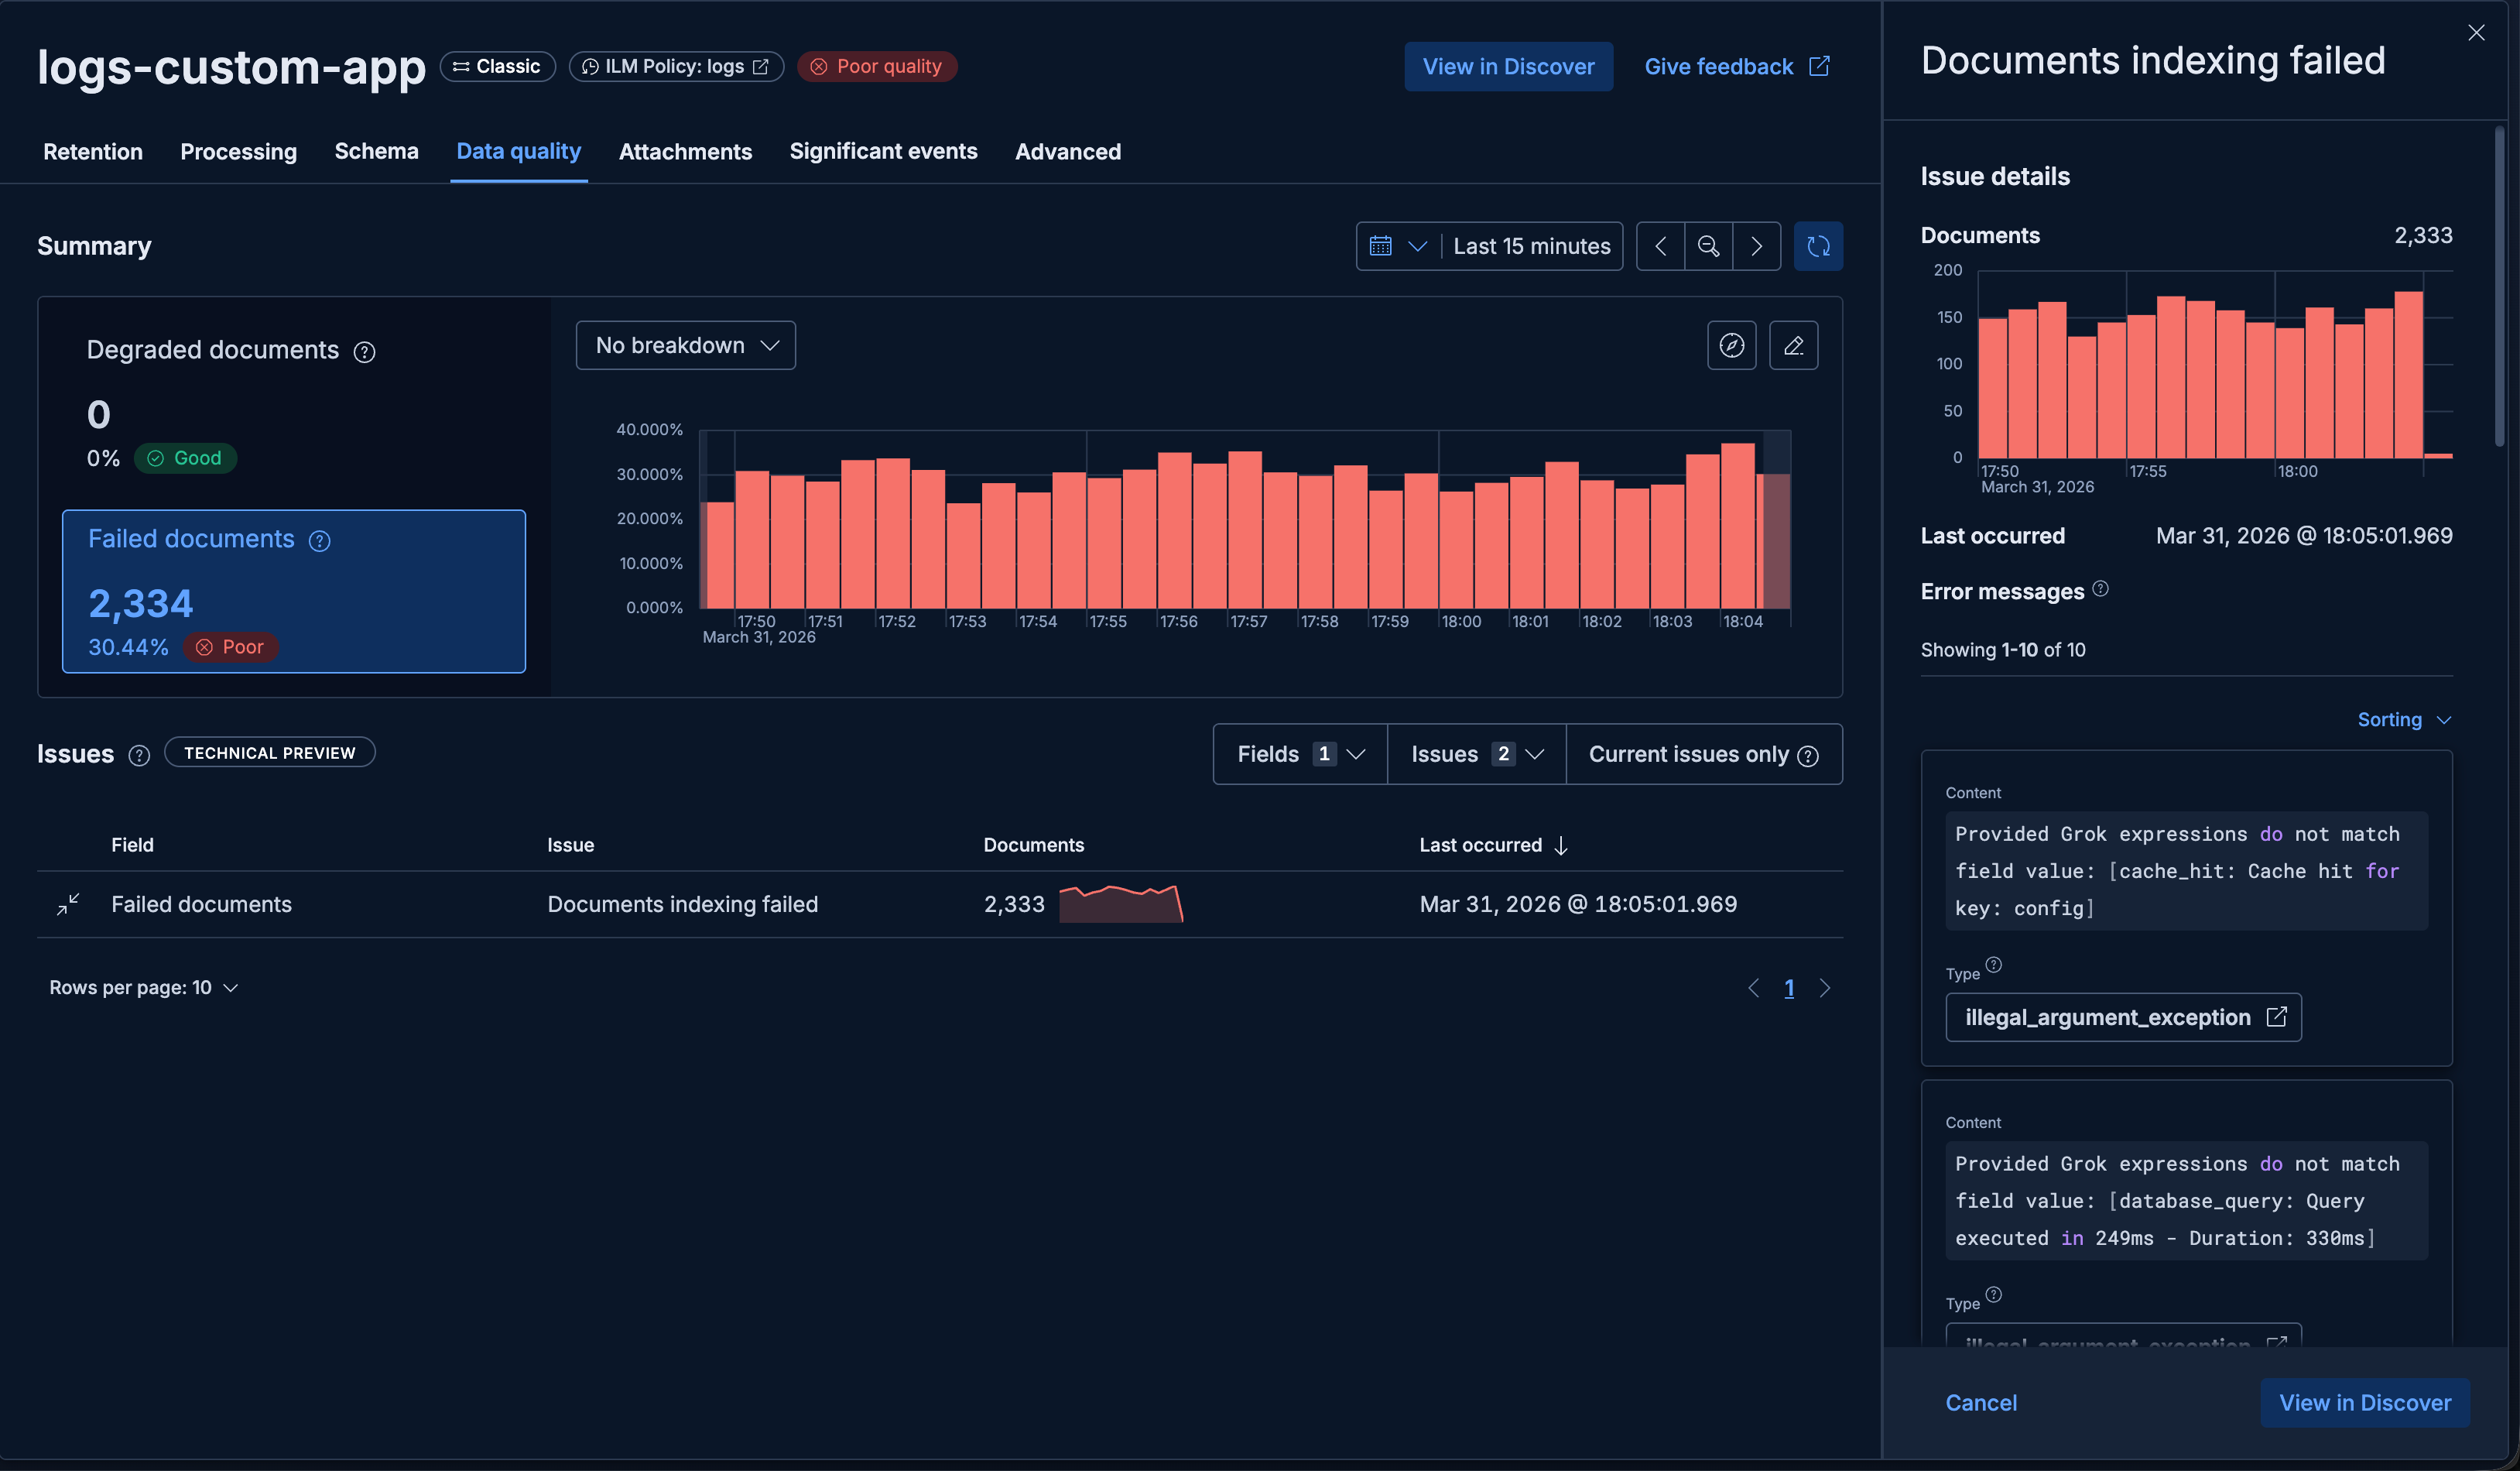
Fixing Elastic Streams processing failures without dropping data
When your Streams ingest pipeline breaks, failed documents land in the failure store, not the floor. Here's how to use those exact failures to fix your pipeline without re-ingesting from the source.

Connecting Cursor to Production Logs via the Elastic MCP Server
Learn how to connect Cursor to your Elastic APM data using the Elastic Agent Builder MCP server, so you can debug production errors and make UI decisions backed by real usage data without leaving your editor.