Dashboards and visualizations in Elastic Agent Builder chat
Agents can create and manage dashboards and visualizations directly in the conversation. Send a message like "create a dashboard to monitor host CPU and memory usage" and the agent builds a dashboard with ES|QL-powered visualization panels.
This functionality is powered by the built-in dashboards (dashboard-management in 9.4 and 9.5) and visualization-creation skills, which access core or inline tools to create and edit dashboards and visualizations.
For best results with ES|QL-heavy dashboard generation, use a higher-tier model such as Claude 4.6 Opus. Current testing shows that Claude 4.6 Sonnet may require more corrections for generated dashboard queries.
Building dashboards manually requires knowing which indices to query, how to write the right visualizations, and how to arrange panels. Agent-generated dashboards let you skip that process and go from a question to a working dashboard in seconds. This is particularly useful when you need to:
- Get started with dashboards: If you are new to Kibana dashboards, you can learn by asking the agent to create visualizations and exploring the results. This lowers the barrier to entry and helps you understand dashboard capabilities without needing to learn the editor first.
- Investigate ad hoc: During an incident, ask the agent to build a dashboard showing the relevant metrics so you can triage without leaving the conversation.
- Explore unfamiliar data: When you are working with a new data source, ask the agent to visualize key fields so you can understand what is available before building something more permanent.
- Prototype and iterate: Describe the dashboard you want in plain language, refine it through conversation, and save it only when you are satisfied with the result.
You can open the full-screen chat, or open the chat beside the page you are on.
- Find Agents in the navigation menu or by using the global search field to open the full-screen chat. You have more room to preview dashboards and read the agent's replies.
- Select AI Agent in the header to keep the page you are on open, with the chat beside it.
-
While you edit a dashboard, select Create with chat to open that chat beside it with the dashboard attached. On an empty dashboard, the card includes pre-populated examples, and a blank Open chat option. When the dashboard already has panels, select Add → Create with chat. -
To improve a dashboard you already built, select Enhance while you edit it. The chat opens in the sidebar with the dashboard attached, and the agent tidies its text, layout, and chart styling. Refer to Enhance a Kibana dashboard using AI.
When an agent creates a dashboard, it describes the contents in the conversation and attaches the dashboard to the message. Dashboards are both inputs and outputs: the agent can reason about the panels in an attached dashboard when answering follow-up questions. If you open a new conversation while viewing a dashboard, that dashboard is attached automatically as context, so you can ask about it right away.
The following example walks through creating a dashboard from a natural language request.
-
Ask the agent to create a dashboard
Describe what you want to visualize. The agent creates the dashboard and responds with a description of the contents and a Preview button.
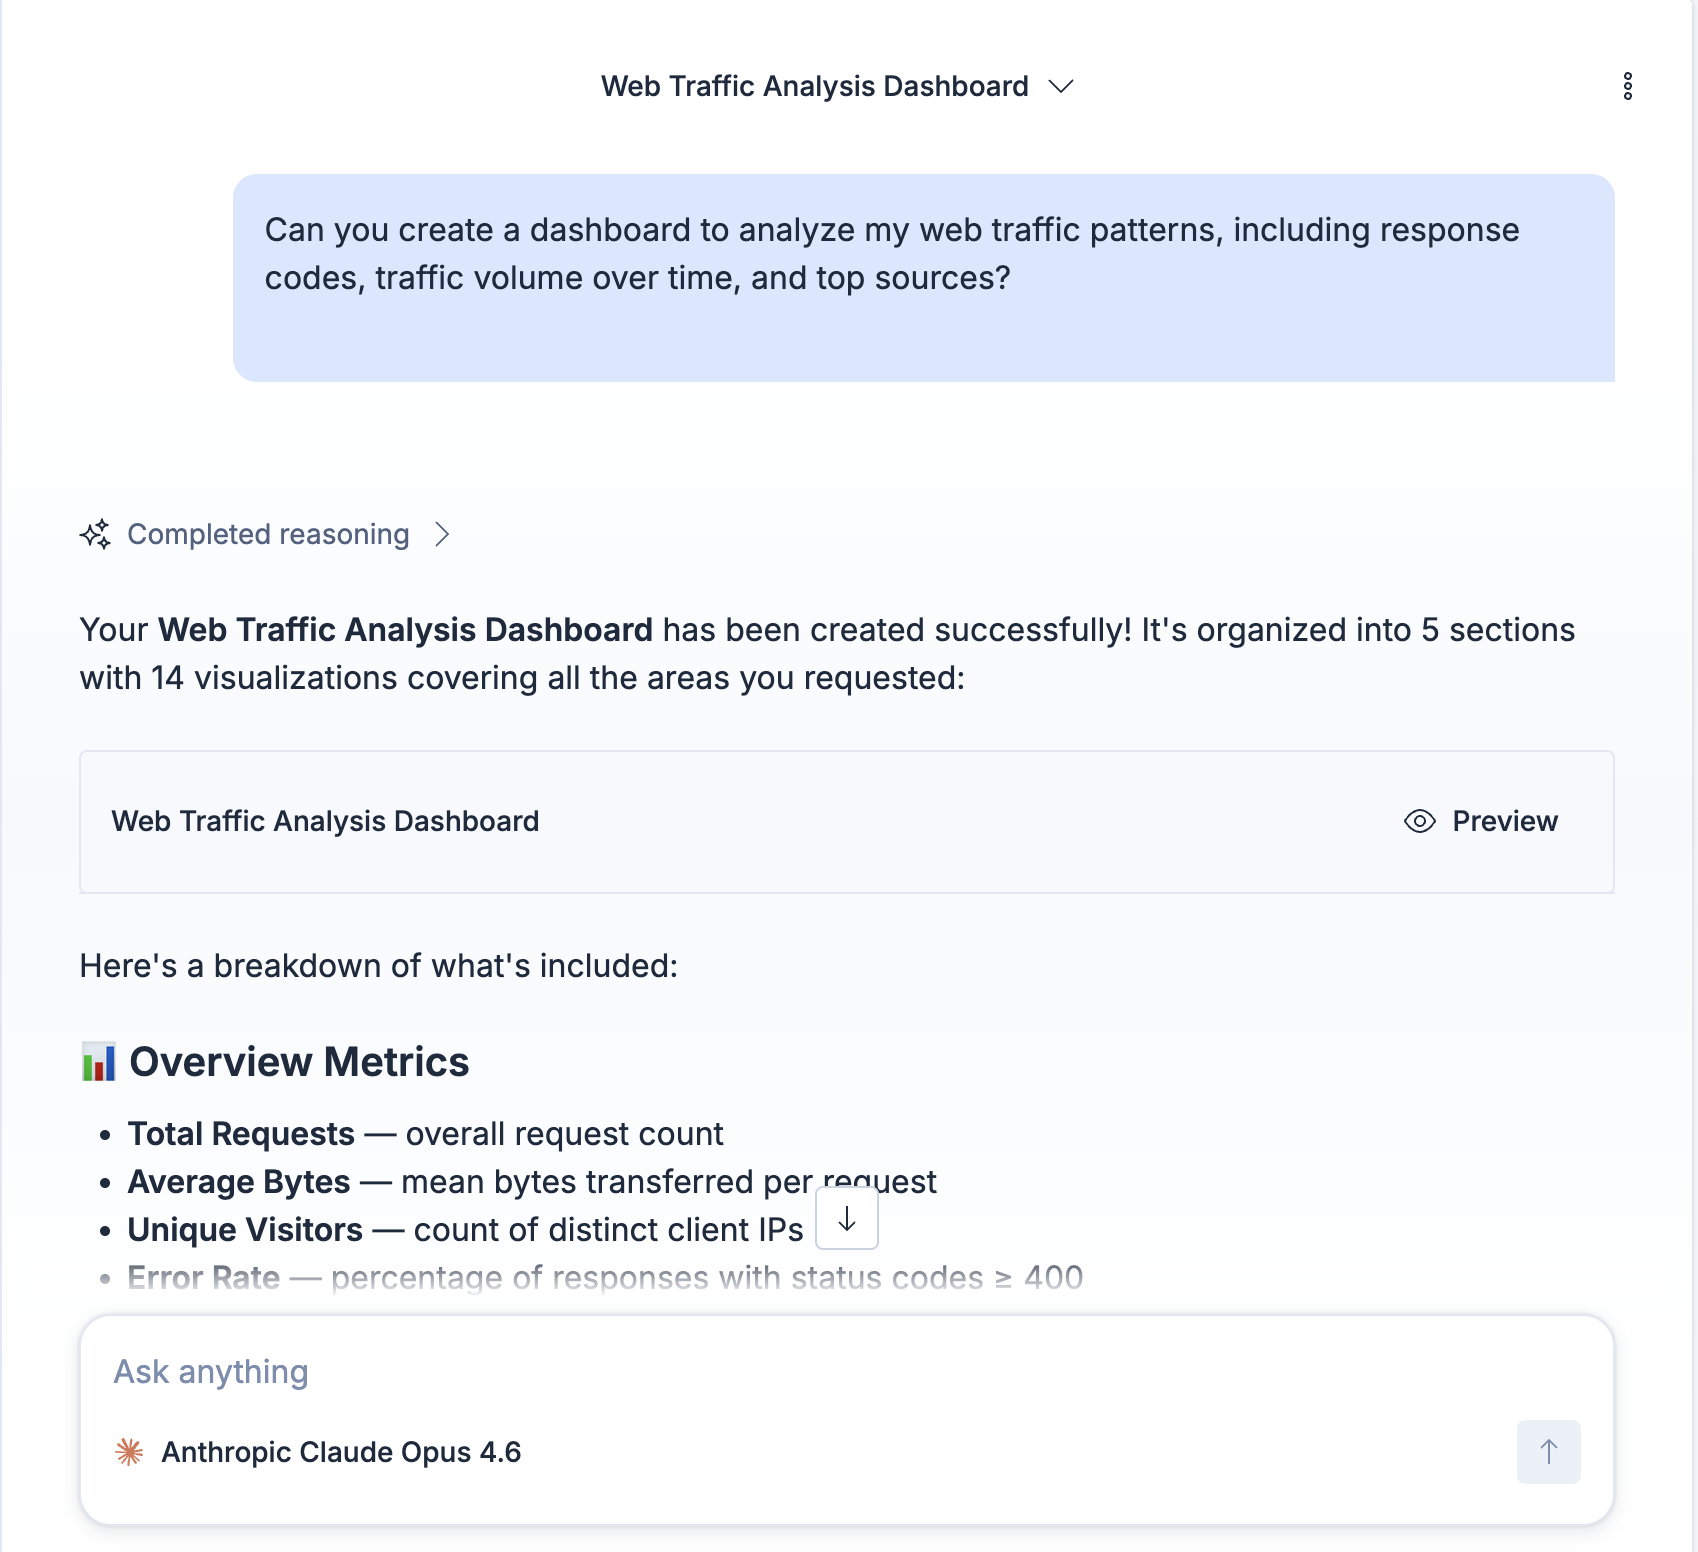
-
Preview the dashboard
Select Preview to open the dashboard in a canvas alongside the conversation.
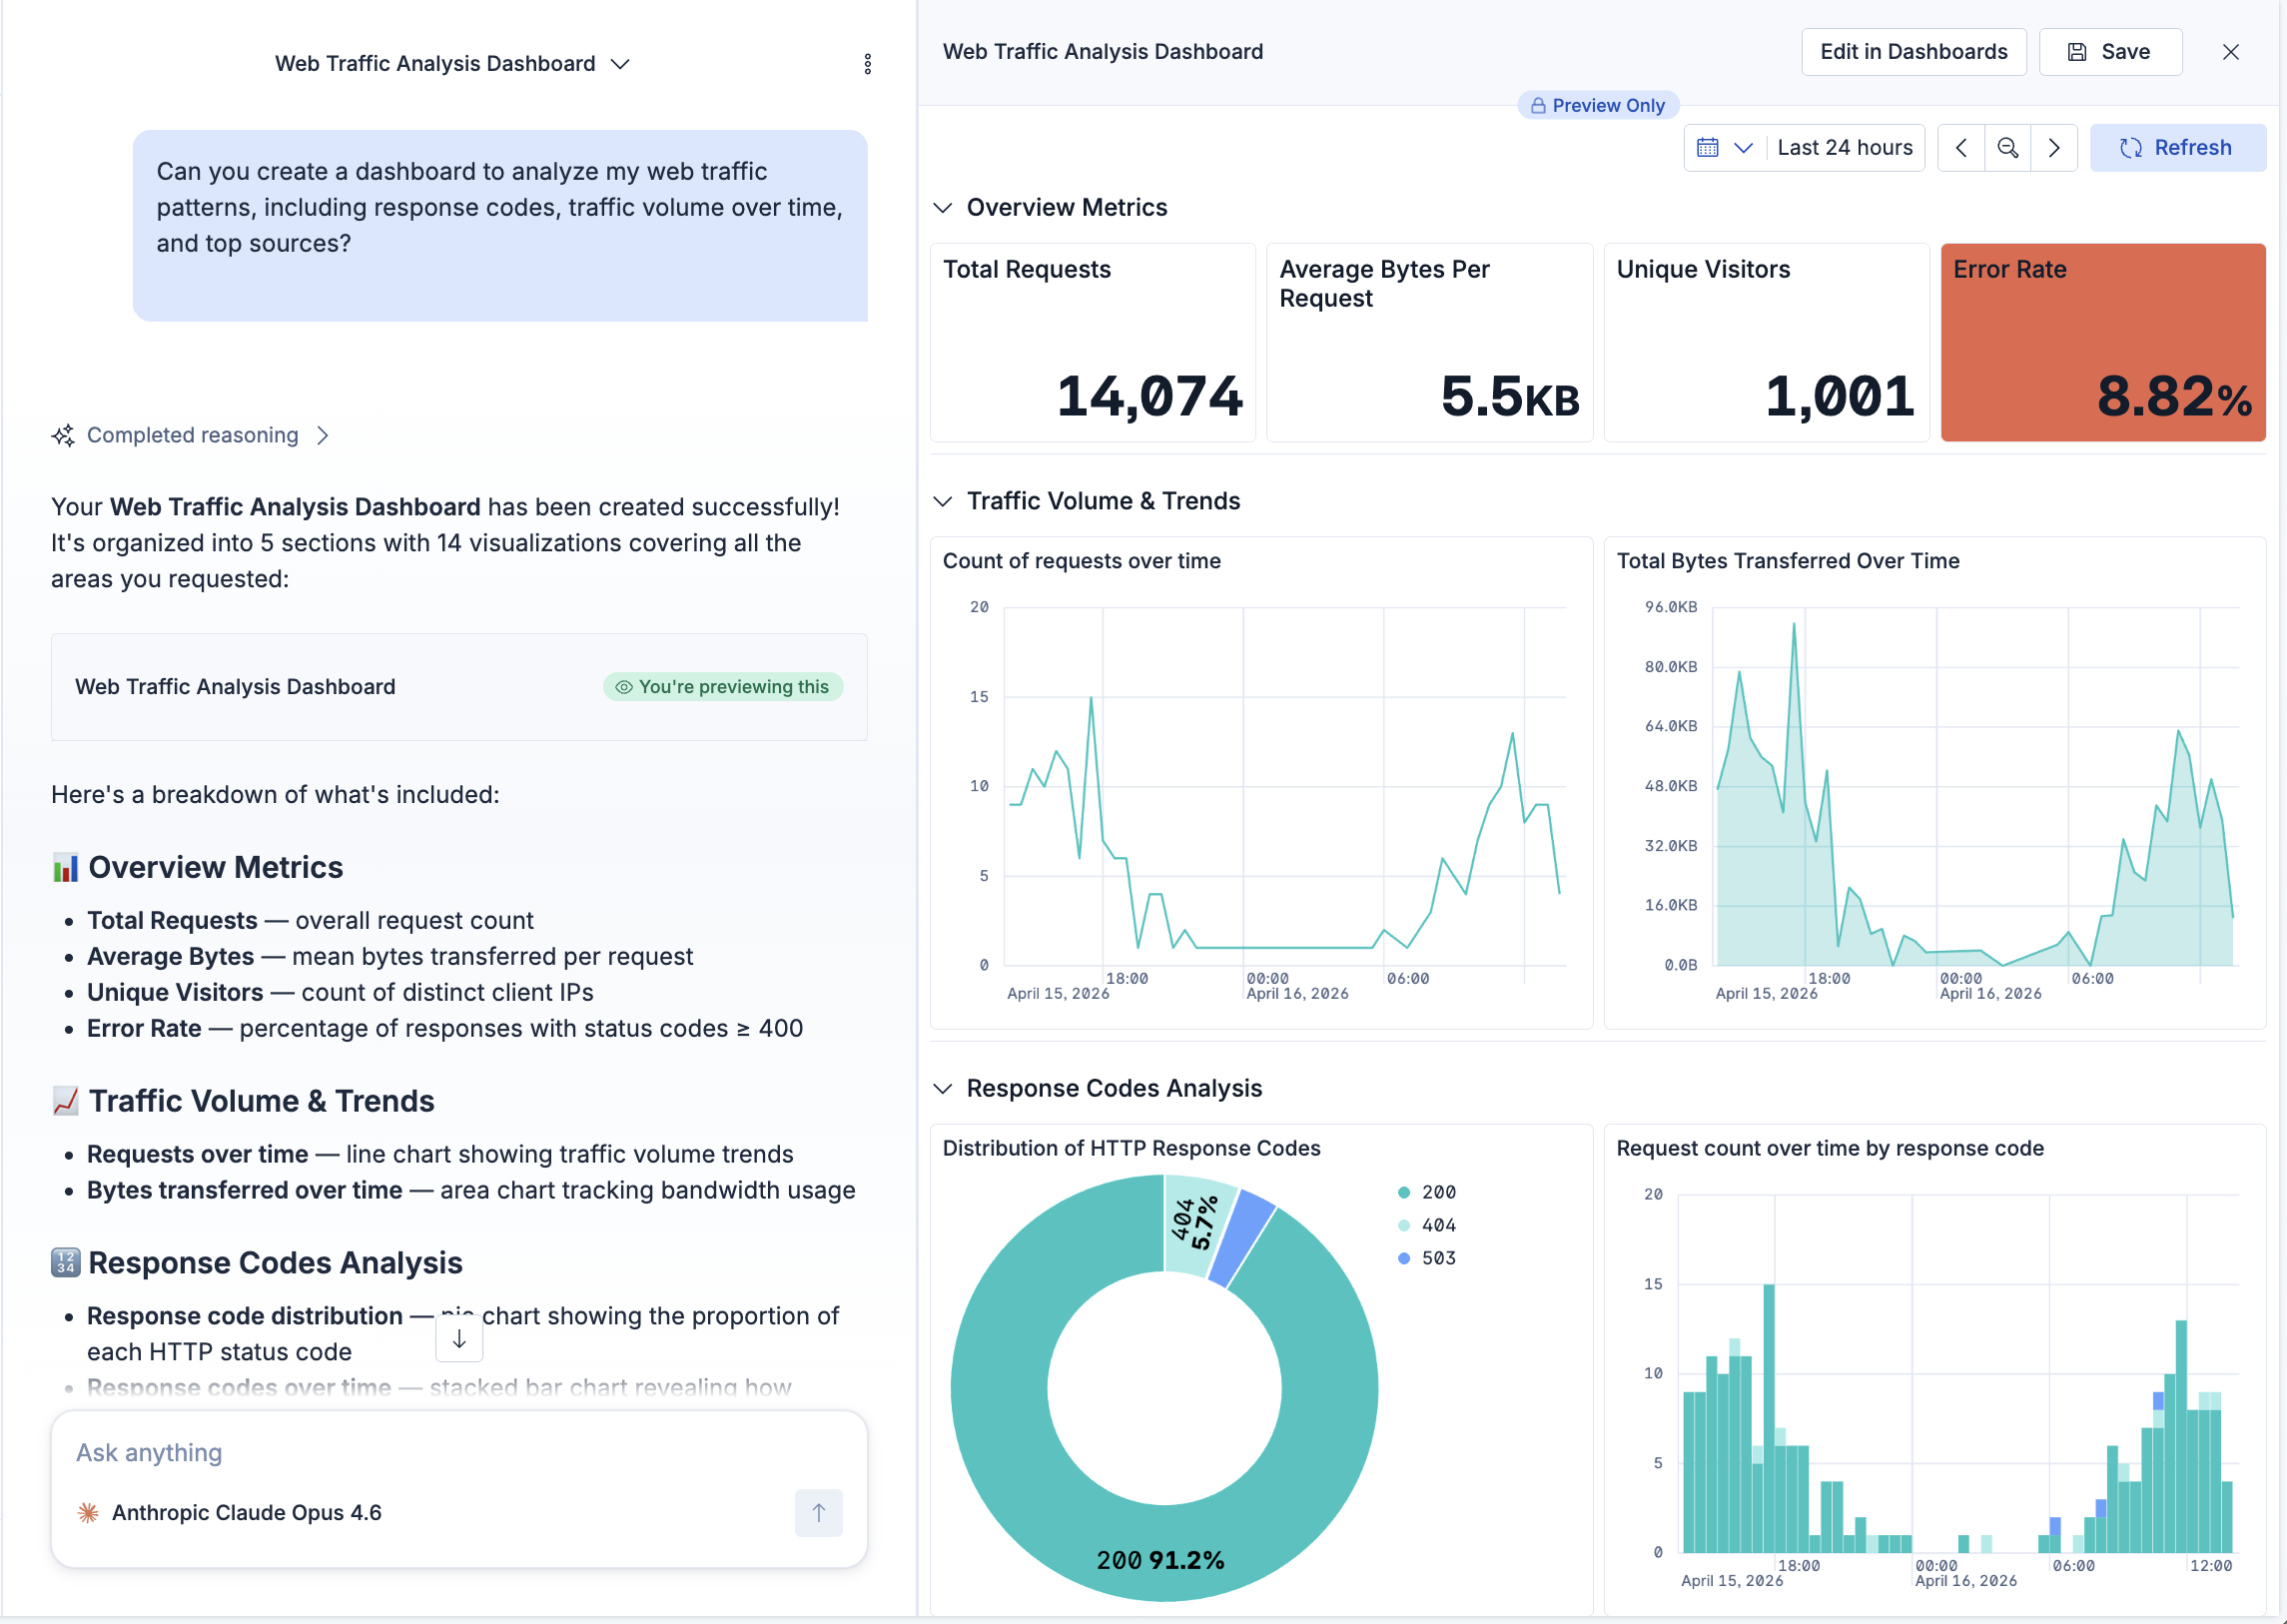
In the canvas, you can explore the data before you save the dashboard: enter a KQL query, add filter pills, adjust the time range, and select chart elements or legend values to filter the results. To work with an individual panel, hover over it to reveal its actions, such as maximizing or inspecting it.
TipSelect the Fast mode option to get faster, estimated results from ES|QL visualizations and ES|QL-powered Vega and Vega-Lite panels that use one
STATScommand. Elasticsearch still returns exact results when sampling would not speed up the query. Refer to Use Fast mode. -
Save or refine
From here, you can use the buttons in the canvas toolbar:
Select Save to save the dashboard as a Kibana saved object. Select Edit in Dashboards to open the dashboard in the Dashboards app for further editing.
You can also continue chatting to refine the dashboard. For example, ask the agent to add panels, change chart types, update metrics, or rearrange the layout.
Individual visualizations display inline in the conversation when you ask for a single chart or metric. Inline visualizations are interactive: adjust the time range, or select a range directly on the chart to zoom in.
agentBuilder:experimentalFeatures advanced setting and ask the agent to show them in a Discover table. Refer to Discover tables in chat.
Agent-created dashboards start as in-memory attachments in the conversation. You can save them as Kibana objects when you are ready, and pull in changes if the saved dashboard is edited outside the conversation.
Dashboards that agents create are in-memory by default. They exist only as conversation attachments and are not saved as Kibana objects until you choose to save them. This means you can iterate on a dashboard through conversation without creating unnecessary saved objects.
To save an agent-created dashboard as a Kibana saved object:
- Select Save on the dashboard preview.
- Review the title and description (pre-filled by the agent), add optional tags, and configure permissions.
- Select Save.
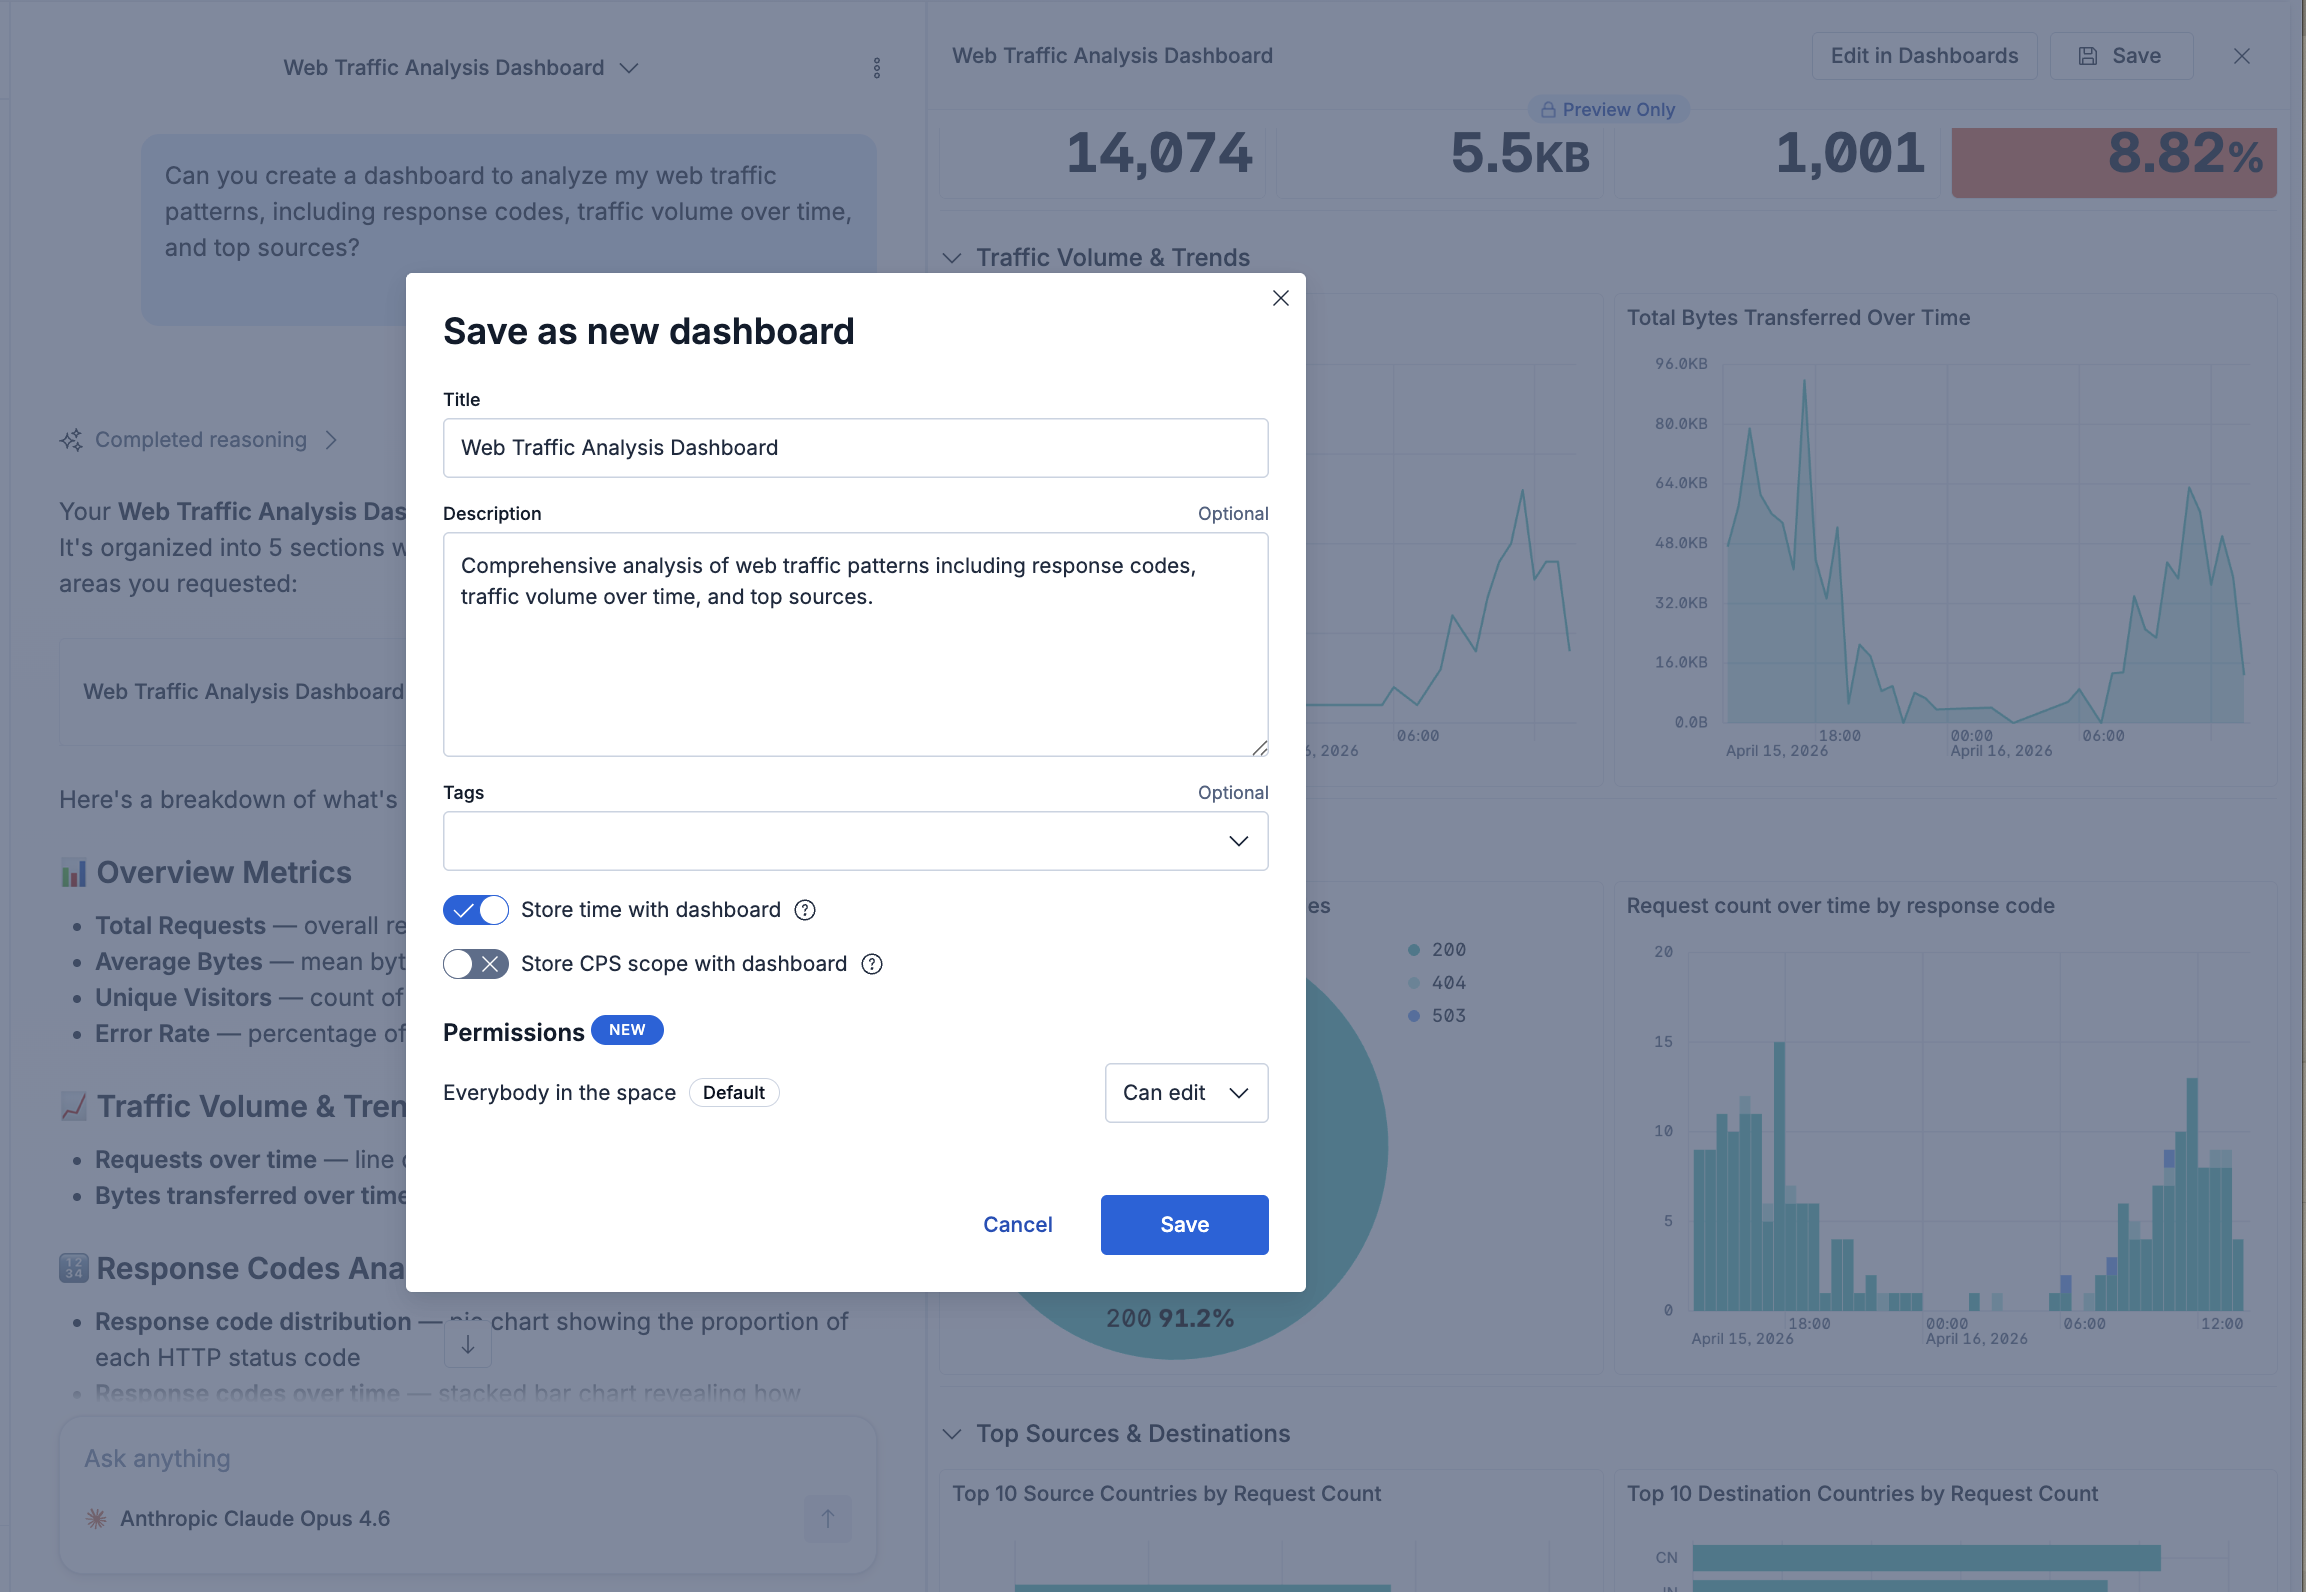
After saving, you can open the dashboard in the Dashboards app for further editing using the full dashboard editor.
Saving a new version of the dashboard from the same conversation overwrites the existing saved dashboard.
If you save a dashboard and then edit it in the Dashboards app, the conversation detects the changes. A notification appears with the message "Some attachments are outdated", and you can select Use updated versions to pull the latest changes back into the conversation.
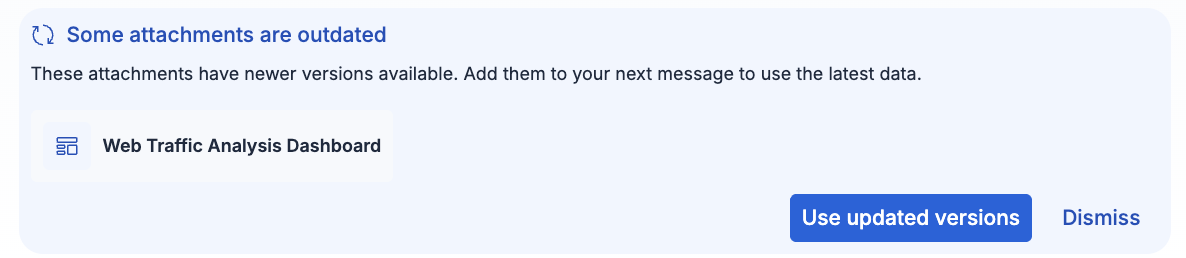
The agent preserves your external edits when making further updates. You can also go back to any previously generated version of a dashboard in the conversation and save that version instead.
Agents can create and manage the following panel types:
| Panel type | Description |
|---|---|
| ES|QL visualizations | Charts, tables, and metrics powered by ES|QL, rendered with Lens by default. If a dashboard contains data view-based visualizations, the agent asks to replace them with ES|QL equivalents when making changes. |
| Vega-Lite visualizations
|
Used for chart shapes that Lens can't express, such as small multiples, layered or combination charts, scatter plots, and bubble charts, or when you ask for a Vega or custom visualization. The agent supports Vega-Lite specifications only, not raw Vega. Shapes that Vega-Lite can't express, such as Sankey, radar, or network diagrams, fall back to the closest supported chart. |
| Markdown panels | Text panels for notes, headings, and other context. |
| Collapsible sections | Grouped panels that readers can expand or collapse. |
| Filter controls
|
Interactive filters that appear above the dashboard and let users filter data without editing queries. The agent can add and remove Options list, Range slider, and Time slider controls, and can proactively add Options list controls for useful categorical fields such as service or host names. A dashboard can contain only one Time slider control. |
| Custom panels
|
HTML and CSS layouts that other panel types can't express, such as status boards, KPI scorecards with colored badges, or panels that mix text with live ES|QL data. The agent creates a custom panel only when no other panel type fits, or when you ask for a custom or HTML panel. To change an existing custom panel through chat, open it on the dashboard and select Refine with chat. |
- Dashboards
- Chat with Elastic Agent Builder agents
- Discover tables in chat
- Create dashboards programmatically
- Agent Builder traces overview dashboard: a prebuilt, managed dashboard for monitoring agent activity from trace data