System OpenTelemetry Assets
| Version | 0.2.7
|
| Subscription level What's this? |
Basic |
| Developed by What's this? |
Elastic |
| Minimum Kibana version(s) | 9.0.0 8.18.0 |
To use beta integrations, go to the Integrations page in Kibana, scroll down, and toggle on the Display beta integrations option.
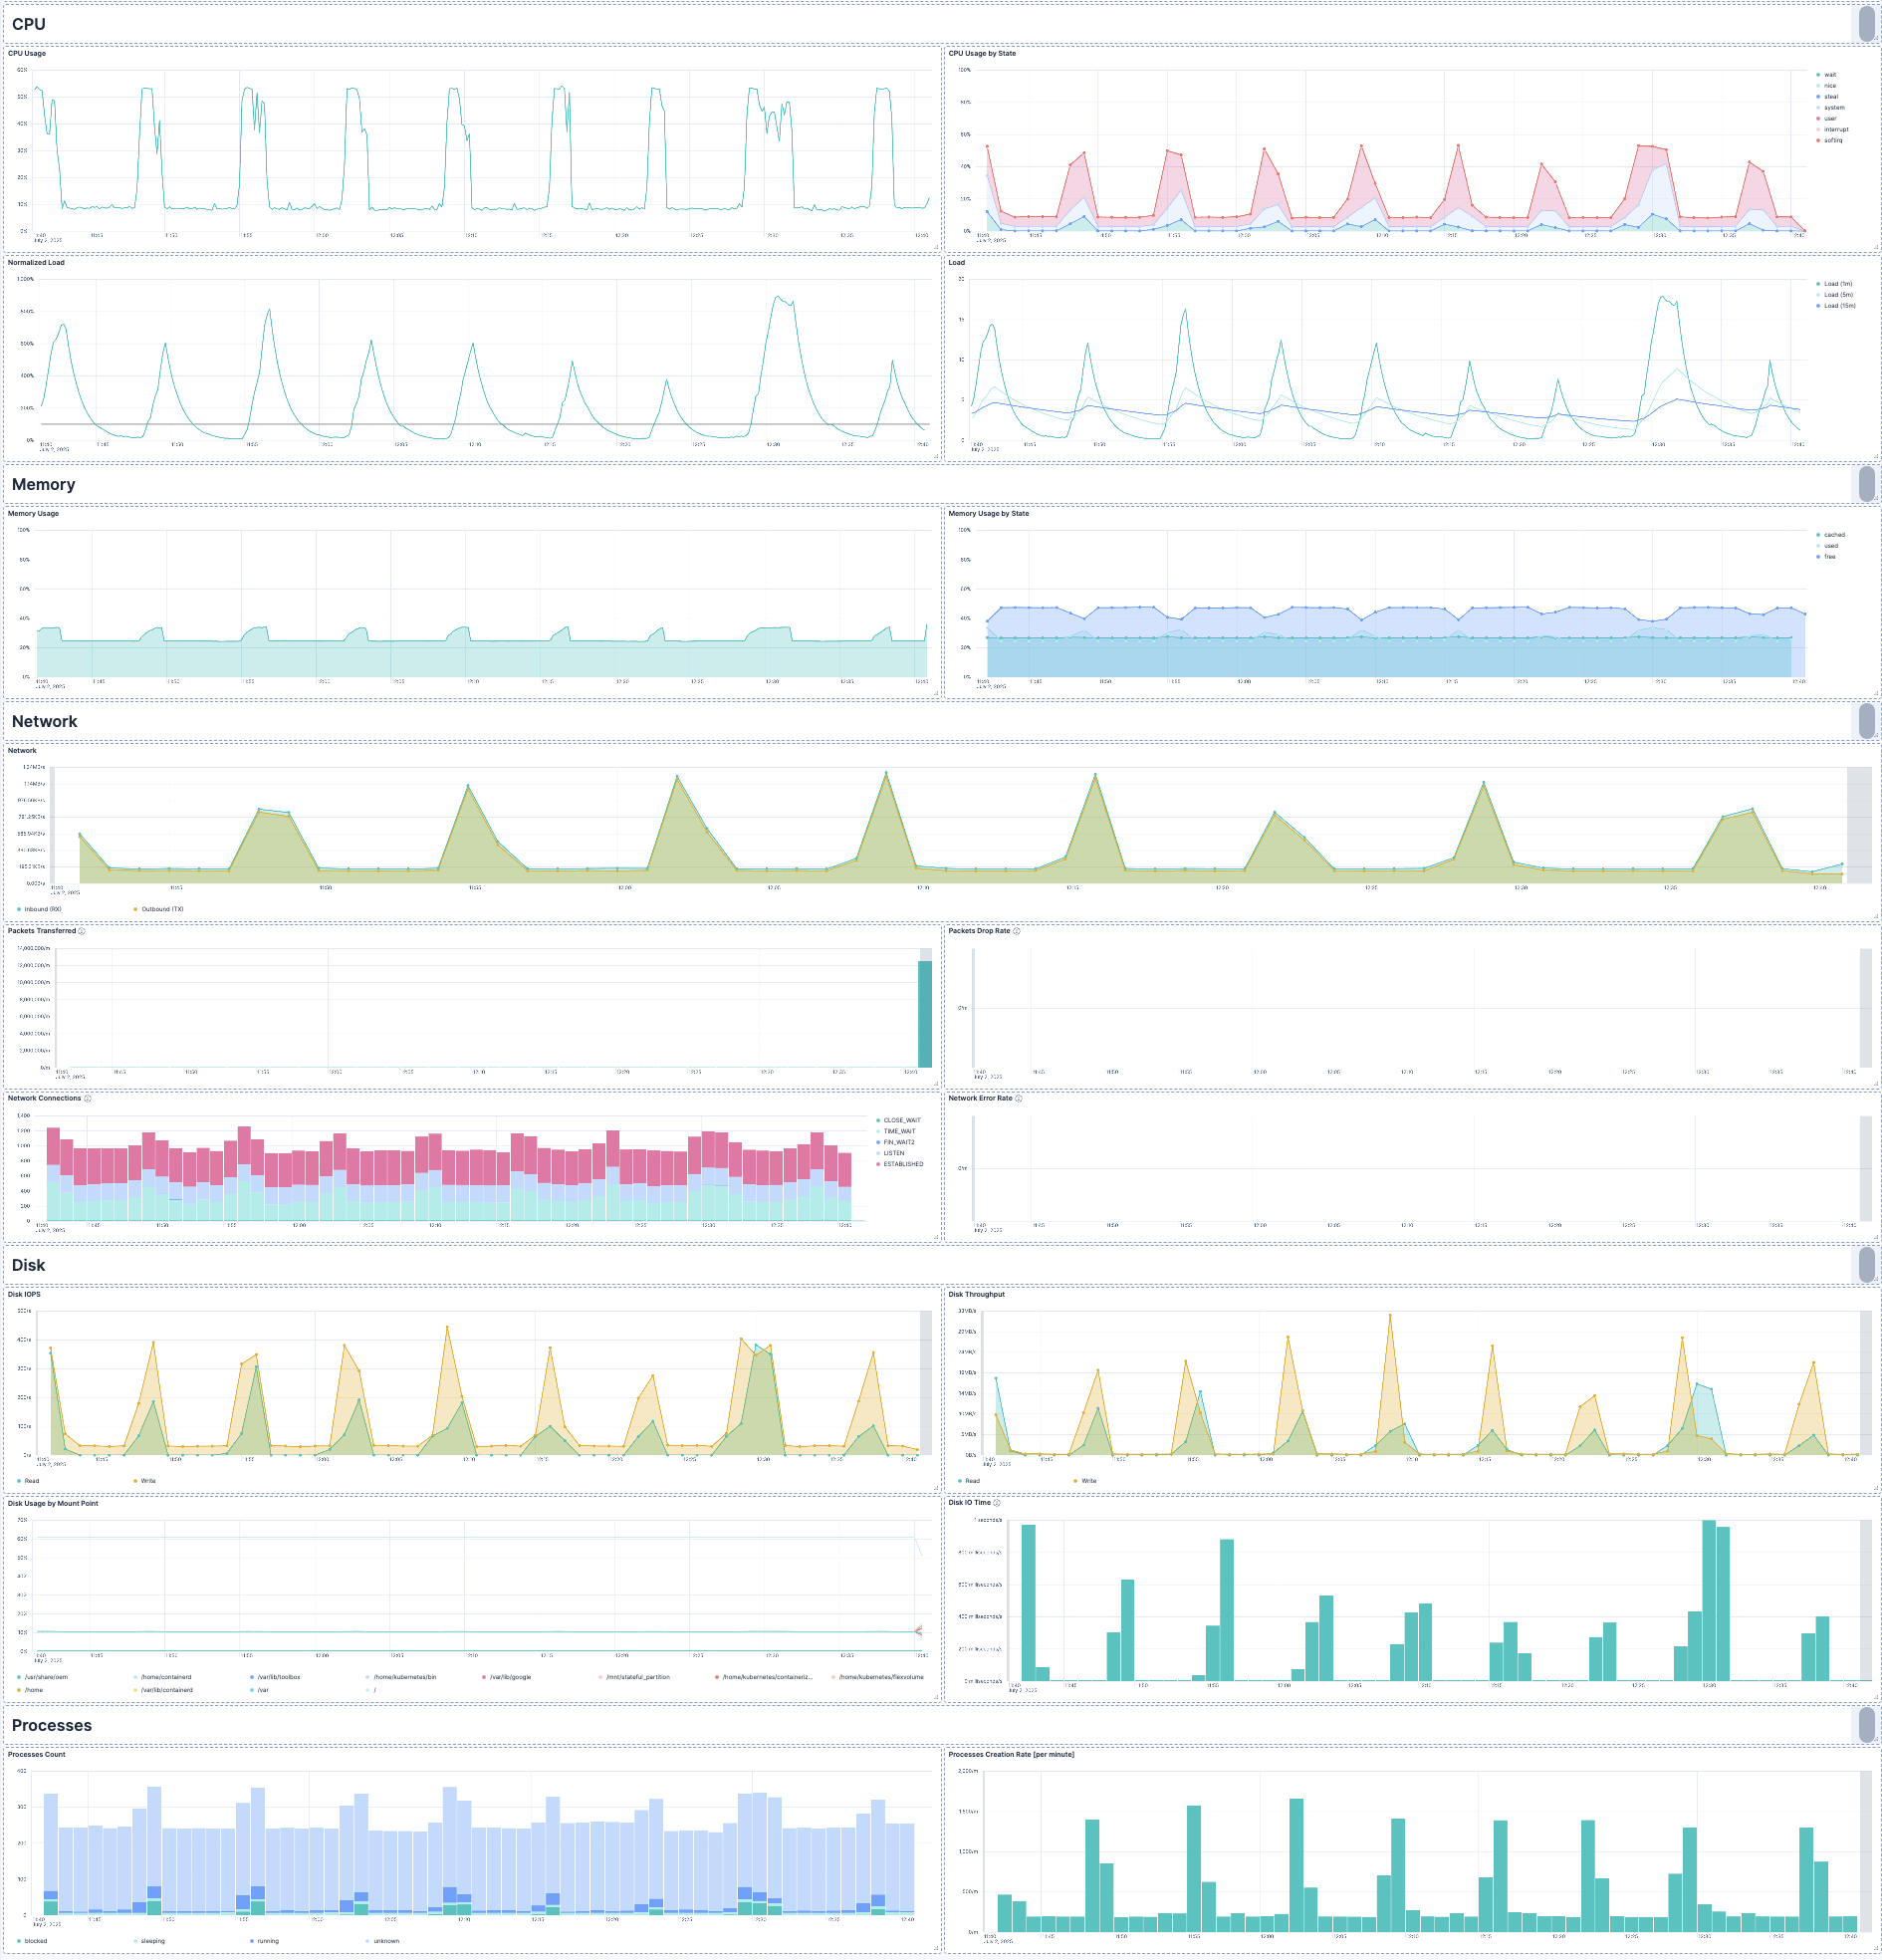
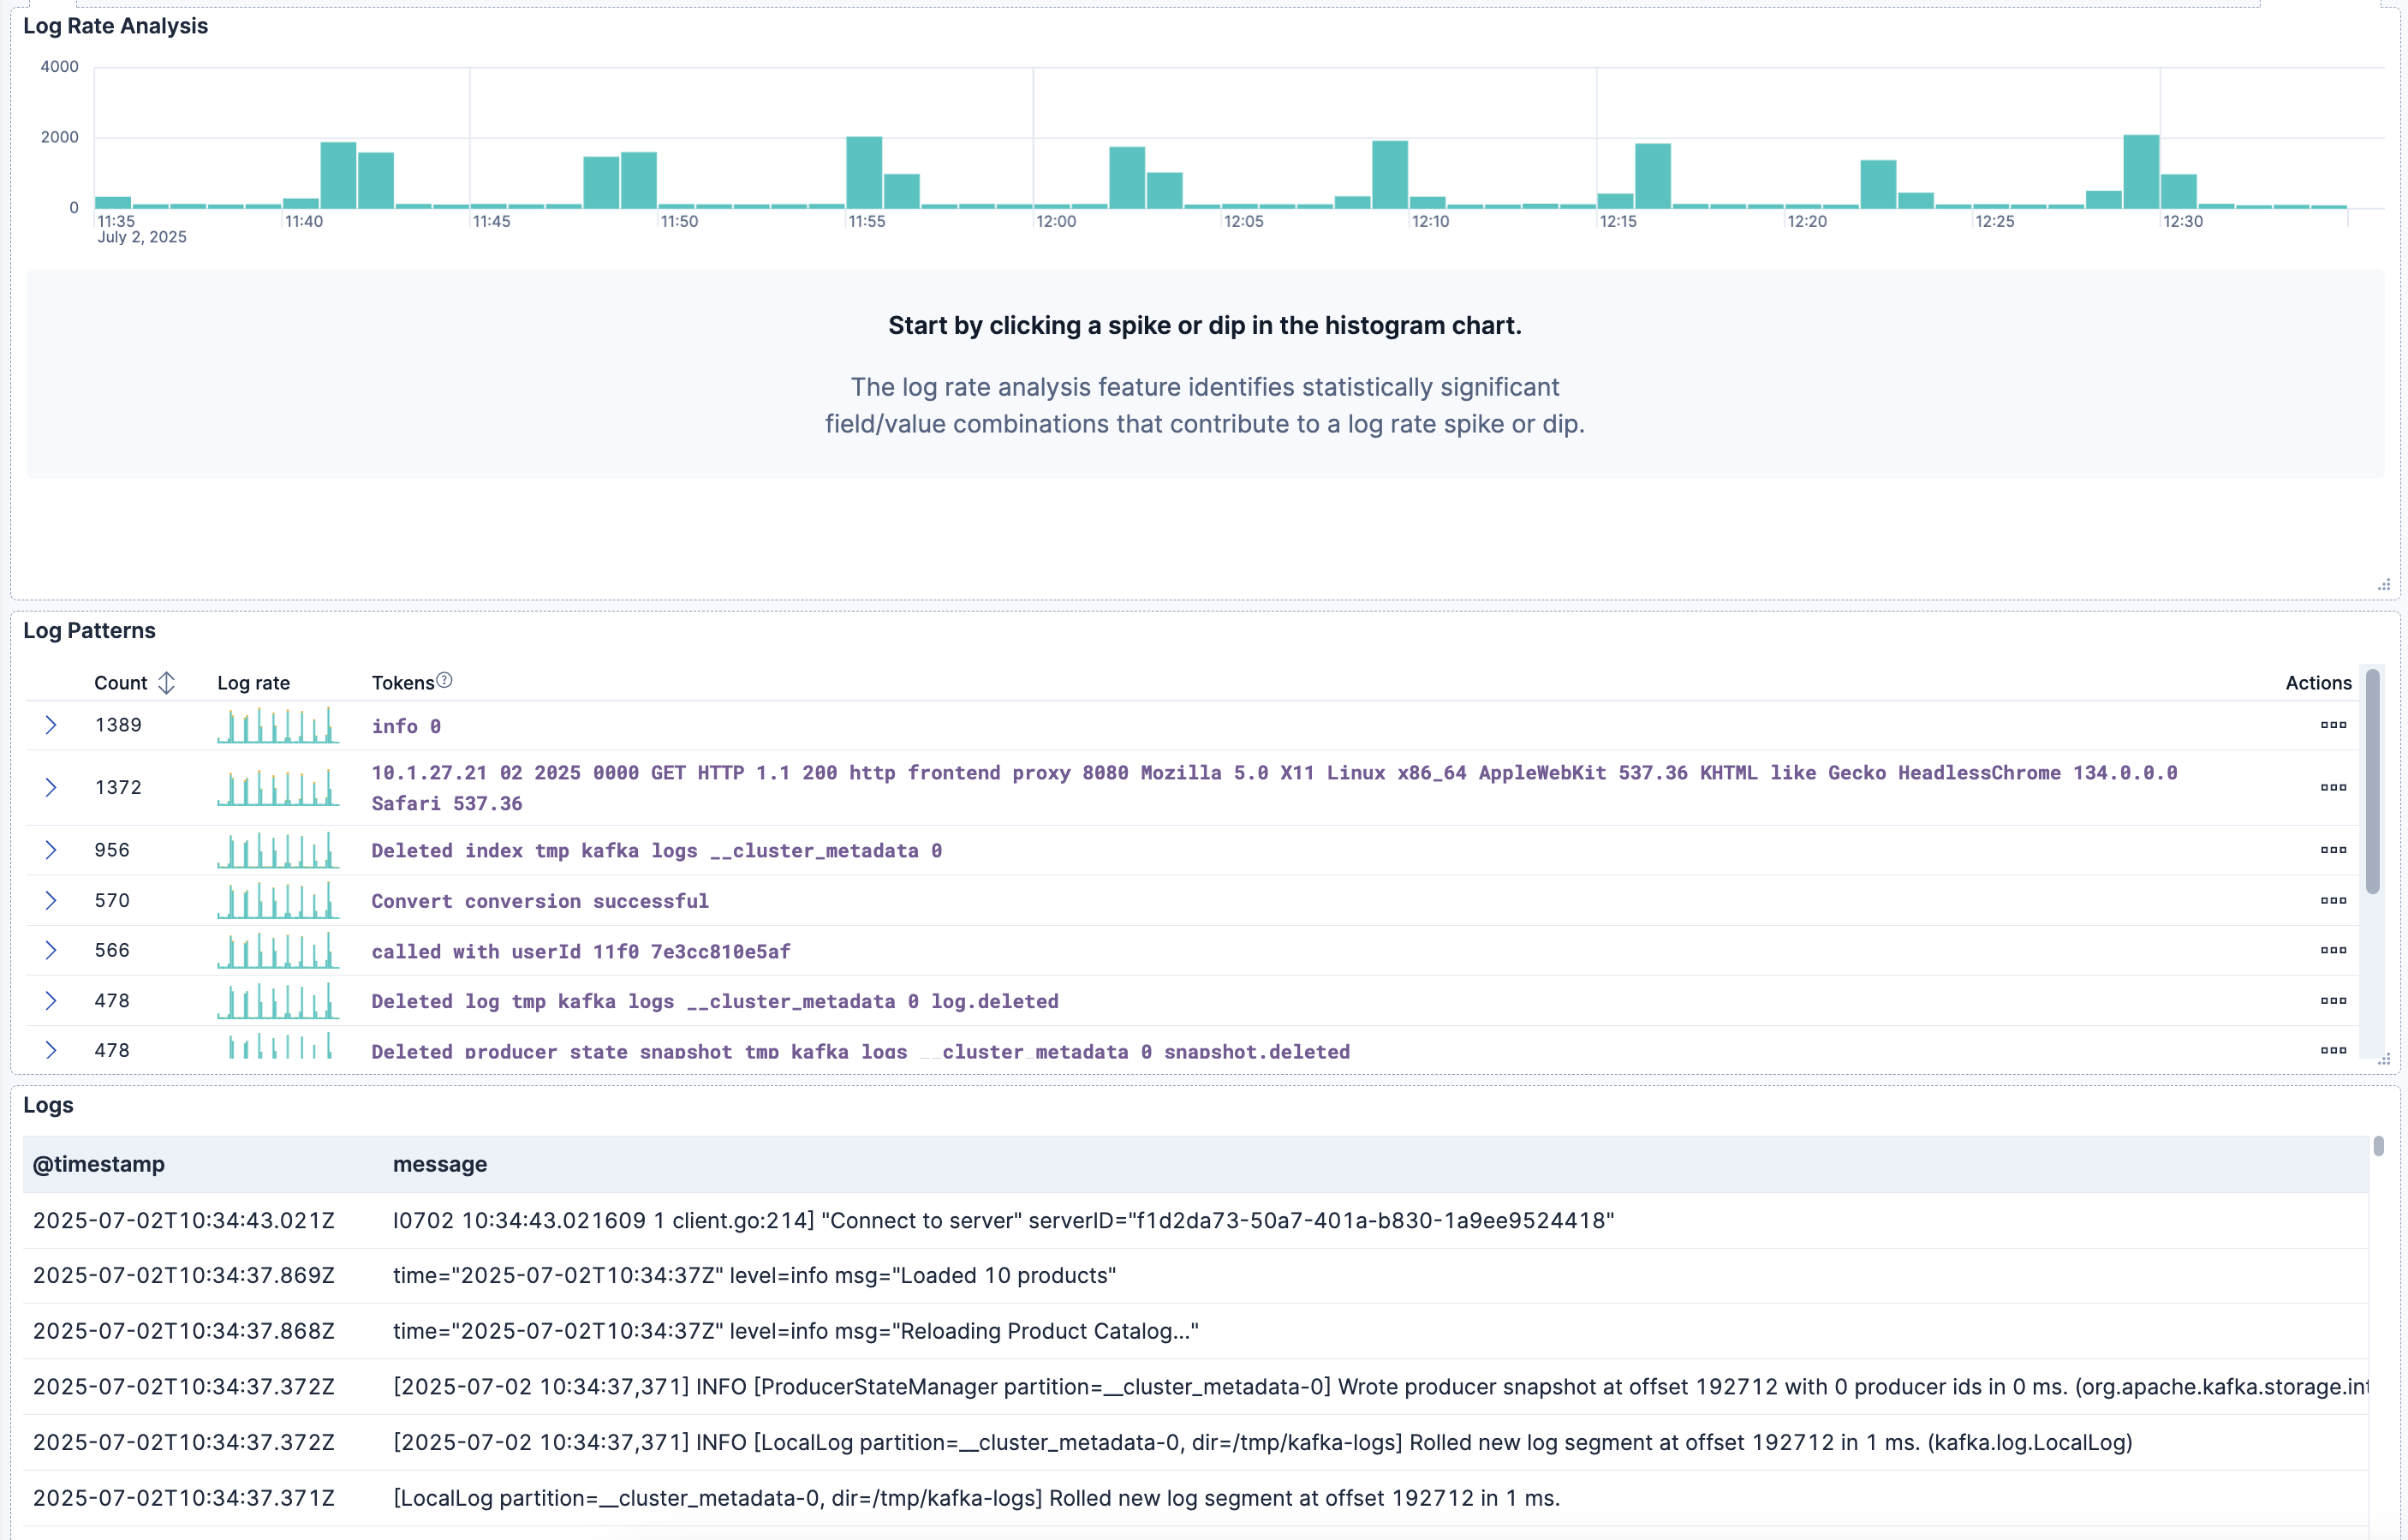
System OpenTelemetry Assets provides dashboards for visualizing OpenTelemetry hosts' metrics and logs.
Collect and ingest OpenTelemetry data from the Collector's hostmetrics receiver through:
- Elastic Distributions of OpenTelemetry
- Contrib or upstream OpenTelemetry Collector
Compatible hostmetrics receiver versions are version 0.102.0 or later.
If you're configuring your OpenTelemetry Collector so the dashboards in this package work as expected, start with Collector configuration, and then verify the required Available metrics.
The Elastic Distribution of OpenTelemetry (EDOT) Collector and the upstream Contrib Collector both include the hostmetrics receiver. Regardless of which Collector distribution you use, review the following snippets and add or adjust your Collector configuration to ensure the required metrics are enabled, as some of them are not enabled by default.
Make sure that your receivers section in the Collector configuration file is as follows:
# Receiver for CPU, Disk, Memory, and Filesystem metrics
hostmetrics/system:
  collection_interval: 60s
  scrapers:
    disk:
    filesystem:
    cpu:
      metrics:
        system.cpu.utilization:
          enabled: true
        system.cpu.logical.count:
          enabled: true
    memory:
      metrics:
        system.memory.utilization:
          enabled: true
    #process:
    #  mute_process_exe_error: true
    #  mute_process_io_error: true
    #  mute_process_user_error: true
    #  metrics:
    #    process.threads:
    #      enabled: true
    #    process.open_file_descriptors:
    #      enabled: true
    #    process.memory.utilization:
    #      enabled: true
    #    process.disk.operations:
    #      enabled: true
    network:
    processes:
    load:
# Receiver for CPU, Disk, Memory, and Filesystem metrics
hostmetrics/system:
  collection_interval: 60s
  scrapers:
    filesystem:
    memory:
      metrics:
        system.memory.utilization:
          enabled: true
    #process:
    #  mute_process_exe_error: true
    #  mute_process_io_error: true
    #  mute_process_user_error: true
    #  metrics:
    #    process.threads:
    #      enabled: true
    #    process.open_file_descriptors:
    #      enabled: true
    #    process.memory.utilization:
    #      enabled: true
    #    process.disk.operations:
    #      enabled: true
    network:
    processes:
    load:
Make sure that your processors section in the Collector configuration file is as follows:
processors:
  resourcedetection:
    detectors: ["system"]
    system:
      hostname_sources: ["os"]
      resource_attributes:
        host.name:
          enabled: true
        host.id:
          enabled: false
        host.arch:
          enabled: true
        host.cpu.vendor.id:
          enabled: true
        host.cpu.family:
          enabled: true
        host.cpu.model.id:
          enabled: true
        host.cpu.model.name:
          enabled: true
        host.cpu.stepping:
          enabled: true
        host.cpu.cache.l2.size:
          enabled: true
        os.description:
          enabled: true
        os.type:
          enabled: true
Make sure that the service section in your Collector configuration file includes the receiver and processor:
service:
    metrics/hostmetrics:
      receivers: [hostmetrics/system]
      processors: [resourcedetection]
      exporters: [elasticsearch/otel]
metrics/hostmetrics:
  receivers: [hostmetrics/system]
  processors: [resourcedetection]
  exporters: [otlp/ingest_metrics_traces]
For full functionality of the dashboards included in this content pack, you will need to ensure the following metrics are enabled in the hostmetrics receiver:
| Metric | Enabled by default in EDOT Collector | Enabled by default in upstream Contrib Collector |
|---|---|---|
| CPU | ||
system.cpu.time |
✅ | ✅ |
system.cpu.utilization |
✅ | ❌ |
system.cpu.logical.count |
✅ | ❌ |
| Load | ||
system.cpu.load_average.1m |
✅ | ✅ |
system.cpu.load_average.5m |
✅ | ✅ |
system.cpu.load_average.15m |
✅ | ✅ |
| Memory | ||
system.memory.usage |
✅ | ✅ |
system.memory.utilization |
✅ | ❌ |
| Network | ||
system.network.connections |
✅ | ✅ |
system.network.dropped |
✅ | ✅ |
system.network.errors |
✅ | ✅ |
system.network.io |
✅ | ✅ |
system.network.packets |
✅ | ✅ |
| Disk | ||
system.disk.io |
✅ | ✅ |
system.disk.io_time |
✅ | ✅ |
system.disk.operations |
✅ | ✅ |
| File System | ||
system.filesystem.usage |
✅ | ✅ |
| Processes | ||
system.processes.count |
✅ | ✅ |
system.processes.created |
✅ | ✅ |
For step-by-step instructions on how to ingest OpenTelemetry data using Elastic's distribution of the OpenTelemetry Collector, see the quickstart guide.
Also, it's recommended to enable the resourcedetection processor with detection of the following resource attributes explicitly enabled:
host.namehost.idhost.archhost.cpu.vendor.idhost.cpu.familyhost.cpu.model.idhost.cpu.model.namehost.cpu.steppinghost.cpu.cache.l2.sizeos.descriptionos.type
If individual widgets in the dashboard show errors that certain fields are not available, that might be an indicator of one of the following:
- For your use case, the missing data is not relevant (e.g. you are only running plain, local VMs, no
Cloudmetadata will be available). - Your Collector configuration does not enable all of the required metrics, or resource attributes.
For additional information, refer to:
- Scraper limitations with the
hostmetricsreceiver for certain systems. - Related EDOT Collector limitations for host metrics.
This integration includes one or more Kibana dashboards that visualizes the data collected by the integration. The screenshots below illustrate how the ingested data is displayed.
Changelog
| Version | Details | Minimum Kibana version |
|---|---|---|
| 0.2.7 | Enhancement (View pull request) Remove host.ip and host.mac from dashboard |
9.0.0 8.18.0 |
| 0.2.6 | Enhancement (View pull request) Use host.id so cloud metadata works with default attributes |
9.0.0 8.18.0 |
| 0.2.5 | Bug fix (View pull request) Clarify Collector configuration guidance for enabling required host metrics |
9.0.0 8.18.0 |
| 0.2.4 | Enhancement (View pull request) Update documentation with config examples |
9.0.0 8.18.0 |
| 0.2.3 | Bug fix (View pull request) Use metrics-* index pattern for dataviews |
9.0.0 8.18.0 |
| 0.2.2 | Enhancement (View pull request) Add opentelemetry category |
9.0.0 8.18.0 |
| 0.2.1 | Bug fix (View pull request) Remove adhoc dataviews |
9.0.0 8.18.0 |
| 0.2.0 | Enhancement (View pull request) Add discovery datasets field |
9.0.0 8.18.0 |
| 0.1.0 | Enhancement (View pull request) Initial version of the System OpenTelemetry Assets content pack |
9.0.0 8.18.0 |

