Elastic Package Registry
| Version | 0.4.3
|
| Subscription level What's this? |
Basic |
| Developed by What's this? |
Elastic |
| Ingestion method(s) | Prometheus |
| Minimum Kibana version(s) | 9.4.4 |
To use pre-release integrations, go to the Integrations page in Kibana, scroll down, and toggle on the Display beta integrations option.
The Elastic Package Registry integration collects metrics from your Elastic Package Registry service.
Use the data from this integration to monitor the status of your services — for example, how many packages are indexed, which versions your services are running, or whether there are too many requests with 404 or 500 status codes.
This integration is compatible with Elastic Package Registry version 1.10.0 and later.
The integration uses the Prometheus input to collect metrics from the /metrics endpoint exposed by the Elastic Package Registry service.
The Elastic Package Registry integration collects the following type of data:
- Metrics: Telemetry data from the
/metricsendpoint that gives you insight into the state of the services. See Metrics for details.
You need Elasticsearch for storing and searching your data and Kibana for visualizing and managing it. You can use our hosted Elasticsearch Service on Elastic Cloud, which is recommended, or self-manage the Elastic Stack on your own hardware.
Elastic Agent must be installed. For more details, check the Elastic Agent installation instructions. You can install only one Elastic Agent per host.
Elastic Agent is required to stream data from the Elastic Package Registry metrics endpoint and ship the data to Elastic, where the events will then be processed via the integration's ingest pipelines.
To enable telemetry in your Elastic Package Registry instance, set the metrics address parameter. Alternatively, set the EPR_METRICS_ADDRESS environment variable:
package-registry -metrics-address 0.0.0.0:9000

EPR_METRICS_ADDRESS="0.0.0.0:9000" package-registry
Remember to expose the port used in the above setting (for example, 9000) in your deployments: k8s, docker-compose, and so on.
For step-by-step instructions on how to set up an integration, see the Getting started guide.
Verify that the metrics endpoint is enabled by making an HTTP request to http://localhost:9000/metrics on your package registry instance.
For more information on architectures that can be used for scaling this integration, check the Ingest Architectures documentation.
This integration uses the prometheus_input package. The following input is used:
These inputs can be used with this integration:
The metrics data stream provides Prometheus metrics from the /metrics endpoint of the Elastic Package Registry service.
Exported fields
| Field | Description | Type | Unit | Metric Type |
|---|---|---|---|---|
| @timestamp | Event timestamp. | date | ||
| data_stream.dataset | Data stream dataset. | constant_keyword | ||
| data_stream.namespace | Data stream namespace. | constant_keyword | ||
| data_stream.type | Data stream type. | constant_keyword | ||
| ecs.version | ECS version this event conforms to. ecs.version is a required field and must exist in all events. When querying across multiple indices -- which may conform to slightly different ECS versions -- this field lets integrations adjust to the schema version of the events. |
keyword | ||
| error.message | Error message. | match_only_text | ||
| event.duration | Duration of the event in nanoseconds. If event.start and event.end are known this value should be the difference between the end and start time. |
long | ||
| event.ingested | Timestamp when an event arrived in the central data store. This is different from @timestamp, which is when the event originally occurred. It's also different from event.created, which is meant to capture the first time an agent saw the event. In normal conditions, assuming no tampering, the timestamps should chronologically look like this: @timestamp < event.created < event.ingested. |
date | ||
| event.kind | This is one of four ECS Categorization Fields, and indicates the highest level in the ECS category hierarchy. event.kind gives high-level information about what type of information the event contains, without being specific to the contents of the event. For example, values of this field distinguish alert events from metric events. The value of this field can be used to inform how these kinds of events should be handled. They may warrant different retention, different access control, it may also help understand whether the data is coming in at a regular interval or not. |
keyword | ||
| input.name | Sample field to be added | constant_keyword | ||
| package_registry.http.request_duration_seconds.histogram | A histogram of latencies for requests to the http server | histogram | ||
| package_registry.http.request_size_bytes.histogram | A histogram of sizes of requests to the http server | histogram | ||
| package_registry.http.response_size_bytes.histogram | A histogram of response sizes for requests to the http server | histogram | ||
| package_registry.http_requests_total.counter | Cumulative count of requests to the http server (first scrape) | double | counter | |
| package_registry.http_requests_total.rate | Rate of requests to the http server | double | gauge | |
| package_registry.in_flight_requests | Requests currently being served by the http server | double | gauge | |
| package_registry.indexer.get_duration_seconds.histogram | A histogram of latencies for get processes run by the indexer | histogram | ||
| package_registry.labels.code | HTTP Code | keyword | ||
| package_registry.labels.component | Component type of the storage (statics, artifacts, signature...) | keyword | ||
| package_registry.labels.indexer | Indexer type | keyword | ||
| package_registry.labels.instance | Elastic Package Registry instance | keyword | ||
| package_registry.labels.job | keyword | |||
| package_registry.labels.location | Storage location (remote or local) | keyword | ||
| package_registry.labels.method | HTTP method | keyword | ||
| package_registry.labels.path | Path of the HTTP request. | keyword | ||
| package_registry.labels.version | Elastic Package Registry version. | keyword | ||
| package_registry.number_indexed_packages | Number of indexed packages | integer | gauge | |
| package_registry.start_time | Date where Elastic Package Registry started | date | ||
| package_registry.start_time_seconds | Start time of the process since unix epoch in seconds | double | s | gauge |
| package_registry.storage_indexer.update_index_duration_seconds.histogram | A histogram of latencies for update index processes run by the storage indexer | histogram | ||
| package_registry.storage_indexer.update_index_error_total.counter | Cumulative count of update index processes that finished with error in the storage indexer (first scrape) | double | counter | |
| package_registry.storage_indexer.update_index_error_total.rate | Rate of update index processes that finished with error in the storage indexer | double | gauge | |
| package_registry.storage_indexer.update_index_success_total.counter | Cumulative count of update index processes that finished with success in the storage indexer (first scrape) | double | counter | |
| package_registry.storage_indexer.update_index_success_total.rate | Rate of update index processes that finished with success in the storage indexer | double | gauge | |
| package_registry.storage_requests_total.counter | Cumulative count of requests performed to the storage (first scrape) | double | counter | |
| package_registry.storage_requests_total.rate | Rate of requests performed to the storage | double | gauge | |
| package_registry.uptime | Elastic Package Registry uptime in seconds | long | s | counter |
| prometheus.*.counter | Prometheus counter metric | object | ||
| prometheus.*.histogram | Prometheus histogram metric | object | ||
| prometheus.*.rate | Prometheus rate counter metric | object | ||
| prometheus.*.value | Prometheus gauge metric | object | ||
| prometheus.labels.* | Prometheus metric labels | object | ||
| prometheus.metrics.* | Prometheus metric | object | ||
| service.address | Address where data about this service was collected from. This should be a URI, network address (ipv4:port or [ipv6]:port) or a resource path (sockets). | keyword | ||
| service.type | The type of the service data is collected from. The type can be used to group and correlate logs and metrics from one service type. Example: If logs or metrics are collected from Elasticsearch, service.type would be elasticsearch. |
keyword | ||
| tags | List of keywords used to tag each event. | keyword |
Example
{
    "@timestamp": "2026-07-08T09:31:59.245Z",
    "agent": {
        "ephemeral_id": "fade0327-0237-4f67-9d22-4d09f69039f6",
        "id": "716e7502-c0df-47e3-a3da-81006316903f",
        "name": "elastic-agent-76898",
        "type": "metricbeat",
        "version": "9.4.4"
    },
    "data_stream": {
        "dataset": "elastic_package_registry.metrics",
        "namespace": "28309",
        "type": "metrics"
    },
    "ecs": {
        "version": "8.3.1"
    },
    "elastic_agent": {
        "id": "716e7502-c0df-47e3-a3da-81006316903f",
        "snapshot": true,
        "version": "9.4.4"
    },
    "event": {
        "agent_id_status": "verified",
        "dataset": "elastic_package_registry.metrics",
        "duration": 5238417,
        "ingested": "2026-07-08T09:32:01Z",
        "kind": "metric",
        "module": "prometheus"
    },
    "host": {
        "architecture": "aarch64",
        "containerized": false,
        "hostname": "elastic-agent-76898",
        "ip": [
            "172.29.0.2",
            "172.18.0.4"
        ],
        "mac": [
            "0E-1F-A2-E2-9F-06",
            "F6-37-22-72-B7-02"
        ],
        "name": "elastic-agent-76898",
        "os": {
            "family": "",
            "kernel": "6.12.76-linuxkit",
            "name": "Wolfi",
            "platform": "wolfi",
            "type": "linux",
            "version": "20230201"
        }
    },
    "metricset": {
        "name": "collector",
        "period": 30000
    },
    "package_registry": {
        "http": {
            "request_duration_seconds": {
                "histogram": {
                    "counts": [
                        0,
                        0,
                        0,
                        0,
                        0,
                        0,
                        0,
                        0,
                        0,
                        0,
                        0,
                        0
                    ],
                    "values": [
                        0.0025,
                        0.0075,
                        0.0175,
                        0.037500000000000006,
                        0.07500000000000001,
                        0.175,
                        0.375,
                        0.75,
                        1.75,
                        3.75,
                        7.5,
                        10
                    ]
                }
            },
            "request_size_bytes": {
                "histogram": {
                    "counts": [
                        0,
                        0,
                        0,
                        0,
                        0,
                        0,
                        0,
                        0,
                        0,
                        0
                    ],
                    "values": [
                        8,
                        24,
                        48,
                        96,
                        192,
                        384,
                        768,
                        33280,
                        163840,
                        262144
                    ]
                }
            },
            "response_size_bytes": {
                "histogram": {
                    "counts": [
                        0,
                        0,
                        0,
                        0,
                        0,
                        0,
                        0,
                        0,
                        0,
                        0
                    ],
                    "values": [
                        8,
                        24,
                        48,
                        96,
                        192,
                        384,
                        768,
                        33280,
                        163840,
                        262144
                    ]
                }
            }
        },
        "http_requests_total": {
            "counter": 27
        },
        "labels": {
            "code": "200",
            "instance": "svc-elastic_package_registry:9110",
            "job": "prometheus",
            "method": "get",
            "path": "/"
        }
    },
    "service": {
        "address": "http://svc-elastic_package_registry:9110/metrics",
        "type": "elastic_package_registry"
    }
}
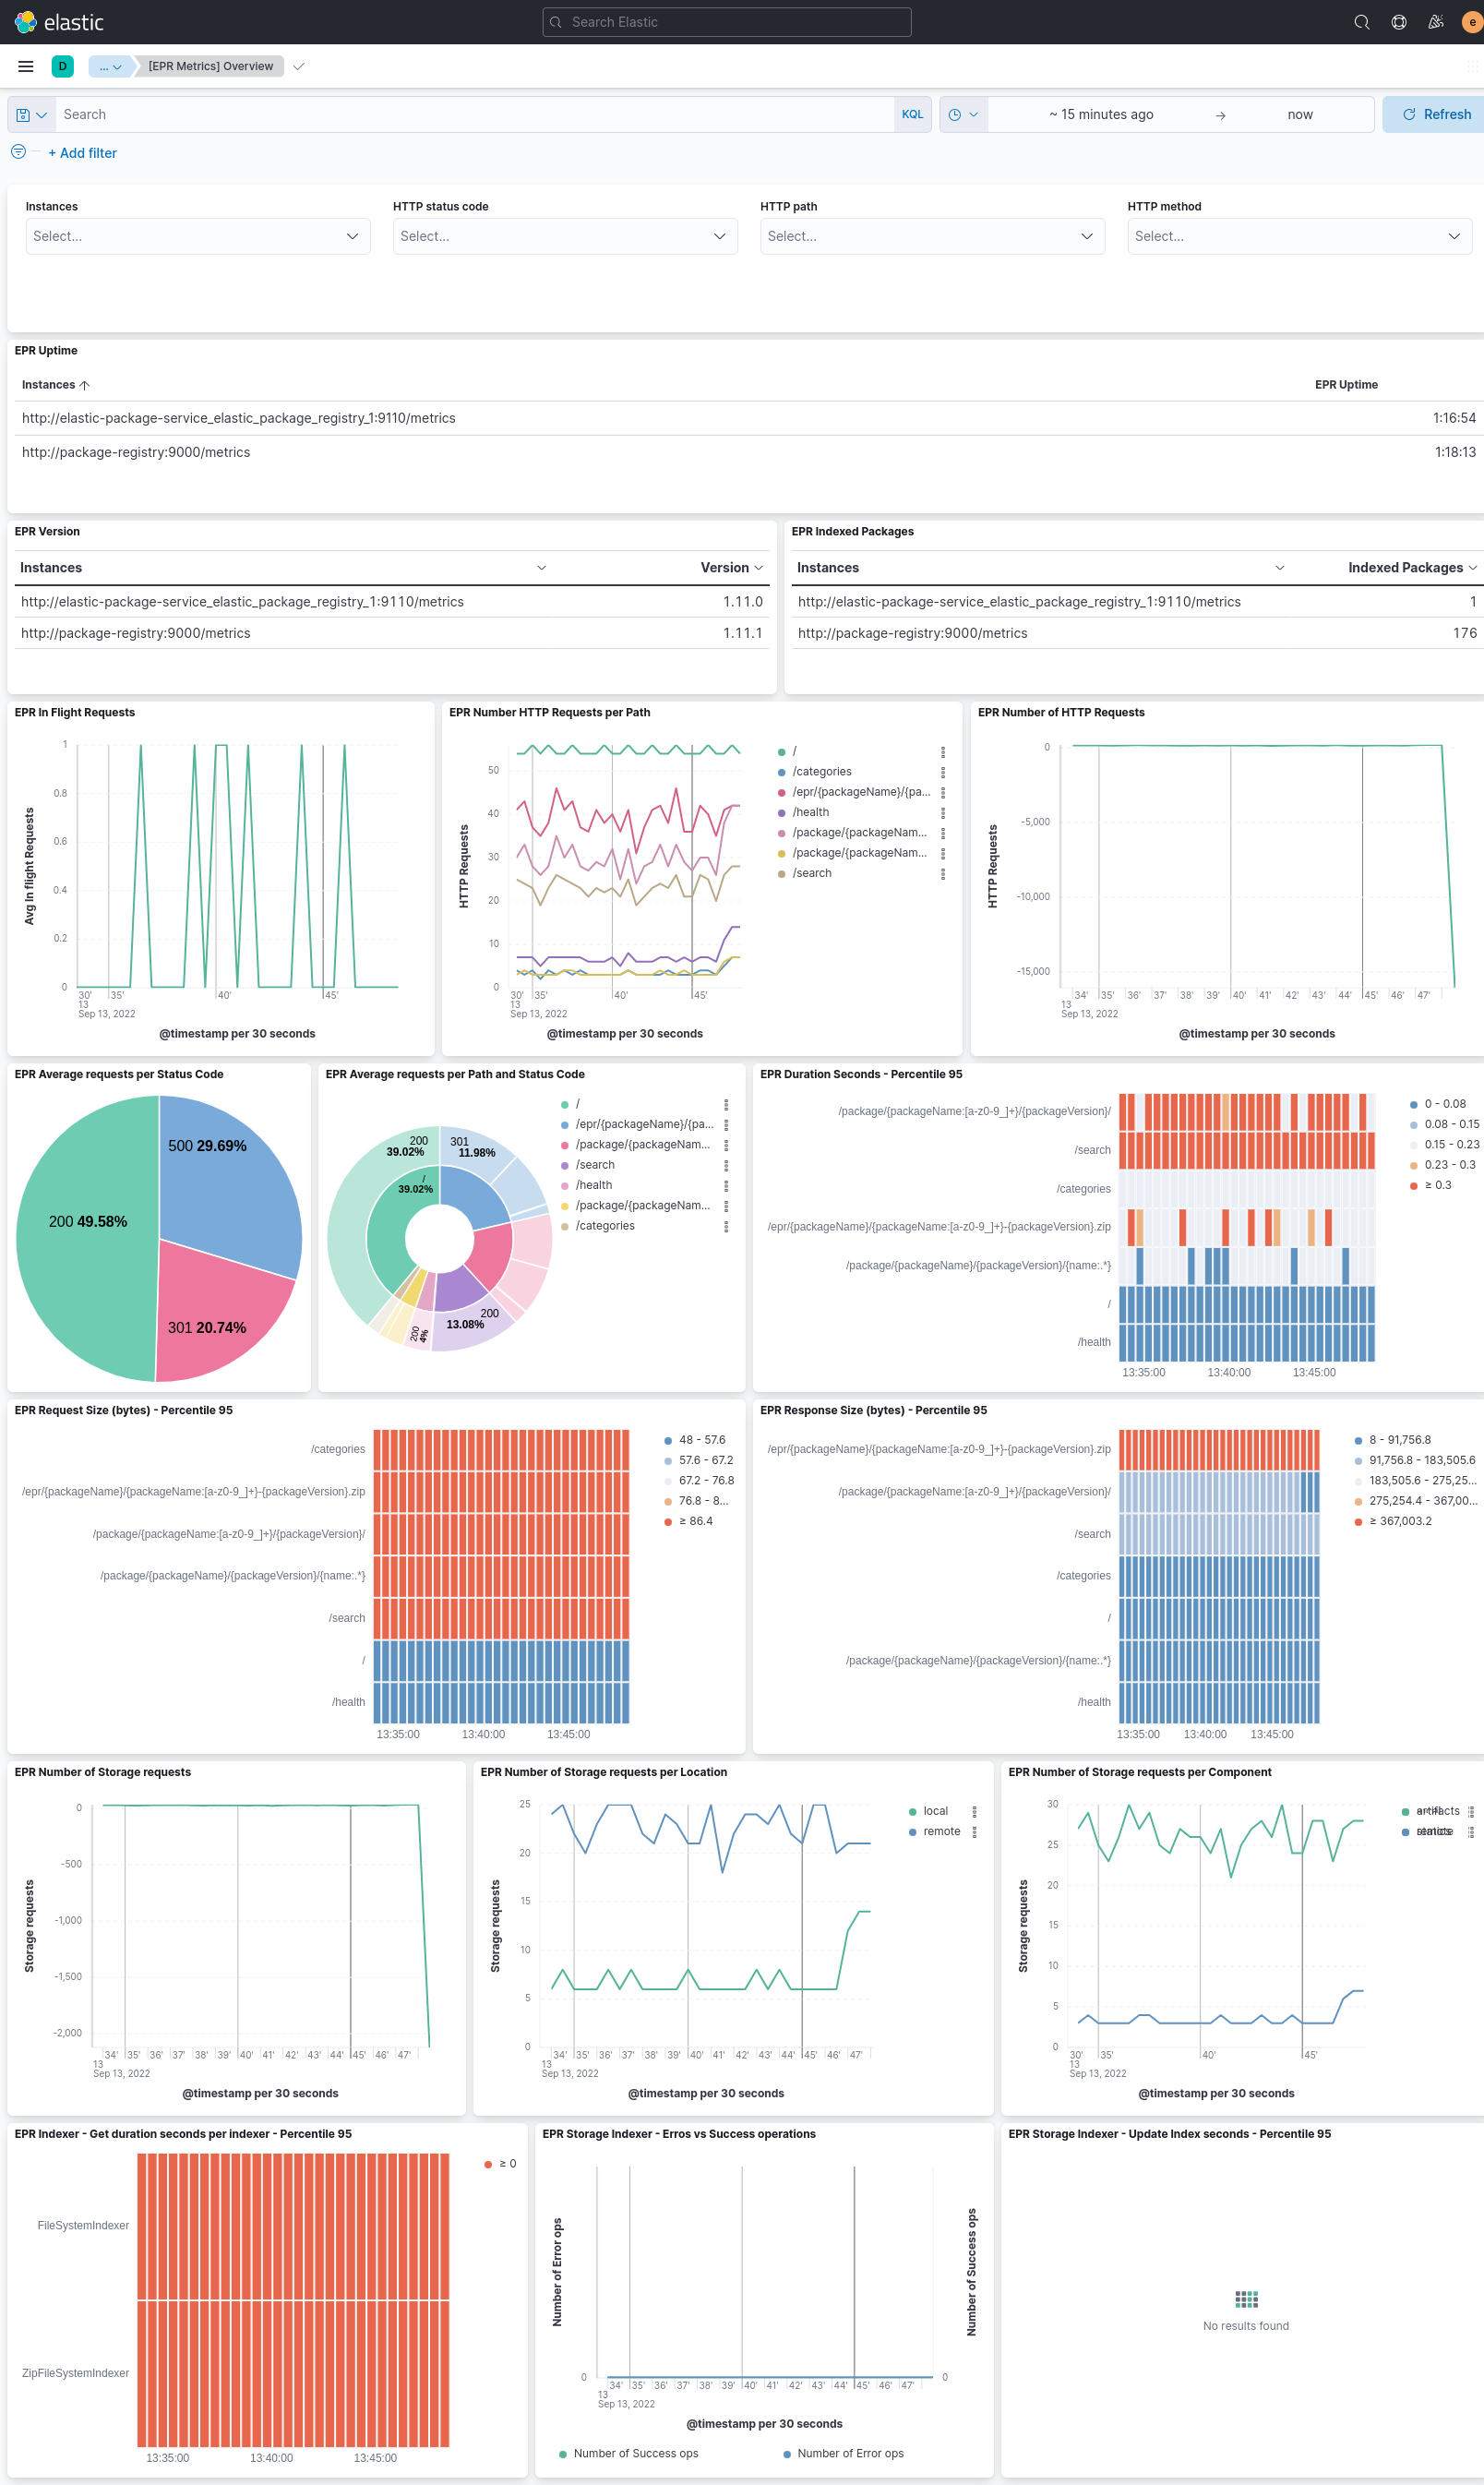
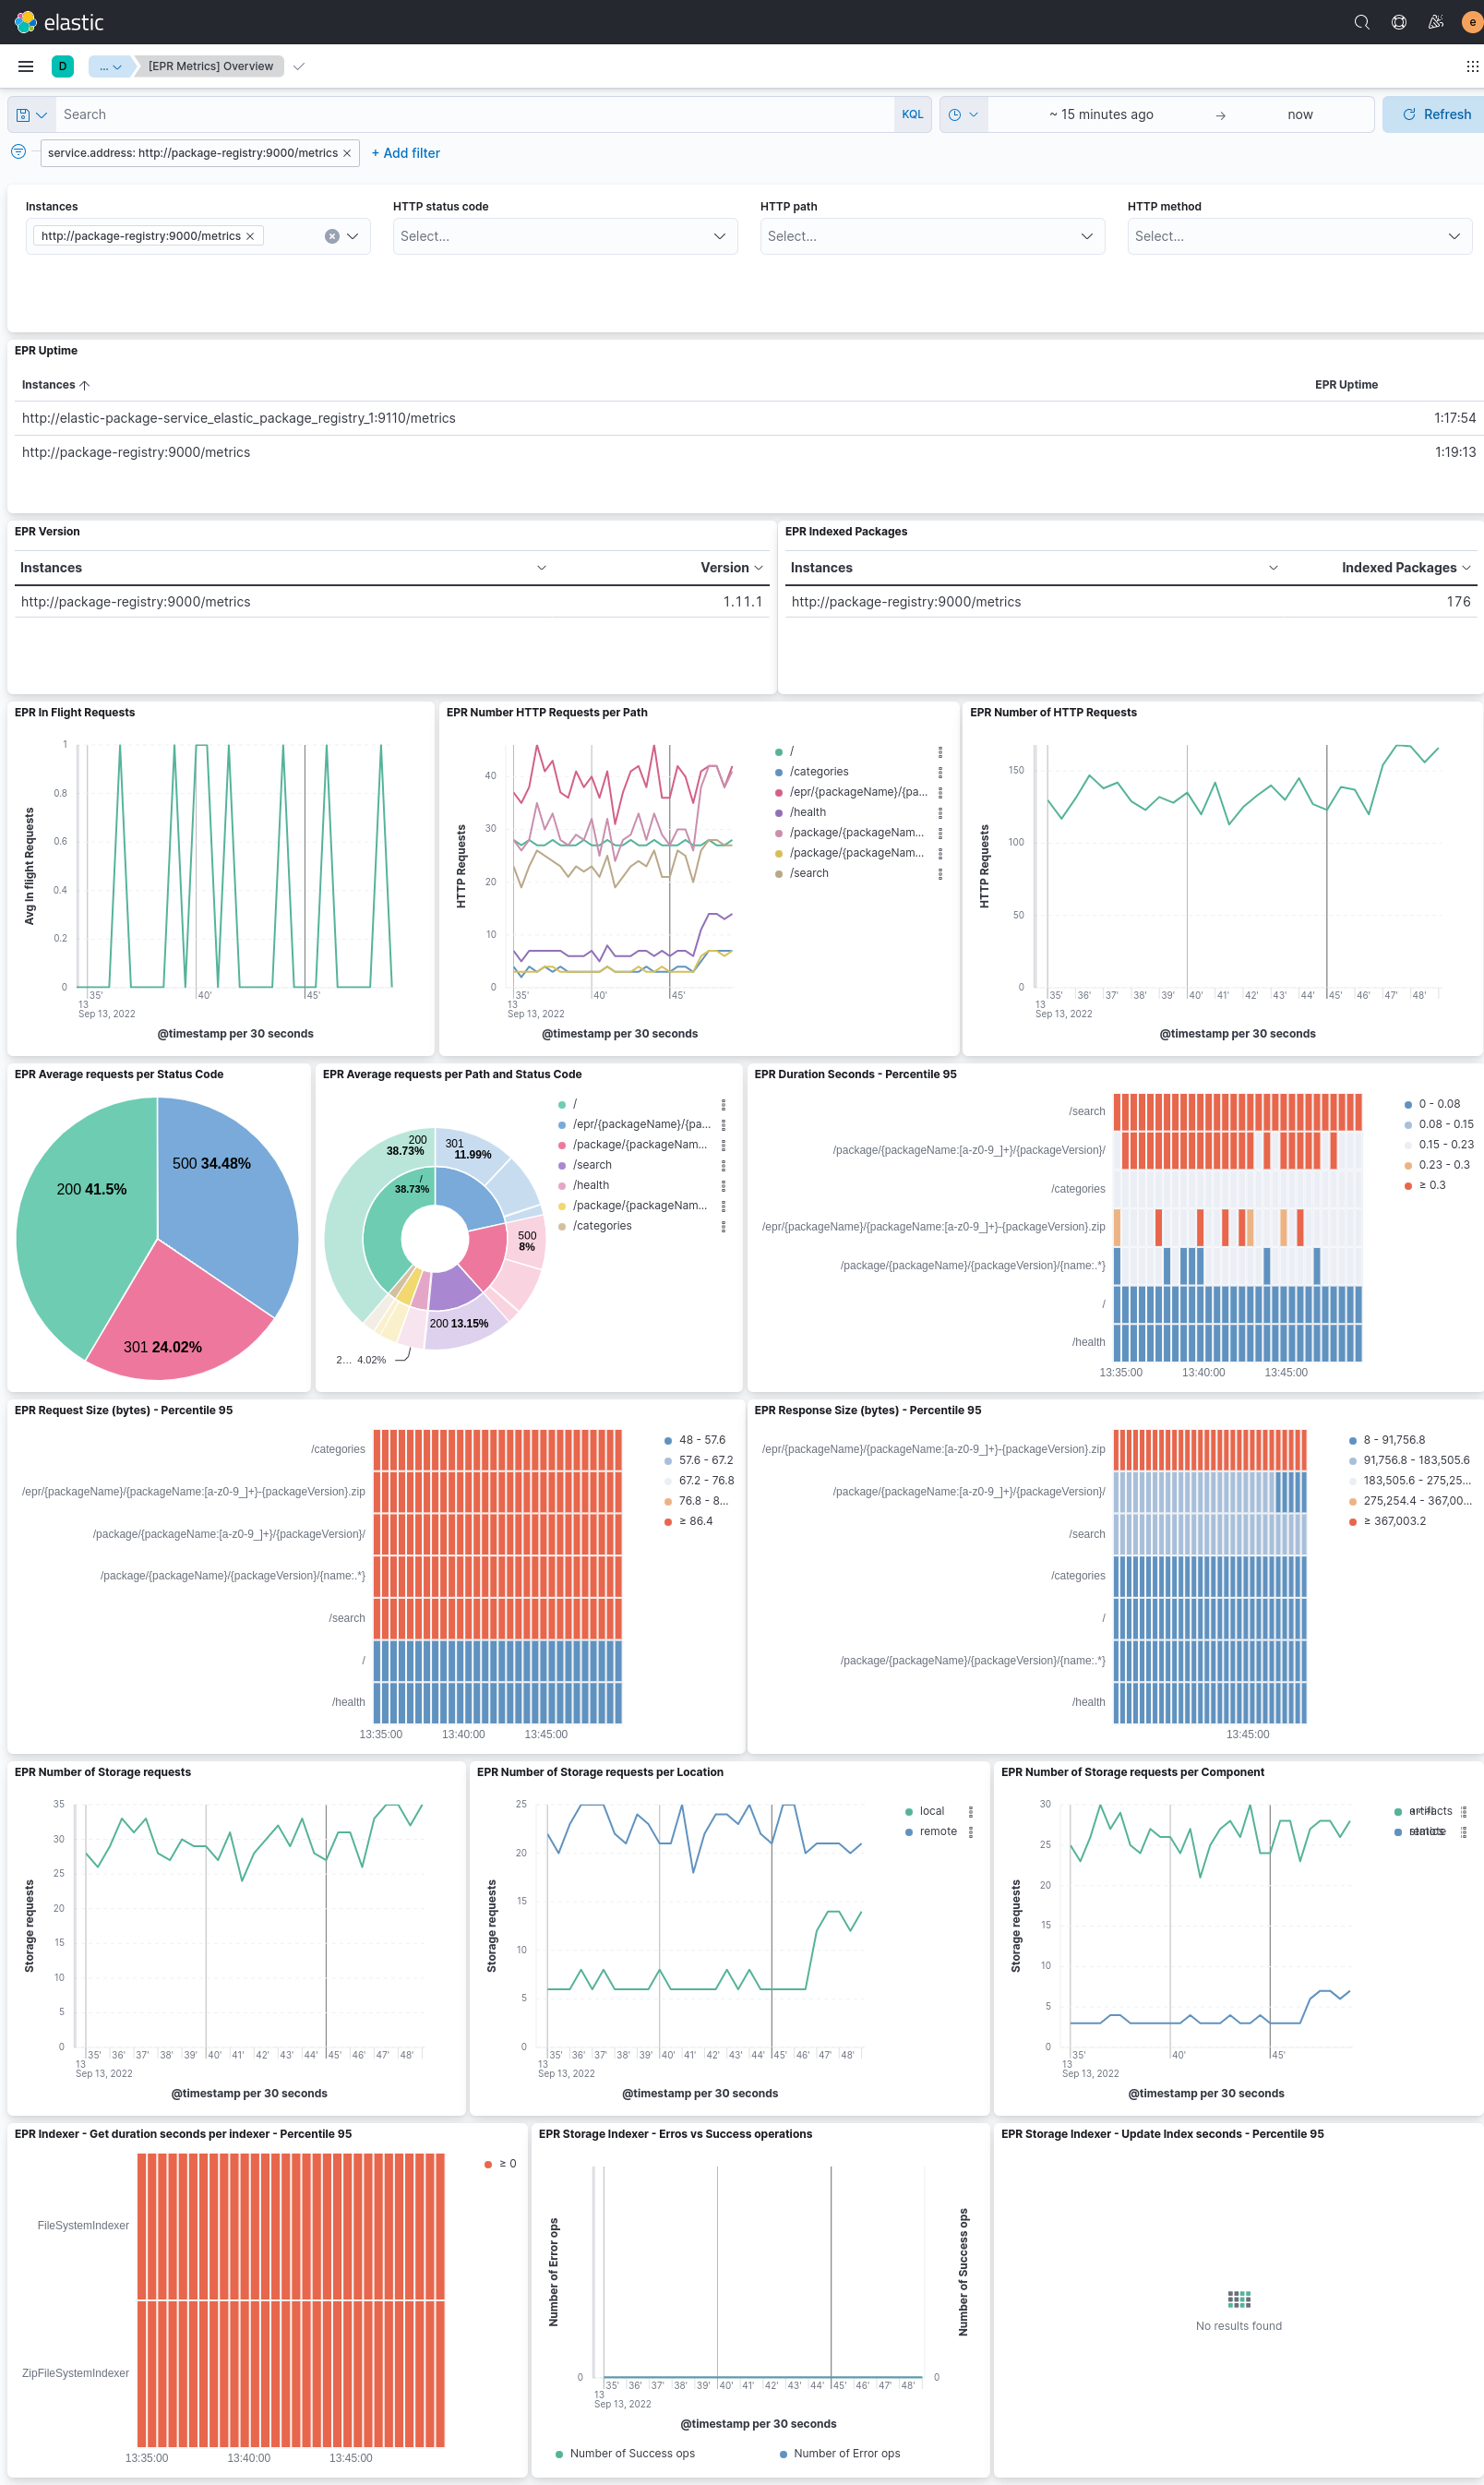
This integration includes one or more Kibana dashboards that visualizes the data collected by the integration. The screenshots below illustrate how the ingested data is displayed.
Changelog
| Version | Details | Minimum Kibana version |
|---|---|---|
| 0.4.3 | Bug fix (View pull request) Regenerate README with elastic-package 0.127.0 to include fields from the input package. |
9.4.4 |
| 0.4.2 | Bug fix (View pull request) Remove empty ILM policies section from the README. |
9.4.4 |
| 0.4.1 | Enhancement (View pull request) Bump prometheus_input input dependency from 1.0.1 to 1.0.2. |
9.4.4 |
| 0.4.0 | Enhancement (View pull request) Update package to use required input prometheus_input Enhancement (View pull request) Add support for stack 9.4.4 Bug fix (View pull request) Fix counter metric field types from long to double to match Prometheus collector output Enhancement (View pull request) Migrate legacy overview dashboard to updated Kibana Lens format for 9.4.4 compatibility. |
9.4.4 |
| 0.3.1 | Bug fix (View pull request) Update links to getting started docs |
9.0.0 8.0.0 |
| 0.3.0 | Enhancement (View pull request) Add support for stack 9.0 |
9.0.0 8.0.0 |
| 0.2.0 | Enhancement (View pull request) Fix legacy dashboards. |
8.0.0 |
| 0.1.0 | Enhancement (View pull request) Ensure event.kind is correctly set for pipeline errors. |
8.0.0 |
| 0.0.7 | Bug fix (View pull request) Fix invalid TSDS metric type for package_registry.start_time field |
8.0.0 |
| 0.0.6 | Enhancement (View pull request) First iteration to support multiple instances in dashboards |
8.0.0 |
| 0.0.5 | Enhancement (View pull request) Remove histogram.counts and histogram.values definitions |
8.0.0 |
| 0.0.4 | Enhancement (View pull request) Set Elastic Package Registry logo |
8.0.0 |
| 0.0.3 | Enhancement (View pull request) Update indexer metrics related to get operations |
8.0.0 |
| 0.0.2 | Enhancement (View pull request) Remove release experimental field |
8.0.0 |
| 0.0.1 | Enhancement (View pull request) Initial version of the Elastic Package Registry package |
— |