Kolide Integration for Elastic
| Version | 0.4.0
|
| Managed integration release status |
|
| Subscription level What's this? |
Basic |
| Developed by What's this? |
Elastic |
| Ingestion method(s) | API, AWS S3, Google Cloud Storage, Webhook |
| Minimum Kibana version(s) | 9.1.0 8.19.0 |
You can use this integration as an Elastic Managed integration on Elastic Cloud Hosted deployments running this version or later.
To use pre-release integrations, go to the Integrations page in Kibana, scroll down, and toggle on the Display beta integrations option.
When using this integration as an Elastic Managed integration, only the following data streams are available: audit, auth, deprovisioned_person, device, issues, people, and request. These data streams use inputs compatible with the Elastic Managed deployment mode. Other data streams (Kolide device check-run results, Kolide osquery result logs, Kolide osquery status logs, and webhook) require AWS S3, Google Cloud Storage, or HTTP Endpoint inputs, which are not supported in the Elastic Managed deployment mode. To collect data from these data streams, use Elastic Agent.
The Kolide integration for Elastic collects device-trust and endpoint-compliance logs from Kolide (by 1Password). It ingests authentication sessions, posture issues, approval-workflow requests, device inventory, trust-status changes, people identity records, and administrative audit events. The integration normalizes these logs to the Elastic Common Schema (ECS) so you can use them for search, visualization, and detection in Elastic.
This integration works with the current Kolide Device Trust platform ("Kolide K2"), its public REST API (version 2026-04-07), and webhooks. It doesn't support the legacy open-source Kolide Fleet (osquery) product.
This integration is compatible with Elastic Stack version 8.19.0 or later.
The integration supports four collection methods that you can choose between and combine when you configure it:
- Webhooks (HTTP endpoint): Kolide pushes events in near real time to an HTTP endpoint that Elastic Agent exposes. This is the recommended method for low-latency device-compliance data. Each delivery is signed with an HMAC-SHA256 signature for verification.
- REST API (polling): Elastic Agent periodically polls the Kolide REST API and collects records using cursor-based pagination and timestamp filters where supported. This is useful for backfill and for fuller resource records.
- AWS S3 (Kolide Log Pipeline): Kolide's Log Pipeline writes objects to a customer-owned S3 bucket under per-type key prefixes (default values are
kolide/auth_logs/,kolide/audit_logs/,kolide/check_runs/,kolide/results/, andkolide/status/). Elastic Agent reads each prefix using anaws-s3input through SQS notifications or direct bucket polling. Theauthandauditdata streams can read their respective prefixes. The dedicateddevice_checkdata stream readskolide/check_runs/, and the dedicatedosquery_resultandosquery_statusdata streams readkolide/results/andkolide/status/, which are the raw osquery result and status logs. The Log Pipeline is the most complete source for check-run history because it includes passing, inapplicable, and unknown check results in addition to failures. - Google Cloud Storage (Kolide Log Pipeline): The same Log Pipeline data is written to customer-owned GCS buckets under the same per-type key prefixes and read using a
gcsinput through bucket polling. The object payloads are identical to the S3 delivery, so the sameauth,audit,device_check,osquery_result, andosquery_statusdata streams apply. You can choose S3 or GCS depending on which cloud your Kolide log destination targets.
The Kolide integration collects the following data streams:
webhook: A single webhook ingress that receives all Kolide webhook event types on one endpoint and routes each event to the correct data stream automatically.auth: SSO authentication sessions (auth_logs.successandauth_logs.failureusing the API endpointGET /auth_logs).issues: Device posture-check failures and resolutions (issues.newandissues.resolvedusing the API endpointGET /issues).request: Approval-workflow requests (requests.issue_exemptionandrequests.registrationusing the API endpointsGET /exemption_requestsandGET /registration_requests, as well as request webhooks).device: Device inventory and trust-status changes (devices.created,devices.registered,devices.destroyed, anddevice_trust.status_changedusing the API endpointGET /devices).people: Identity records for people known to Kolide using the API endpointGET /people.deprovisioned_person: Identity records for people who have been offboarded or deprovisioned in Kolide using the API endpointGET /deprovisioned_people. This is a separate resource frompeople.audit: Administrative audit logs of console actions (audit_log.recordedusing the API endpointGET /audit_logsor Log Pipeline S3/GCS paths underkolide/audit_logs/).device_check: Device check-run results from the Log Pipeline (S3/GCS paths underkolide/check_runs/), covering every run includingpassing,failing,inapplicable, andunknownstatuses. This complements the failure-focusedissuesdata stream.osquery_result: Raw osquery Result Logs from the Log Pipeline (S3/GCS paths underkolide/results/), covering both snapshot-query rows and differential (addedandremoved) rows. Per-query column data is stored as a flattened field rather than mapped per column, since it is arbitrary and depends on the target osquery table or custom SQL.osquery_status: Raw osquery Status Logs from the Log Pipeline (S3/GCS paths underkolide/status/), which contain GLOG-style telemetry about the osquery daemon itself rather than host inventory state.
The auth and audit data streams also support the Log Pipeline using the aws-s3 and gcs inputs that read the kolide/auth_logs/ and kolide/audit_logs/ prefixes.
The osquery_result and osquery_status data streams ingest raw osquery agent logs, unlike the other Log Pipeline streams in this integration (auth, audit, and device_check), which are Kolide's own structured logs. The integration populates host.id and host.name from Kolide's kolide_decorations block. This block is only present when the device is enrolled with Kolide's own launcher. A bare open-source osquery deployment shipping logs through the Log Pipeline only carries osquery's own hostIdentifier (stored in kolide.osquery_result.host_identifier and kolide.osquery_status.host_identifier), and host.id and host.name do not populate. Per-query row data (kolide.osquery_result.added, kolide.osquery_result.removed, and kolide.osquery_result.snapshot) is a flattened field rather than a per-column mapping, since the columns are arbitrary and depend on the target osquery table or custom SQL. This keeps the mapping bounded, but means individual columns do not get native Kibana Lens numeric or date typing, or exact-match aggregations.
For the device_check and issues data streams, event.outcome reflects the device posture result rather than the success of event processing. A check run with status passing (or a resolved issue) maps to event.outcome: success. A check run with status failing (or an open issue) maps to event.outcome: failure. An inapplicable or unknown check status maps to event.outcome: unknown. The integration preserves the raw posture state in kolide.device_check.status for device_check.
Check-run results identify the device only by its numeric Kolide device ID, which maps to host.id. The payload carries no hostname, so the integration does not set host.name on this data stream. You can correlate check runs with the device, auth, and issues data streams using the shared host.id. If you need host.name directly on check-run documents, you must enrich them at ingest time with an Elasticsearch enrich policy that matches on host.id. Use logs-kolide_latest.device as the policy's source index: it is maintained by the latest_device transform and holds exactly one document per device, so each host.id resolves to a single unambiguous host.name. See Latest device and people snapshots for details. This setup requires you to enable the device data stream, which is what feeds the transform, and to re-execute the enrich policy periodically so that new or renamed devices resolve correctly.
The Kolide REST API endpoints GET /exemption_requests and GET /registration_requests do not support a modified-since filter, so the integration re-fetches every request on every poll. To prevent duplicate indexing of unchanged requests, the integration deduplicates documents using the request identity (a combination of kolide.request.id and kolide.request.type), its current status, and decision notes. This means the request data stream reflects each request's latest known status. It provides one document per request that is updated as its status changes, rather than a full history of every transition. Kolide allows reopening a previously approved or denied request, meaning a request can cycle through the same status multiple times. If a request is re-decided with the exact same status and decision note text as a previous decision, the integration deduplicates it as a duplicate event. To view the full timeline of who approved, denied, or reopened a request, use the audit data stream (audit_log.recorded), and correlate the events using user.target.email and rule.name.
The endpoint GET /people returns a full-table snapshot with no modified-since filter, so the integration re-fetches every person on every poll. To prevent unnecessary indexing, the integration deduplicates documents using a fingerprint of the entire raw record, excluding last_authenticated_at. This exclusion prevents a new document from being created every time an active person authenticates. A change to any other field (such as name, email, registered-device status, or SCIM usernames) produces a new document, while unchanged records are deduplicated across polls.
The device and people data streams keep a document per distinct state of each device and person, so querying them for "what does this device look like right now" means sorting and collapsing on every search. The integration ships two transforms that maintain that current-state view for you:
| Transform | Source | Destination alias | Entity key |
|---|---|---|---|
latest_device |
logs-kolide.device-* |
logs-kolide_latest.device |
host.id |
latest_people |
logs-kolide.people-* |
logs-kolide_latest.people |
user.id |
Each destination index holds exactly one document per device or person, containing its most recently collected state. When a record changes, the transform replaces the previous document rather than adding to it. These indices are well suited as the source for an Elasticsearch enrich policy: because the entity key only determines document identity, any field on the document can serve as the policy's match field. For example, you can enrich on host.hostname or host.name from logs-kolide_latest.device, or on user.email from logs-kolide_latest.people.
Both transforms key on the stable Kolide identifier (host.id for devices, user.id for people) rather than on a display name, so renaming a device or changing a person's email updates the existing document instead of creating a second entity.
The latest_device transform reads only the full inventory snapshots collected from the REST API (event.kind: state). Device webhook deliveries carry only a few fields, and because a transform replaces the whole destination document, including them would overwrite a complete snapshot with a sparse one. Webhook events remain fully queryable in logs-kolide.device-*.
Both transforms exclude the cold and frozen data tiers from their source query so they never scan searchable-snapshot storage. Existing destination documents are unaffected, but a device or person whose newest source document has aged into those tiers is not repopulated if the transform is ever reinstalled and rebuilt from scratch.
Neither transform applies a retention policy. An unchanged device or person is deduplicated at ingest, so the timestamps on its newest source document reflect the last time its content changed, not the last time it was seen. A time-based retention policy would therefore evict entities that are still active in Kolide but have not changed recently. The trade-off is that devices and people deleted in Kolide remain in the destination indices until you remove them.
Integrating Kolide with Elastic provides a powerful solution for enhancing security posture and operational visibility. You can use this integration for the following use cases:
- Monitor device-trust posture and investigate SSO authentication outcomes alongside device compliance state.
- Track approval workflows, device enrollment, and blocking transitions.
- Correlate device activity with identity records of people.
- Audit administrative changes in Kolide.
- Correlate your Kolide device trust data with the rest of your security data in Elastic using the Elastic Common Schema (ECS).
Before you set up the Kolide integration, you must have the following:
- A Kolide tenant with Full Access administrator privileges to create API keys, webhook endpoints, or Log Pipeline destinations.
- An Elastic Agent installed on a host. Depending on your chosen ingestion method, the host must meet the following network requirements:
- Receive Kolide webhooks on a publicly reachable HTTPS endpoint.
- Reach the Kolide REST API at
https://api.kolide.com. - Access your AWS S3 bucket or Amazon Simple Queue Service (SQS) queue.
- Access your Google Cloud Storage (GCS) bucket.
If you're collecting data using the REST API or the Log Pipeline, you must also configure the following resources:
- A Kolide API key with the form
k2sk_v1_created in your Kolide console under Settings → Developers → API Keys. - An AWS Identity and Access Management (IAM) role or credentials with permissions to read from your AWS S3 bucket or SQS queue, if you use AWS.
- A Google Cloud Platform (GCP) service account JSON key with the Storage Object Viewer role to read from your GCS bucket, if you use GCP.
Elastic Agent must be installed. For more details, check the Elastic Agent installation instructions. You can install only one Elastic Agent per host.
Elastic Agent is required to receive webhook requests, poll the REST API, or read from S3 or GCS buckets and ship the data to Elastic, where the events will then be processed using the integration's ingest pipelines.
Agentless deployments are only supported in Elastic Serverless and Elastic Cloud environments. Agentless deployments provide a means to ingest data while avoiding the orchestration, management, and maintenance needs associated with standard ingest infrastructure. Using an agentless deployment makes manual agent deployment unnecessary, allowing you to focus on your data instead of the agent that collects it.
For more information, refer to Agentless integrations and Agentless integrations FAQ.
To set up steps in Kolide, you must have full access administrator privileges. Sign in to Kolide and choose one or more of the collection methods below.
To configure Kolide webhooks, complete the following steps:
- Log in to your Kolide account and navigate to Settings, then Developers, and then Webhooks.
- Select Add Webhook and create one new endpoint.
- Provide a publicly reachable HTTPS URL pointing at the Elastic Agent listen address, port, and path, such as
https://<your-agent-host>:9550/kolide/webhook(replace<your-agent-host>with the actual address or hostname of your Elastic Agent). - Subscribe the endpoint to all event types. The integration automatically routes each event to the correct data stream.
- Copy the signing secret displayed on screen. This secret is shown only once and is required to configure the HMAC key on the Elastic side.
To configure the REST API, complete the following steps:
- Log in to your Kolide account and navigate to Settings, then Developers, and then API Keys.
- Select Create API Key. Read access is sufficient to retrieve logs.
- Copy the API key. It is displayed only once and has the form
k2sk_v1_followed by your token.
To configure the AWS S3 log pipeline, complete the following steps:
- In Kolide, navigate to Log Destinations and select Amazon S3 Bucket to add a new destination.
- Select the STS authorization method, which is the recommended approach.
- Create an IAM role in your AWS account. Update the trust policy to allow Kolide's AWS account ID
516897320088to assume the role, and restrict access using the External ID displayed in the Kolide console. - Grant the IAM role permissions for
s3:GetBucketLocation,s3:GetObject, ands3:PutObjecton your S3 bucket so Kolide can write logs. - Select the log types you want to deliver. The supported log types include authentication logs, audit logs, check results, and osquery Result or Status logs.
- Configure the read permissions. The Elastic Agent reads the logs from your AWS S3 bucket and does not use Kolide's IAM role. You must configure the Elastic Agent with AWS credentials that have read access.
- For SQS notification mode, configure an S3 event notification for
s3:ObjectCreated:*to deliver notifications to your SQS queue. Grant your Elastic Agent IAM reader credentials the permissions fors3:GetObjecton the bucket andsqs:ReceiveMessage,sqs:DeleteMessage, andsqs:GetQueueAttributeson the SQS queue. - For direct polling mode, grant your Elastic Agent IAM reader credentials the permissions for
s3:GetObjectands3:ListBucketon the bucket. - If your bucket is encrypted using SSE-KMS, ensure the Elastic Agent IAM reader credentials also have
kms:Decryptpermissions on the KMS key.
To configure the Google Cloud Storage log pipeline, complete the following steps:
- Log in to your Google Cloud Console, select your project, and create a GCS bucket.
- Create a service account that can enumerate, read, and write objects in the bucket by granting it the Storage Object Admin role on the bucket, then generate a JSON key for this service account.
- Log in to Kolide, navigate to Log Destinations, select GCP Storage Bucket, and enter a display name and the bucket name.
- Paste the complete service account JSON key file contents into the field provided.
- Select the log types to deliver. This integration supports Administrator Audit Logs, User Authentication Logs, Device Check Run Logs, and osquery Result and Status Logs. Keep the default object path templates because they match the integration's default file selectors.
- Create a separate service account with read-only access (the Storage Object Viewer role) and generate a JSON key for it. The Elastic Agent uses this key to poll the bucket. Alternatively, if the Elastic Agent runs on a GCE or GKE instance, you can leave the credentials blank to use Application Default Credentials.
The following resources provide additional information about setting up Kolide integrations:
- Kolide Webhooks documentation
- Kolide REST API reference
- Kolide Log Pipeline documentation
- Configuring Google Cloud Storage for the Log Pipeline
To set up the Kolide integration in Kibana, complete the following steps:
- In Kibana, navigate to Management, select Integrations, and search for Kolide.
- Select the Kolide integration, and click Add Kolide.
- Configure the settings based on your chosen collection methods. You can enable and configure webhooks, the REST API, or log pipeline inputs.
Configure the following settings to receive webhook events:
| Setting | Description |
|---|---|
| Listen Address | Bind address for the HTTP listener. Use 0.0.0.0 to listen on all interfaces. |
| Listen Port | Bind port for the HTTP listener, such as 9550. |
| URL Path | The URL path to accept Kolide webhook requests on, such as /kolide/webhook. |
| Webhook Signing Secret | The signing secret copied from the Kolide webhook settings. Used to verify HMAC signatures. |
| Webhook Identifier | The webhook endpoint identifier value from the Kolide webhook settings. |
| Preserve Original Event | Check this option to preserve a raw copy of the original event in the event.original field. |
Configure the following settings to pull logs from the Kolide REST API:
| Setting | Description |
|---|---|
| URL | The base URL of the Kolide REST API. The default is https://api.kolide.com. |
| API Key | The Kolide API key used as a Bearer token. This key has the form k2sk_v1_. |
| Interval | How often the Kolide REST API is polled, such as 5m (5 minutes). |
| Initial Interval | How far back to look the first time the integration runs, such as 24h (24 hours). |
| Preserve Original Event | Check this option to preserve a raw copy of the original event in the event.original field. |
Configure the following settings to collect logs from AWS S3:
| Setting | Description |
|---|---|
| Access Key ID | The AWS access key ID the Elastic Agent uses to read from the bucket or queue. |
| Secret Access Key | The AWS secret access key the Elastic Agent uses to read from the bucket or queue. |
| Session Token | The AWS session token for temporary credentials, if using STS. |
| SQS Queue URL | URL of the SQS queue receiving S3 object-created notifications. |
| S3 Bucket ARN | ARN of the S3 bucket to poll directly if not using SQS notifications, such as arn:aws:s3:::kolide-bucket. |
| Bucket List Prefix | Prefix used to list objects in the bucket, such as kolide/audit_logs/. |
| Number of Workers | Number of workers that process the S3 objects or SQS messages. |
| Preserve Original Event | Check this option to preserve a raw copy of the original event in the event.original field. |
Configure the following settings to collect logs from Google Cloud Storage:
| Setting | Description |
|---|---|
| Project ID | The GCP project ID that the GCS bucket belongs to. |
| Service Account Key | The GCP service account JSON key contents with Storage Object Viewer read access. |
| GCS Buckets | The list of GCS buckets to poll in YAML format, specifying the bucket name. |
| File Selectors | A list of regular expression patterns to filter which object keys are processed. |
| Number of Workers | Number of workers that process the GCS objects. |
| Preserve Original Event | Check this option to preserve a raw copy of the original event in the event.original field. |
To validate that the integration is working properly and ingesting data into Elasticsearch, perform the following steps:
- Generate activity in Kolide, such as logging in via Single Sign-On (SSO) to trigger an authentication event, or running a manual device check.
- In Kibana, navigate to Discover.
- In the data view dropdown, select logs-*.
- Search for incoming documents using the search query:
data_stream.dataset: "kolide.webhook" or data_stream.dataset: "kolide.audit" or data_stream.dataset: "kolide.auth" - Verify that documents appear with recent timestamps and contains expected event values.
- Navigate to Dashboards and select the [Logs Kolide] Overview dashboard to confirm that the visualizations are successfully populated with data.
For help with Elastic ingest tools, check Common problems.
If you encounter issues with your Kolide integration, use the following solutions to resolve them:
- No data from webhooks: Confirm the Kolide endpoint URL matches the Agent's listen address, port, and path. Verify that the endpoint is publicly reachable over HTTPS and that the HMAC signing secret matches.
- Webhook signature failures: Ensure the configured HMAC key matches the Kolide endpoint signing secret. Kolide signs the raw request body with HMAC-SHA256 and sends the lowercase hex digest in the
Authorizationheader with no prefix. - No data using the REST API: Verify the API key is valid. A 401 error code indicates a disabled feature or bad token, and a 403 error code indicates the key lacks permission. Confirm that the host can reach
https://api.kolide.com. - No data from AWS S3: Confirm the Elastic Agent credentials have permissions to run
s3:ListBucketands3:GetObjecton the bucket. If you're using SQS mode, ensure the credentials have permissions forsqs:ReceiveMessage. Check that the bucket list prefix matches your Kolide object key template, and verify that SQS notifications are filtered to the correct prefix. Kolide writes tokolide/auth_logs/,kolide/audit_logs/,kolide/check_runs/,kolide/results/, andkolide/status/by default. - No data from Google Cloud Storage: Confirm the project ID and bucket name are correct. Ensure that the reader service account has the
Storage Object Viewerrole on the bucket. Verify that each stream's file selector regex matches your Kolide object key template. By default, the templates expect thekolide/auth_logs/,kolide/audit_logs/,kolide/check_runs/,kolide/results/, andkolide/status/prefixes. - No host ID or host name on osquery result or osquery status documents: These fields are populated from Kolide's
kolide_decorationsblock, which requires the device to be enrolled with Kolide's own launcher. A bare open-source osquery deployment shipping logs through the Log Pipeline only carrieskolide.osquery_result.host_identifierorkolide.osquery_status.host_identifier(osquery's ownhostIdentifier), not the Kolide-decorated host fields.
For more details on configuring Kolide, check the following resources:
For more information on architectures that can be used for scaling this integration, check the Ingest Architectures documentation.
Kolide's Log Pipeline writes one log per object rather than batching, so the AWS S3/SQS and GCS inputs make a separate fetch for every document. For high-volume streams this is fine, but for small, sparse streams it adds many network round-trips and can make large backlogs slow to drain. To keep latency low and avoid contention on a shared S3 queue, you can match the transport to the stream.
To optimize your ingestion, configure the transports using these guidelines:
- For
auditandauthdata streams, prefer the REST API (CEL) or webhook inputs. These streams are typically small and sparse, and the API or webhook paths deliver them quickly without per-object fetches. - For
device_check,osquery_result, andosquery_statusdata streams, use the AWS S3 or GCS input because they're the only collection methods available. These streams are typically large or high-volume. Theosquery_resultstream is especially large because every scheduled query execution can produce a log line, making object storage the appropriate fit. Keeping them in object storage also keeps the small, important streams off the same queue.
This split keeps the small streams responsive while still using object storage for the bulk data.
If you consume large streams over S3/SQS or GCS, you can increase throughput by running multiple Elastic Agents or scaling out workers to process objects concurrently. The one-object-per-log behavior is a Kolide-side limitation. This guidance is a workaround until Kolide addresses the issue upstream.
These inputs can be used with this integration:
aws-s3
Set up an Amazon S3 To create an Amazon S3 bucket, follow these steps.
You can set the parameter "Bucket List Prefix" according to the requirement.
AWS S3 polling mode: Writes data to S3, and Elastic Agent polls the S3 bucket by listing its contents and reading new files.
AWS S3 SQS mode: Writes data to S3; S3 sends a notification of a new object to SQS; the Elastic Agent receives the notification from SQS and then reads the S3 object. Multiple agents can be used in this mode.
When log collection from an S3 bucket is enabled, you can access logs from S3 objects referenced by S3 notification events received through an SQS queue or by directly polling the list of S3 objects within the bucket.
The use of SQS notification is preferred: polling list of S3 objects is expensive in terms of performance and costs and should be used only when no SQS notification can be attached to the S3 buckets. This input integration also supports S3 notification from SNS to SQS, or from EventBridge to SQS.
To enable the SQS notification method, set the queue_url configuration value. To enable the S3 bucket list polling method, configure both the bucket_arn and number_of_workers values. Note that queue_url and bucket_arn cannot be set simultaneously, and at least one of these values must be specified. The number_of_workers parameter is the primary way to control ingestion throughput for both S3 polling and SQS modes. This parameter determines how many parallel workers process S3 objects simultaneously.
To access SQS and S3, these specific AWS permissions are required.
To collect logs via AWS S3, configure the following parameters:
- Collect logs via S3 Bucket toggled on
- Access Key ID
- Secret Access Key
- Bucket ARN or Access Point ARN
- Session Token
Alternatively, to collect logs via AWS SQS, configure the following parameters:
- Collect logs via S3 Bucket toggled off
- Queue URL
- Secret Access Key
- Access Key ID
- Session Token
cel
For more details about the CEL input settings, check the Filebeat documentation.
Before configuring the CEL input, make sure you have:
- Network connectivity to the target API endpoint
- Valid authentication credentials (API keys, tokens, or certificates as required)
- Appropriate permissions to read from the target data source
To configure the CEL input, you must specify the request.url value pointing to the API endpoint. The interval parameter controls how frequently requests are made and is the primary way to balance data freshness with API rate limits and costs. Authentication is often configured through the request.headers section using the appropriate method for the service.
To access the API service, make sure you have the necessary API credentials and that the Filebeat instance can reach the endpoint URL. Some services may require IP whitelisting or VPN access.
To collect logs via API endpoint, configure the following parameters:
- API Endpoint URL
- API credentials (tokens, keys, or username/password)
- Request interval (how often to fetch data)
gcs
For more details about the GCS input settings, check the Filebeat documentation.
To collect logs via GCS, select Collect logs via GCS and configure the following parameters:
- Buckets: This attribute contains details related to specific buckets like
name,number_of_workers,poll,poll_interval, andbucket_timeout. The attributenameis specific to a bucket as it describes the bucket name, while the fieldsnumber_of_workers,poll,poll_intervalandbucket_timeoutcan exist at the bucket level and at the global level. If you defined the attributes globally, you can only specify the name in this YAML config. If you want to override any specific attribute for a specific bucket, you can define it here. Any attribute defined in the YAML will override the global definitions. Check the Filebeat documentation for further information. - Project ID: This attribute is required for various internal operations with respect to authentication, creating storage clients and logging which are used internally for various processing purposes.
http_endpoint
For more details about the HTTP Endpoint input settings, check the Filebeat documentation.
To collect logs via HTTP Endpoint, select Collect logs via HTTP Endpoint and configure the following parameters:
- Listen Address: Bind address for the HTTP listener. Use 0.0.0.0 to listen on all interfaces.
- Listen port: Bind port for the listener.
The integration uses the following Kolide REST API endpoints to retrieve logs and telemetry:
GET /auth_logsGET /issuesGET /exemption_requestsGET /registration_requestsGET /devicesGET /peopleGET /deprovisioned_peopleGET /audit_logs
You can refer to the following vendor documentation for more details about Kolide features and APIs:
This integration uses these data streams to organize collected logs and metrics:
The webhook data stream is the single ingress point for all Kolide webhook events. It listens on one HTTP endpoint and uses the ingest reroute processor to redirect each event to the appropriate target data stream, such as auth, issues, device, or audit, based on the Kolide event type. No documents are stored in the webhook data stream itself.
Exported fields
| Field | Description | Type |
|---|---|---|
| @timestamp | Date/time when the event originated. This is the date/time extracted from the event, typically representing when the event was generated by the source. If the event source has no original timestamp, this value is typically populated by the first time the event was received by the pipeline. Required field for all events. | date |
| data_stream.dataset | The field can contain anything that makes sense to signify the source of the data. Examples include nginx.access, prometheus, endpoint etc. For data streams that otherwise fit, but that do not have dataset set we use the value "generic" for the dataset value. event.dataset should have the same value as data_stream.dataset. Beyond the Elasticsearch data stream naming criteria noted above, the dataset value has additional restrictions: * Must not contain - * No longer than 100 characters |
constant_keyword |
| data_stream.namespace | A user defined namespace. Namespaces are useful to allow grouping of data. Many users already organize their indices this way, and the data stream naming scheme now provides this best practice as a default. Many users will populate this field with default. If no value is used, it falls back to default. Beyond the Elasticsearch index naming criteria noted above, namespace value has the additional restrictions: * Must not contain - * No longer than 100 characters |
constant_keyword |
| data_stream.type | An overarching type for the data stream. Currently allowed values are "logs" and "metrics". We expect to also add "traces" and "synthetics" in the near future. | constant_keyword |
| ecs.version | ECS version this event conforms to. ecs.version is a required field and must exist in all events. When querying across multiple indices -- which may conform to slightly different ECS versions -- this field lets integrations adjust to the schema version of the events. |
keyword |
| error.message | Error message. | match_only_text |
| event.dataset | Name of the dataset. If an event source publishes more than one type of log or events (e.g. access log, error log), the dataset is used to specify which one the event comes from. It's recommended but not required to start the dataset name with the module name, followed by a dot, then the dataset name. | constant_keyword |
| event.kind | This is one of four ECS Categorization Fields, and indicates the highest level in the ECS category hierarchy. event.kind gives high-level information about what type of information the event contains, without being specific to the contents of the event. For example, values of this field distinguish alert events from metric events. The value of this field can be used to inform how these kinds of events should be handled. They may warrant different retention, different access control, it may also help understand whether the data is coming in at a regular interval or not. |
keyword |
| event.module | Name of the module this data is coming from. If your monitoring agent supports the concept of modules or plugins to process events of a given source (e.g. Apache logs), event.module should contain the name of this module. |
constant_keyword |
| input.type | Type of filebeat input. | keyword |
| json | Working object used to hold the raw Kolide webhook envelope fields before the event is routed to the appropriate data stream. Contains event (event type string), id (ULID), timestamp, and data (event payload). Cleaned up by the target data stream pipeline after routing. | flattened |
| log.offset | Log offset. | long |
| tags | List of keywords used to tag each event. | keyword |
The auth data stream provides Kolide SSO authentication sessions. This includes the device-trust posture at sign-in, the client IP address and geolocation, and the sub-events of the session.
Exported fields
| Field | Description | Type |
|---|---|---|
| @timestamp | Date/time when the event originated. This is the date/time extracted from the event, typically representing when the event was generated by the source. If the event source has no original timestamp, this value is typically populated by the first time the event was received by the pipeline. Required field for all events. | date |
| aws.s3.bucket.arn | The AWS S3 bucket ARN. | keyword |
| aws.s3.bucket.name | The AWS S3 bucket name. | keyword |
| aws.s3.object.key | The AWS S3 object key. | keyword |
| data_stream.dataset | The field can contain anything that makes sense to signify the source of the data. Examples include nginx.access, prometheus, endpoint etc. For data streams that otherwise fit, but that do not have dataset set we use the value "generic" for the dataset value. event.dataset should have the same value as data_stream.dataset. Beyond the Elasticsearch data stream naming criteria noted above, the dataset value has additional restrictions: * Must not contain - * No longer than 100 characters |
constant_keyword |
| data_stream.namespace | A user defined namespace. Namespaces are useful to allow grouping of data. Many users already organize their indices this way, and the data stream naming scheme now provides this best practice as a default. Many users will populate this field with default. If no value is used, it falls back to default. Beyond the Elasticsearch index naming criteria noted above, namespace value has the additional restrictions: * Must not contain - * No longer than 100 characters |
constant_keyword |
| data_stream.type | An overarching type for the data stream. Currently allowed values are "logs" and "metrics". We expect to also add "traces" and "synthetics" in the near future. | constant_keyword |
| ecs.version | ECS version this event conforms to. ecs.version is a required field and must exist in all events. When querying across multiple indices -- which may conform to slightly different ECS versions -- this field lets integrations adjust to the schema version of the events. |
keyword |
| error.message | Error message. | match_only_text |
| event.action | The action captured by the event. This describes the information in the event. It is more specific than event.category. Examples are group-add, process-started, file-created. The value is normally defined by the implementer. |
keyword |
| event.category | This is one of four ECS Categorization Fields, and indicates the second level in the ECS category hierarchy. event.category represents the "big buckets" of ECS categories. For example, filtering on event.category:process yields all events relating to process activity. This field is closely related to event.type, which is used as a subcategory. This field is an array. This will allow proper categorization of some events that fall in multiple categories. |
keyword |
| event.dataset | Name of the dataset. If an event source publishes more than one type of log or events (e.g. access log, error log), the dataset is used to specify which one the event comes from. It's recommended but not required to start the dataset name with the module name, followed by a dot, then the dataset name. | constant_keyword |
| event.id | Unique ID to describe the event. | keyword |
| event.kind | This is one of four ECS Categorization Fields, and indicates the highest level in the ECS category hierarchy. event.kind gives high-level information about what type of information the event contains, without being specific to the contents of the event. For example, values of this field distinguish alert events from metric events. The value of this field can be used to inform how these kinds of events should be handled. They may warrant different retention, different access control, it may also help understand whether the data is coming in at a regular interval or not. |
keyword |
| event.module | Name of the module this data is coming from. If your monitoring agent supports the concept of modules or plugins to process events of a given source (e.g. Apache logs), event.module should contain the name of this module. |
constant_keyword |
| event.original | Raw text message of entire event. Used to demonstrate log integrity or where the full log message (before splitting it up in multiple parts) may be required, e.g. for reindex. This field is not indexed and doc_values are disabled. It cannot be searched, but it can be retrieved from _source. If users wish to override this and index this field, please see Field data types in the Elasticsearch Reference. |
keyword |
| event.outcome | This is one of four ECS Categorization Fields, and indicates the lowest level in the ECS category hierarchy. event.outcome simply denotes whether the event represents a success or a failure from the perspective of the entity that produced the event. Note that when a single transaction is described in multiple events, each event may populate different values of event.outcome, according to their perspective. Also note that in the case of a compound event (a single event that contains multiple logical events), this field should be populated with the value that best captures the overall success or failure from the perspective of the event producer. Further note that not all events will have an associated outcome. For example, this field is generally not populated for metric events, events with event.type:info, or any events for which an outcome does not make logical sense. |
keyword |
| event.start | event.start contains the date when the event started or when the activity was first observed. |
date |
| event.type | This is one of four ECS Categorization Fields, and indicates the third level in the ECS category hierarchy. event.type represents a categorization "sub-bucket" that, when used along with the event.category field values, enables filtering events down to a level appropriate for single visualization. This field is an array. This will allow proper categorization of some events that fall in multiple event types. |
keyword |
| gcs.storage.bucket.name | The GCS bucket name. | keyword |
| gcs.storage.object.content_type | The content type of the GCS object. | keyword |
| gcs.storage.object.name | The GCS object name. | keyword |
| host.hostname | Hostname of the host. It normally contains what the hostname command returns on the host machine. |
keyword |
| host.id | Unique host id. As hostname is not always unique, use values that are meaningful in your environment. Example: The current usage of beat.name. |
keyword |
| host.name | Name of the host. It can contain what hostname returns on Unix systems, the fully qualified domain name (FQDN), or a name specified by the user. The recommended value is the lowercase FQDN of the host. | keyword |
| input.type | Type of filebeat input. | keyword |
| kolide.auth.agent_version | Version of the Kolide agent (launcher) reported during the session. From API agent_version or webhook launcher_version. |
keyword |
| kolide.auth.downloaded_packages | Names of packages downloaded to the device during the authentication session. | keyword |
| kolide.auth.initial_status | Device trust posture at the start of the session. One of: all_good, will_block, blocked, unknown. | keyword |
| kolide.auth.issues_displayed.blocking_status | Blocking status of the issue. One of: blocked, will_block. | keyword |
| kolide.auth.issues_displayed.id | Canonical identifier of the displayed issue. | keyword |
| kolide.auth.issues_displayed.link | API URL of the issue. | keyword |
| kolide.auth.issues_displayed.title | Short description of the displayed issue. | keyword |
| kolide.auth.okta.app_instance_id | Okta app instance identifier from the SAML request. | keyword |
| kolide.auth.okta.app_name | Okta app name from the SAML request. | keyword |
| kolide.auth.result | Outcome of the authentication as reported by the API. One of: Success, Fail. | keyword |
| kolide.auth.session_id | Identifier of the authentication session. Shared across all sub-events split from the same session so they can be correlated. From the API/webhook record id. |
keyword |
| kolide.auth.url | API URL of the full auth_log record (webhook only). | keyword |
| log.offset | Log offset. | long |
| message | For log events the message field contains the log message, optimized for viewing in a log viewer. For structured logs without an original message field, other fields can be concatenated to form a human-readable summary of the event. If multiple messages exist, they can be combined into one message. | match_only_text |
| related.hosts | All hostnames or other host identifiers seen on your event. Example identifiers include FQDNs, domain names, workstation names, or aliases. | keyword |
| related.ip | All of the IPs seen on your event. | ip |
| related.user | All the user names or other user identifiers seen on the event. | keyword |
| source.as.number | Unique number allocated to the autonomous system. The autonomous system number (ASN) uniquely identifies each network on the Internet. | long |
| source.as.organization.name | Organization name. | keyword |
| source.as.organization.name.text | Multi-field of source.as.organization.name. |
match_only_text |
| source.geo.city_name | City name. | keyword |
| source.geo.continent_name | Name of the continent. | keyword |
| source.geo.country_iso_code | Country ISO code. | keyword |
| source.geo.country_name | Country name. | keyword |
| source.geo.location.lat | Longitude and latitude. | geo_point |
| source.geo.location.lon | Longitude and latitude. | geo_point |
| source.geo.region_iso_code | Region ISO code. | keyword |
| source.geo.region_name | Region name. | keyword |
| source.ip | IP address of the source (IPv4 or IPv6). | ip |
| tags | List of keywords used to tag each event. | keyword |
| user.email | User email address. | keyword |
| user.id | Unique identifier of the user. | keyword |
| user.name | Short name or login of the user. | keyword |
| user.name.text | Multi-field of user.name. |
match_only_text |
| user_agent.device.name | Name of the device. | keyword |
| user_agent.name | Name of the user agent. | keyword |
| user_agent.original | Unparsed user_agent string. | keyword |
| user_agent.original.text | Multi-field of user_agent.original. |
match_only_text |
| user_agent.os.full | Operating system name, including the version or code name. | keyword |
| user_agent.os.full.text | Multi-field of user_agent.os.full. |
match_only_text |
| user_agent.os.name | Operating system name, without the version. | keyword |
| user_agent.os.name.text | Multi-field of user_agent.os.name. |
match_only_text |
| user_agent.os.version | Operating system version as a raw string. | keyword |
| user_agent.version | Version of the user agent. | keyword |
Example
{
    "@timestamp": "2026-06-11T16:29:17.000Z",
    "agent": {
        "ephemeral_id": "ead84309-61e4-4649-884b-5c2bbcb28888",
        "id": "dccea145-284f-4566-914a-d93ed70b44fc",
        "name": "elastic-agent-96605",
        "type": "filebeat",
        "version": "8.19.0"
    },
    "cloud": {
        "provider": "google cloud"
    },
    "data_stream": {
        "dataset": "kolide.auth",
        "namespace": "86759",
        "type": "logs"
    },
    "ecs": {
        "version": "9.4.0"
    },
    "elastic_agent": {
        "id": "dccea145-284f-4566-914a-d93ed70b44fc",
        "snapshot": false,
        "version": "8.19.0"
    },
    "event": {
        "action": "sign_in_attempt",
        "agent_id_status": "verified",
        "category": [
            "authentication",
            "session"
        ],
        "dataset": "kolide.auth",
        "id": "id-95314806818425813618559742320:sign_in_attempt:2026-06-11T16:29:17Z",
        "ingested": "2026-07-13T18:22:27Z",
        "kind": "event",
        "original": "{\"timestamp\":\"2026-06-11T16:29:17Z\",\"type\":\"auth_log\",\"data\":{\"request_id\":\"id-95314806818425813618559742320\",\"auth_event_type\":\"sign_in_attempt\",\"ip_address\":\"198.51.100.210\"}}",
        "type": [
            "start"
        ]
    },
    "gcs": {
        "storage": {
            "bucket": {
                "name": "kolide-auth"
            },
            "object": {
                "content_type": "application/x-ndjson",
                "name": "kolide-auth.log"
            }
        }
    },
    "input": {
        "type": "gcs"
    },
    "kolide": {
        "auth": {
            "session_id": "id-95314806818425813618559742320"
        }
    },
    "log": {
        "file": {
            "path": "gs://kolide-auth/kolide-auth.log"
        },
        "offset": 0
    },
    "related": {
        "ip": [
            "198.51.100.210"
        ]
    },
    "source": {
        "as": {
            "number": 64501,
            "organization": {
                "name": "Documentation ASN"
            }
        },
        "geo": {
            "city_name": "Amsterdam",
            "continent_name": "Europe",
            "country_iso_code": "NL",
            "country_name": "Netherlands",
            "location": {
                "lat": 52.37404,
                "lon": 4.88969
            },
            "region_iso_code": "NL-NH",
            "region_name": "North Holland"
        },
        "ip": "198.51.100.210"
    },
    "tags": [
        "preserve_original_event",
        "forwarded",
        "kolide-auth-gcs"
    ]
}
The issues data stream provides Kolide posture-check failures and resolutions for devices.
Exported fields
| Field | Description | Type |
|---|---|---|
| @timestamp | Date/time when the event originated. This is the date/time extracted from the event, typically representing when the event was generated by the source. If the event source has no original timestamp, this value is typically populated by the first time the event was received by the pipeline. Required field for all events. | date |
| data_stream.dataset | The field can contain anything that makes sense to signify the source of the data. Examples include nginx.access, prometheus, endpoint etc. For data streams that otherwise fit, but that do not have dataset set we use the value "generic" for the dataset value. event.dataset should have the same value as data_stream.dataset. Beyond the Elasticsearch data stream naming criteria noted above, the dataset value has additional restrictions: * Must not contain - * No longer than 100 characters |
constant_keyword |
| data_stream.namespace | A user defined namespace. Namespaces are useful to allow grouping of data. Many users already organize their indices this way, and the data stream naming scheme now provides this best practice as a default. Many users will populate this field with default. If no value is used, it falls back to default. Beyond the Elasticsearch index naming criteria noted above, namespace value has the additional restrictions: * Must not contain - * No longer than 100 characters |
constant_keyword |
| data_stream.type | An overarching type for the data stream. Currently allowed values are "logs" and "metrics". We expect to also add "traces" and "synthetics" in the near future. | constant_keyword |
| ecs.version | ECS version this event conforms to. ecs.version is a required field and must exist in all events. When querying across multiple indices -- which may conform to slightly different ECS versions -- this field lets integrations adjust to the schema version of the events. |
keyword |
| error.message | Error message. | match_only_text |
| event.action | The action captured by the event. This describes the information in the event. It is more specific than event.category. Examples are group-add, process-started, file-created. The value is normally defined by the implementer. |
keyword |
| event.category | This is one of four ECS Categorization Fields, and indicates the second level in the ECS category hierarchy. event.category represents the "big buckets" of ECS categories. For example, filtering on event.category:process yields all events relating to process activity. This field is closely related to event.type, which is used as a subcategory. This field is an array. This will allow proper categorization of some events that fall in multiple categories. |
keyword |
| event.dataset | Name of the dataset. If an event source publishes more than one type of log or events (e.g. access log, error log), the dataset is used to specify which one the event comes from. It's recommended but not required to start the dataset name with the module name, followed by a dot, then the dataset name. | constant_keyword |
| event.end | event.end contains the date when the event ended or when the activity was last observed. |
date |
| event.id | Unique ID to describe the event. | keyword |
| event.kind | This is one of four ECS Categorization Fields, and indicates the highest level in the ECS category hierarchy. event.kind gives high-level information about what type of information the event contains, without being specific to the contents of the event. For example, values of this field distinguish alert events from metric events. The value of this field can be used to inform how these kinds of events should be handled. They may warrant different retention, different access control, it may also help understand whether the data is coming in at a regular interval or not. |
keyword |
| event.module | Name of the module this data is coming from. If your monitoring agent supports the concept of modules or plugins to process events of a given source (e.g. Apache logs), event.module should contain the name of this module. |
constant_keyword |
| event.original | Raw text message of entire event. Used to demonstrate log integrity or where the full log message (before splitting it up in multiple parts) may be required, e.g. for reindex. This field is not indexed and doc_values are disabled. It cannot be searched, but it can be retrieved from _source. If users wish to override this and index this field, please see Field data types in the Elasticsearch Reference. |
keyword |
| event.outcome | This is one of four ECS Categorization Fields, and indicates the lowest level in the ECS category hierarchy. event.outcome simply denotes whether the event represents a success or a failure from the perspective of the entity that produced the event. Note that when a single transaction is described in multiple events, each event may populate different values of event.outcome, according to their perspective. Also note that in the case of a compound event (a single event that contains multiple logical events), this field should be populated with the value that best captures the overall success or failure from the perspective of the event producer. Further note that not all events will have an associated outcome. For example, this field is generally not populated for metric events, events with event.type:info, or any events for which an outcome does not make logical sense. |
keyword |
| event.start | event.start contains the date when the event started or when the activity was first observed. |
date |
| event.type | This is one of four ECS Categorization Fields, and indicates the third level in the ECS category hierarchy. event.type represents a categorization "sub-bucket" that, when used along with the event.category field values, enables filtering events down to a level appropriate for single visualization. This field is an array. This will allow proper categorization of some events that fall in multiple event types. |
keyword |
| file.device | Device that is the source of the file. | keyword |
| file.hash.md5 | MD5 hash. | keyword |
| file.hash.sha256 | SHA256 hash. | keyword |
| file.path | Full path to the file, including the file name. It should include the drive letter, when appropriate. | keyword |
| file.path.text | Multi-field of file.path. |
match_only_text |
| host.hostname | Hostname of the host. It normally contains what the hostname command returns on the host machine. |
keyword |
| host.id | Unique host id. As hostname is not always unique, use values that are meaningful in your environment. Example: The current usage of beat.name. |
keyword |
| host.name | Name of the host. It can contain what hostname returns on Unix systems, the fully qualified domain name (FQDN), or a name specified by the user. The recommended value is the lowercase FQDN of the host. | keyword |
| input.type | Type of filebeat input. | keyword |
| kolide.issues.blocks_device_at | Timestamp at which the issue will begin blocking the device (API only). | date |
| kolide.issues.check.id | Identifier of the failing check (webhook check_id). |
keyword |
| kolide.issues.check.tags | Tags associated with the check (webhook only). | keyword |
| kolide.issues.check_information.link | API URL of the check record. | keyword |
| kolide.issues.detected_at | Timestamp at which the issue was first detected (API), or the webhook delivery time for issues.new webhook deliveries. |
date |
| kolide.issues.detected_version | Version of the software detected on the device (for example, Chrome, OS). | keyword |
| kolide.issues.device_information.link | API URL of the device record. | keyword |
| kolide.issues.exempted | Whether the issue has been exempted from blocking the device (API only). | boolean |
| kolide.issues.expected_version | Minimum or newest version required for compliance. | keyword |
| kolide.issues.id | Canonical identifier of the issue. From API id or webhook issue_id. |
keyword |
| kolide.issues.issue_key | The key that identifies what kind of issue this is, for example bundle_id (API only). |
keyword |
| kolide.issues.issue_value | The value associated with the issue key, for example the offending bundle identifier (API only). | keyword |
| kolide.issues.last_rechecked_at | Timestamp at which the issue was last rechecked (API only). | date |
| kolide.issues.resolved_at | Timestamp at which the issue was resolved, if any (API), or the webhook delivery time for issues.resolved webhook deliveries. |
date |
| kolide.issues.ssh_key_type | SSH key algorithm type (for example, ssh-ed25519, ssh-rsa). | keyword |
| kolide.issues.title | Short human-readable description of the issue. Can be null on issues.new webhooks. |
keyword |
| kolide.issues.value | Structured details about why the device failed the check; the shape varies by check (API only). | flattened |
| log.offset | Log offset. | long |
| message | For log events the message field contains the log message, optimized for viewing in a log viewer. For structured logs without an original message field, other fields can be concatenated to form a human-readable summary of the event. If multiple messages exist, they can be combined into one message. | match_only_text |
| package.version | Package version | keyword |
| related.hosts | All hostnames or other host identifiers seen on your event. Example identifiers include FQDNs, domain names, workstation names, or aliases. | keyword |
| related.user | All the user names or other user identifiers seen on the event. | keyword |
| rule.category | A categorization value keyword used by the entity using the rule for detection of this event. | keyword |
| rule.id | A rule ID that is unique within the scope of an agent, observer, or other entity using the rule for detection of this event. | keyword |
| rule.name | The name of the rule or signature generating the event. | keyword |
| rule.reference | Reference URL to additional information about the rule used to generate this event. The URL can point to the vendor's documentation about the rule. If that's not available, it can also be a link to a more general page describing this type of alert. | keyword |
| tags | List of keywords used to tag each event. | keyword |
| user.name | Short name or login of the user. | keyword |
| user.name.text | Multi-field of user.name. |
match_only_text |
Example
{
    "@timestamp": "2023-11-04T20:50:15.000Z",
    "agent": {
        "ephemeral_id": "ca392310-3081-40aa-8dc2-593fbd4e68c0",
        "id": "3034cebb-69a8-4e14-9ef7-9080f748e9a0",
        "name": "elastic-agent-79628",
        "type": "filebeat",
        "version": "9.4.3"
    },
    "data_stream": {
        "dataset": "kolide.issues",
        "namespace": "18609",
        "type": "logs"
    },
    "ecs": {
        "version": "9.4.0"
    },
    "elastic_agent": {
        "id": "3034cebb-69a8-4e14-9ef7-9080f748e9a0",
        "snapshot": false,
        "version": "9.4.3"
    },
    "event": {
        "action": "blocked",
        "agent_id_status": "verified",
        "category": [
            "configuration"
        ],
        "dataset": "kolide.issues",
        "id": "9999",
        "ingested": "2026-07-13T16:44:23Z",
        "kind": "event",
        "module": "kolide",
        "original": "{\"blocks_device_at\":\"2023-11-04T20:50:15Z\",\"check_information\":{\"identifier\":\"71\",\"link\":\"https://api.example.com/checks/71\"},\"detected_at\":\"2023-10-28T20:50:15Z\",\"device_information\":{\"identifier\":\"1\",\"link\":\"https://api.example.com/devices/1\"},\"exempted\":false,\"id\":\"9999\",\"issue_key\":\"bundle_id\",\"issue_value\":\"com.example.app\",\"last_rechecked_at\":\"2023-10-28T21:00:58Z\",\"resolved_at\":null,\"title\":\"macOS Firewall is Disabled\",\"value\":{\"firewall_enabled\":false}}",
        "outcome": "failure",
        "start": "2023-10-28T20:50:15.000Z",
        "type": [
            "change"
        ]
    },
    "host": {
        "id": "1"
    },
    "input": {
        "type": "cel"
    },
    "kolide": {
        "issues": {
            "blocks_device_at": "2023-11-04T20:50:15.000Z",
            "check_information": {
                "link": "https://api.example.com/checks/71"
            },
            "detected_at": "2023-10-28T20:50:15.000Z",
            "device_information": {
                "link": "https://api.example.com/devices/1"
            },
            "exempted": false,
            "id": "9999",
            "issue_key": "bundle_id",
            "issue_value": "com.example.app",
            "last_rechecked_at": "2023-10-28T21:00:58.000Z",
            "title": "macOS Firewall is Disabled",
            "value": {
                "firewall_enabled": "false"
            }
        }
    },
    "message": "macOS Firewall is Disabled",
    "rule": {
        "id": "71",
        "name": "macOS Firewall is Disabled",
        "reference": "https://api.example.com/checks/71"
    },
    "tags": [
        "preserve_original_event",
        "forwarded",
        "kolide-issues"
    ]
}
The request data stream collects approval-workflow requests from the Kolide REST API using the GET /exemption_requests and GET /registration_requests endpoints, as well as request webhooks. The logs from these endpoints are normalized into a single data stream with kolide.request.type set to either exemption or registration.
Exported fields
| Field | Description | Type |
|---|---|---|
| @timestamp | Date/time when the event originated. This is the date/time extracted from the event, typically representing when the event was generated by the source. If the event source has no original timestamp, this value is typically populated by the first time the event was received by the pipeline. Required field for all events. | date |
| data_stream.dataset | The field can contain anything that makes sense to signify the source of the data. Examples include nginx.access, prometheus, endpoint etc. For data streams that otherwise fit, but that do not have dataset set we use the value "generic" for the dataset value. event.dataset should have the same value as data_stream.dataset. Beyond the Elasticsearch data stream naming criteria noted above, the dataset value has additional restrictions: * Must not contain - * No longer than 100 characters |
constant_keyword |
| data_stream.namespace | A user defined namespace. Namespaces are useful to allow grouping of data. Many users already organize their indices this way, and the data stream naming scheme now provides this best practice as a default. Many users will populate this field with default. If no value is used, it falls back to default. Beyond the Elasticsearch index naming criteria noted above, namespace value has the additional restrictions: * Must not contain - * No longer than 100 characters |
constant_keyword |
| data_stream.type | An overarching type for the data stream. Currently allowed values are "logs" and "metrics". We expect to also add "traces" and "synthetics" in the near future. | constant_keyword |
| ecs.version | ECS version this event conforms to. ecs.version is a required field and must exist in all events. When querying across multiple indices -- which may conform to slightly different ECS versions -- this field lets integrations adjust to the schema version of the events. |
keyword |
| error.message | Error message. | match_only_text |
| event.action | The action captured by the event. This describes the information in the event. It is more specific than event.category. Examples are group-add, process-started, file-created. The value is normally defined by the implementer. |
keyword |
| event.category | This is one of four ECS Categorization Fields, and indicates the second level in the ECS category hierarchy. event.category represents the "big buckets" of ECS categories. For example, filtering on event.category:process yields all events relating to process activity. This field is closely related to event.type, which is used as a subcategory. This field is an array. This will allow proper categorization of some events that fall in multiple categories. |
keyword |
| event.dataset | Name of the dataset. If an event source publishes more than one type of log or events (e.g. access log, error log), the dataset is used to specify which one the event comes from. It's recommended but not required to start the dataset name with the module name, followed by a dot, then the dataset name. | constant_keyword |
| event.id | Unique ID to describe the event. | keyword |
| event.kind | This is one of four ECS Categorization Fields, and indicates the highest level in the ECS category hierarchy. event.kind gives high-level information about what type of information the event contains, without being specific to the contents of the event. For example, values of this field distinguish alert events from metric events. The value of this field can be used to inform how these kinds of events should be handled. They may warrant different retention, different access control, it may also help understand whether the data is coming in at a regular interval or not. |
keyword |
| event.module | Name of the module this data is coming from. If your monitoring agent supports the concept of modules or plugins to process events of a given source (e.g. Apache logs), event.module should contain the name of this module. |
constant_keyword |
| event.original | Raw text message of entire event. Used to demonstrate log integrity or where the full log message (before splitting it up in multiple parts) may be required, e.g. for reindex. This field is not indexed and doc_values are disabled. It cannot be searched, but it can be retrieved from _source. If users wish to override this and index this field, please see Field data types in the Elasticsearch Reference. |
keyword |
| event.outcome | This is one of four ECS Categorization Fields, and indicates the lowest level in the ECS category hierarchy. event.outcome simply denotes whether the event represents a success or a failure from the perspective of the entity that produced the event. Note that when a single transaction is described in multiple events, each event may populate different values of event.outcome, according to their perspective. Also note that in the case of a compound event (a single event that contains multiple logical events), this field should be populated with the value that best captures the overall success or failure from the perspective of the event producer. Further note that not all events will have an associated outcome. For example, this field is generally not populated for metric events, events with event.type:info, or any events for which an outcome does not make logical sense. |
keyword |
| event.reason | Reason why this event happened, according to the source. This describes the why of a particular action or outcome captured in the event. Where event.action captures the action from the event, event.reason describes why that action was taken. For example, a web proxy with an event.action which denied the request may also populate event.reason with the reason why (e.g. blocked site). |
keyword |
| event.type | This is one of four ECS Categorization Fields, and indicates the third level in the ECS category hierarchy. event.type represents a categorization "sub-bucket" that, when used along with the event.category field values, enables filtering events down to a level appropriate for single visualization. This field is an array. This will allow proper categorization of some events that fall in multiple event types. |
keyword |
| host.hostname | Hostname of the host. It normally contains what the hostname command returns on the host machine. |
keyword |
| host.id | Unique host id. As hostname is not always unique, use values that are meaningful in your environment. Example: The current usage of beat.name. |
keyword |
| host.name | Name of the host. It can contain what hostname returns on Unix systems, the fully qualified domain name (FQDN), or a name specified by the user. The recommended value is the lowercase FQDN of the host. | keyword |
| input.type | Type of filebeat input. | keyword |
| kolide.request.created_at | Timestamp at which the request was created. From API requested_at. |
date |
| kolide.request.device.url | API URL of the referenced device. From API device_information.link or webhook data.device.url. |
keyword |
| kolide.request.id | Kolide request identifier. | keyword |
| kolide.request.internal_message | Admin-internal note explaining the approval/denial decision, not shown to the requester. From API internal_explanation (exemption) or internal_denial_note / internal_approval_note (registration). |
match_only_text |
| kolide.request.issues | Issues referenced by an exemption request. From API issues (array of identifier/link link-objects) or webhook data.issues (array of issue_id/issue_url objects); the shape varies by source. |
flattened |
| kolide.request.message | Human-entered request message or reason. From API requester_message or webhook data.message. |
match_only_text |
| kolide.request.requester.url | API URL of the referenced requester. From API requester_information.link or webhook data.requester.url. |
keyword |
| kolide.request.state | Normalized request state, for example pending, approved, or denied. |
keyword |
| kolide.request.type | Type of request, either exemption or registration. |
keyword |
| message | For log events the message field contains the log message, optimized for viewing in a log viewer. For structured logs without an original message field, other fields can be concatenated to form a human-readable summary of the event. If multiple messages exist, they can be combined into one message. | match_only_text |
| related.hosts | All hostnames or other host identifiers seen on your event. Example identifiers include FQDNs, domain names, workstation names, or aliases. | keyword |
| related.user | All the user names or other user identifiers seen on the event. | keyword |
| tags | List of keywords used to tag each event. | keyword |
| user.email | User email address. | keyword |
| user.id | Unique identifier of the user. | keyword |
| user.name | Short name or login of the user. | keyword |
| user.name.text | Multi-field of user.name. |
match_only_text |
Example
{
    "@timestamp": "2026-07-13T16:49:30.078Z",
    "agent": {
        "ephemeral_id": "1c11b942-f3cd-49ce-90be-6bf18cc0dca7",
        "id": "4f49a520-5e31-4eda-8941-f2131aa5a324",
        "name": "elastic-agent-87676",
        "type": "filebeat",
        "version": "9.4.3"
    },
    "data_stream": {
        "dataset": "kolide.request",
        "namespace": "47623",
        "type": "logs"
    },
    "ecs": {
        "version": "9.4.0"
    },
    "elastic_agent": {
        "id": "4f49a520-5e31-4eda-8941-f2131aa5a324",
        "snapshot": false,
        "version": "9.4.3"
    },
    "event": {
        "action": "exemption_request_open",
        "agent_id_status": "verified",
        "category": [
            "configuration",
            "iam"
        ],
        "dataset": "kolide.request",
        "id": "exemption-request-001",
        "ingested": "2026-07-13T16:49:33Z",
        "kind": "event",
        "module": "kolide",
        "original": "{\"_kolide_request_type\":\"exemption\",\"device_information\":{\"identifier\":\"200001\",\"link\":\"https://api.example.com/devices/200001\"},\"id\":\"exemption-request-001\",\"issues\":[{\"identifier\":\"9999\",\"link\":\"https://api.example.com/issues/9999\"}],\"requested_at\":\"2024-03-11T21:28:17Z\",\"requester_information\":{\"identifier\":\"100001\",\"link\":\"https://api.example.com/people/100001\"},\"requester_message\":\"Need temporary access for incident response\",\"status\":\"open\"}",
        "outcome": "unknown",
        "type": [
            "creation"
        ]
    },
    "host": {
        "id": "200001"
    },
    "input": {
        "type": "cel"
    },
    "kolide": {
        "request": {
            "created_at": "2024-03-11T21:28:17.000Z",
            "device": {
                "url": "https://api.example.com/devices/200001"
            },
            "id": "exemption-request-001",
            "issues": {
                "identifier": "9999",
                "link": "https://api.example.com/issues/9999"
            },
            "message": "Need temporary access for incident response",
            "requester": {
                "url": "https://api.example.com/people/100001"
            },
            "state": "open",
            "type": "exemption"
        }
    },
    "message": "Need temporary access for incident response",
    "related": {
        "hosts": [
            "200001"
        ],
        "user": [
            "100001"
        ]
    },
    "tags": [
        "preserve_original_event",
        "forwarded",
        "kolide-request"
    ],
    "user": {
        "id": "100001"
    }
}
The device data stream provides Kolide device inventory records and device-trust status changes. Because the GET /devices endpoint does not expose a modified-since cursor, each interval retrieves the complete collection. The ingest pipeline assigns a content-based document _id so unchanged devices are deduplicated across polls, while any change is captured as a new document.
Exported fields
| Field | Description | Type |
|---|---|---|
| @timestamp | Date/time when the event originated. This is the date/time extracted from the event, typically representing when the event was generated by the source. If the event source has no original timestamp, this value is typically populated by the first time the event was received by the pipeline. Required field for all events. | date |
| data_stream.dataset | The field can contain anything that makes sense to signify the source of the data. Examples include nginx.access, prometheus, endpoint etc. For data streams that otherwise fit, but that do not have dataset set we use the value "generic" for the dataset value. event.dataset should have the same value as data_stream.dataset. Beyond the Elasticsearch data stream naming criteria noted above, the dataset value has additional restrictions: * Must not contain - * No longer than 100 characters |
constant_keyword |
| data_stream.namespace | A user defined namespace. Namespaces are useful to allow grouping of data. Many users already organize their indices this way, and the data stream naming scheme now provides this best practice as a default. Many users will populate this field with default. If no value is used, it falls back to default. Beyond the Elasticsearch index naming criteria noted above, namespace value has the additional restrictions: * Must not contain - * No longer than 100 characters |
constant_keyword |
| data_stream.type | An overarching type for the data stream. Currently allowed values are "logs" and "metrics". We expect to also add "traces" and "synthetics" in the near future. | constant_keyword |
| ecs.version | ECS version this event conforms to. ecs.version is a required field and must exist in all events. When querying across multiple indices -- which may conform to slightly different ECS versions -- this field lets integrations adjust to the schema version of the events. |
keyword |
| error.message | Error message. | match_only_text |
| event.action | The action captured by the event. This describes the information in the event. It is more specific than event.category. Examples are group-add, process-started, file-created. The value is normally defined by the implementer. |
keyword |
| event.category | This is one of four ECS Categorization Fields, and indicates the second level in the ECS category hierarchy. event.category represents the "big buckets" of ECS categories. For example, filtering on event.category:process yields all events relating to process activity. This field is closely related to event.type, which is used as a subcategory. This field is an array. This will allow proper categorization of some events that fall in multiple categories. |
keyword |
| event.dataset | Name of the dataset. If an event source publishes more than one type of log or events (e.g. access log, error log), the dataset is used to specify which one the event comes from. It's recommended but not required to start the dataset name with the module name, followed by a dot, then the dataset name. | constant_keyword |
| event.id | Unique ID to describe the event. | keyword |
| event.kind | This is one of four ECS Categorization Fields, and indicates the highest level in the ECS category hierarchy. event.kind gives high-level information about what type of information the event contains, without being specific to the contents of the event. For example, values of this field distinguish alert events from metric events. The value of this field can be used to inform how these kinds of events should be handled. They may warrant different retention, different access control, it may also help understand whether the data is coming in at a regular interval or not. |
keyword |
| event.module | Name of the module this data is coming from. If your monitoring agent supports the concept of modules or plugins to process events of a given source (e.g. Apache logs), event.module should contain the name of this module. |
constant_keyword |
| event.original | Raw text message of entire event. Used to demonstrate log integrity or where the full log message (before splitting it up in multiple parts) may be required, e.g. for reindex. This field is not indexed and doc_values are disabled. It cannot be searched, but it can be retrieved from _source. If users wish to override this and index this field, please see Field data types in the Elasticsearch Reference. |
keyword |
| event.outcome | This is one of four ECS Categorization Fields, and indicates the lowest level in the ECS category hierarchy. event.outcome simply denotes whether the event represents a success or a failure from the perspective of the entity that produced the event. Note that when a single transaction is described in multiple events, each event may populate different values of event.outcome, according to their perspective. Also note that in the case of a compound event (a single event that contains multiple logical events), this field should be populated with the value that best captures the overall success or failure from the perspective of the event producer. Further note that not all events will have an associated outcome. For example, this field is generally not populated for metric events, events with event.type:info, or any events for which an outcome does not make logical sense. |
keyword |
| event.start | event.start contains the date when the event started or when the activity was first observed. |
date |
| event.type | This is one of four ECS Categorization Fields, and indicates the third level in the ECS category hierarchy. event.type represents a categorization "sub-bucket" that, when used along with the event.category field values, enables filtering events down to a level appropriate for single visualization. This field is an array. This will allow proper categorization of some events that fall in multiple event types. |
keyword |
| host.hostname | Hostname of the host. It normally contains what the hostname command returns on the host machine. |
keyword |
| host.id | Unique host id. As hostname is not always unique, use values that are meaningful in your environment. Example: The current usage of beat.name. |
keyword |
| host.name | Name of the host. It can contain what hostname returns on Unix systems, the fully qualified domain name (FQDN), or a name specified by the user. The recommended value is the lowercase FQDN of the host. | keyword |
| host.os.full | Operating system name, including the version or code name. | keyword |
| host.os.full.text | Multi-field of host.os.full. |
match_only_text |
| host.os.name | Operating system name, without the version. | keyword |
| host.os.name.text | Multi-field of host.os.name. |
match_only_text |
| host.os.platform | Operating system platform (such centos, ubuntu, windows). | keyword |
| host.os.type | Use the os.type field to categorize the operating system into one of the broad commercial families. If the OS you're dealing with is not listed as an expected value, the field should not be populated. Please let us know by opening an issue with ECS, to propose its addition. |
keyword |
| host.os.version | Operating system version as a raw string. | keyword |
| host.type | Type of host. For Cloud providers this can be the machine type like t2.medium. If vm, this could be the container, for example, or other information meaningful in your environment. |
keyword |
| input.type | Type of filebeat input. | keyword |
| kolide.device.auth_configuration.authentication_mode | Authentication mode, for example only_registered_owner or any_registered_person. |
keyword |
| kolide.device.auth_configuration.device_id | Identifier of the device the configuration applies to. | keyword |
| kolide.device.auth_configuration.person_groups | Person groups permitted to authenticate the device. | flattened |
| kolide.device.auth_state | Raw authentication state of the device reported by the API, for example Good or Blocked (API only). |
keyword |
| kolide.device.device_status | Raw device status reported by the device_trust.status_changed webhook, for example blocked (webhook only). |
keyword |
| kolide.device.device_url | API URL of the device record (webhook only). | keyword |
| kolide.device.form_factor | Form factor of the device, for example Computer. |
keyword |
| kolide.device.hardware_model | Hardware model identifier, for example MacBookPro18,1. |
keyword |
| kolide.device.hardware_uuid | Hardware UUID of the device. | keyword |
| kolide.device.last_authenticated_at | Timestamp at which the device last authenticated. | date |
| kolide.device.last_seen_at | Timestamp at which the device was last seen. | date |
| kolide.device.note | Free-form note associated with the device. | text |
| kolide.device.product_image_url | URL of the product image for the device hardware. | keyword |
| kolide.device.registered_at | Timestamp at which the device was registered. | date |
| kolide.device.registered_owner_info.identifier | Identifier of the registered owner. | keyword |
| kolide.device.registered_owner_info.location | API URL of the registered owner resource. | keyword |
| kolide.device.serial | Hardware serial number of the device. | keyword |
| kolide.device.status | Normalized (lowercase) device status, derived from the webhook device_status or the API auth_state. |
keyword |
| kolide.device.type | Type of device, one of Mac, Linux, Windows, iOS, or Android. |
keyword |
| kolide.device.will_block_at | Timestamp at which the device will be blocked, if any. | date |
| labels.is_transform_source | Distinguishes between documents that are a source for a transform and documents that are an output of a transform, to facilitate easier filtering. | constant_keyword |
| log.offset | Log offset. | long |
| related.hosts | All hostnames or other host identifiers seen on your event. Example identifiers include FQDNs, domain names, workstation names, or aliases. | keyword |
| related.user | All the user names or other user identifiers seen on the event. | keyword |
| tags | List of keywords used to tag each event. | keyword |
| user.email | User email address. | keyword |
| user.id | Unique identifier of the user. | keyword |
| user.name | Short name or login of the user. | keyword |
| user.name.text | Multi-field of user.name. |
match_only_text |
Example
{
    "@timestamp": "2026-07-13T16:41:33.883Z",
    "agent": {
        "ephemeral_id": "6dc17ec1-2f49-4b4a-899d-a50c23e3256a",
        "id": "8fc63088-0e7a-4b0a-80b6-d927c6b6fd64",
        "name": "elastic-agent-75041",
        "type": "filebeat",
        "version": "9.4.3"
    },
    "data_stream": {
        "dataset": "kolide.device",
        "namespace": "92721",
        "type": "logs"
    },
    "ecs": {
        "version": "9.4.0"
    },
    "elastic_agent": {
        "id": "8fc63088-0e7a-4b0a-80b6-d927c6b6fd64",
        "snapshot": false,
        "version": "9.4.3"
    },
    "event": {
        "action": "device",
        "agent_id_status": "verified",
        "category": [
            "host"
        ],
        "dataset": "kolide.device",
        "ingested": "2026-07-13T16:41:33Z",
        "kind": "state",
        "module": "kolide",
        "original": "{\"auth_configuration\":{\"authentication_mode\":\"only_registered_owner\",\"device_id\":\"1\",\"person_groups\":[]},\"auth_state\":\"Good\",\"device_type\":\"Mac\",\"form_factor\":\"Computer\",\"hardware_model\":\"MacBookPro18,1\",\"hardware_uuid\":\"00000000-0000-0000-0000-000000000000\",\"id\":\"1\",\"last_authenticated_at\":\"2024-03-11T21:28:17Z\",\"last_seen_at\":\"2024-03-11T21:30:00Z\",\"name\":\"Alices-MacBook-Pro\",\"note\":\"Loaner device\",\"operating_system\":\"macOS 14.4.1\",\"product_image_url\":\"https://example.com/images/macbookpro.png\",\"registered_at\":\"2023-10-28T20:12:14Z\",\"registered_owner_info\":{\"identifier\":\"1\",\"link\":\"https://api.example.com/people/1\"},\"serial\":\"C02EXAMPLE123\",\"will_block_at\":null}",
        "start": "2023-10-28T20:12:14.000Z",
        "type": [
            "info"
        ]
    },
    "host": {
        "hostname": "Alices-MacBook-Pro",
        "id": "1",
        "name": "Alices-MacBook-Pro",
        "os": {
            "full": "macOS 14.4.1",
            "name": "macOS",
            "platform": "mac",
            "type": "macos",
            "version": "14.4.1"
        },
        "type": "desktop"
    },
    "input": {
        "type": "cel"
    },
    "kolide": {
        "device": {
            "auth_configuration": {
                "authentication_mode": "only_registered_owner",
                "device_id": "1"
            },
            "auth_state": "Good",
            "form_factor": "Computer",
            "hardware_model": "MacBookPro18,1",
            "hardware_uuid": "00000000-0000-0000-0000-000000000000",
            "last_authenticated_at": "2024-03-11T21:28:17.000Z",
            "last_seen_at": "2024-03-11T21:30:00.000Z",
            "note": "Loaner device",
            "product_image_url": "https://example.com/images/macbookpro.png",
            "registered_at": "2023-10-28T20:12:14.000Z",
            "registered_owner_info": {
                "identifier": "1",
                "location": "https://api.example.com/people/1"
            },
            "serial": "C02EXAMPLE123",
            "status": "good",
            "type": "Mac"
        }
    },
    "related": {
        "hosts": [
            "Alices-MacBook-Pro"
        ]
    },
    "tags": [
        "preserve_original_event",
        "forwarded",
        "kolide-device"
    ],
    "user": {
        "id": "1"
    }
}
The people data stream provides Kolide identity records for active people using the GET /people endpoint. This includes Elastic Common Schema (ECS) user fields, SCIM-imported usernames, last-authentication time, and device-registration flags that Kolide exposes on this resource. Group, identity provider (IdP), SCIM, and deprovisioning details live on separate Kolide API resources like person_groups and deprovisioned_people that this data stream does not collect. Because the GET /people endpoint does not expose a modified-since cursor, each interval retrieves the complete collection. The ingest pipeline derives a content-fingerprint document _id, excluding last_authenticated_at, so byte-identical records are deduplicated across polls; records whose tracked fields change between polls are indexed as new documents rather than overwriting the prior one.
Exported fields
| Field | Description | Type |
|---|---|---|
| @timestamp | Date/time when the event originated. This is the date/time extracted from the event, typically representing when the event was generated by the source. If the event source has no original timestamp, this value is typically populated by the first time the event was received by the pipeline. Required field for all events. | date |
| data_stream.dataset | The field can contain anything that makes sense to signify the source of the data. Examples include nginx.access, prometheus, endpoint etc. For data streams that otherwise fit, but that do not have dataset set we use the value "generic" for the dataset value. event.dataset should have the same value as data_stream.dataset. Beyond the Elasticsearch data stream naming criteria noted above, the dataset value has additional restrictions: * Must not contain - * No longer than 100 characters |
constant_keyword |
| data_stream.namespace | A user defined namespace. Namespaces are useful to allow grouping of data. Many users already organize their indices this way, and the data stream naming scheme now provides this best practice as a default. Many users will populate this field with default. If no value is used, it falls back to default. Beyond the Elasticsearch index naming criteria noted above, namespace value has the additional restrictions: * Must not contain - * No longer than 100 characters |
constant_keyword |
| data_stream.type | An overarching type for the data stream. Currently allowed values are "logs" and "metrics". We expect to also add "traces" and "synthetics" in the near future. | constant_keyword |
| ecs.version | ECS version this event conforms to. ecs.version is a required field and must exist in all events. When querying across multiple indices -- which may conform to slightly different ECS versions -- this field lets integrations adjust to the schema version of the events. |
keyword |
| error.message | Error message. | match_only_text |
| event.action | The action captured by the event. This describes the information in the event. It is more specific than event.category. Examples are group-add, process-started, file-created. The value is normally defined by the implementer. |
keyword |
| event.category | This is one of four ECS Categorization Fields, and indicates the second level in the ECS category hierarchy. event.category represents the "big buckets" of ECS categories. For example, filtering on event.category:process yields all events relating to process activity. This field is closely related to event.type, which is used as a subcategory. This field is an array. This will allow proper categorization of some events that fall in multiple categories. |
keyword |
| event.dataset | Name of the dataset. If an event source publishes more than one type of log or events (e.g. access log, error log), the dataset is used to specify which one the event comes from. It's recommended but not required to start the dataset name with the module name, followed by a dot, then the dataset name. | constant_keyword |
| event.kind | This is one of four ECS Categorization Fields, and indicates the highest level in the ECS category hierarchy. event.kind gives high-level information about what type of information the event contains, without being specific to the contents of the event. For example, values of this field distinguish alert events from metric events. The value of this field can be used to inform how these kinds of events should be handled. They may warrant different retention, different access control, it may also help understand whether the data is coming in at a regular interval or not. |
keyword |
| event.module | Name of the module this data is coming from. If your monitoring agent supports the concept of modules or plugins to process events of a given source (e.g. Apache logs), event.module should contain the name of this module. |
constant_keyword |
| event.original | Raw text message of entire event. Used to demonstrate log integrity or where the full log message (before splitting it up in multiple parts) may be required, e.g. for reindex. This field is not indexed and doc_values are disabled. It cannot be searched, but it can be retrieved from _source. If users wish to override this and index this field, please see Field data types in the Elasticsearch Reference. |
keyword |
| event.type | This is one of four ECS Categorization Fields, and indicates the third level in the ECS category hierarchy. event.type represents a categorization "sub-bucket" that, when used along with the event.category field values, enables filtering events down to a level appropriate for single visualization. This field is an array. This will allow proper categorization of some events that fall in multiple event types. |
keyword |
| input.type | Type of filebeat input. | keyword |
| kolide.people.created_at | Timestamp at which the person record was created. | date |
| kolide.people.has_registered_device | Whether the person has at least one registered device. | boolean |
| kolide.people.id | Kolide person identifier. | keyword |
| kolide.people.last_authenticated_at | When the person last authenticated with Kolide. | date |
| kolide.people.usernames | Usernames imported from the SCIM provider associated with this person. | keyword |
| labels.is_transform_source | Distinguishes between documents that are a source for a transform and documents that are an output of a transform, to facilitate easier filtering. | constant_keyword |
| log.offset | Log offset. | long |
| related.user | All the user names or other user identifiers seen on the event. | keyword |
| tags | List of keywords used to tag each event. | keyword |
| user.email | User email address. | keyword |
| user.full_name | User's full name, if available. | keyword |
| user.full_name.text | Multi-field of user.full_name. |
match_only_text |
| user.id | Unique identifier of the user. | keyword |
| user.name | Short name or login of the user. | keyword |
| user.name.text | Multi-field of user.name. |
match_only_text |
Example
{
    "@timestamp": "2026-06-26T19:45:06.028069753Z",
    "data_stream": {
        "dataset": "kolide.people",
        "namespace": "default",
        "type": "logs"
    },
    "ecs": {
        "version": "9.4.0"
    },
    "event": {
        "action": "person",
        "category": [
            "iam"
        ],
        "dataset": "kolide.people",
        "kind": "state",
        "original": "{\"id\":\"861637\",\"name\":\"Alice Johnson\",\"email\":\"alice.johnson@example.com\",\"created_at\":\"2024-01-10T08:00:00Z\",\"last_authenticated_at\":\"2024-06-15T12:00:00Z\",\"has_registered_device\":true,\"usernames\":[\"alice.johnson@example.com\"]}",
        "type": [
            "user",
            "info"
        ]
    },
    "input": {
        "type": "cel"
    },
    "kolide": {
        "people": {
            "created_at": "2024-01-10T08:00:00.000Z",
            "has_registered_device": true,
            "id": "861637",
            "last_authenticated_at": "2024-06-15T12:00:00.000Z",
            "usernames": [
                "alice.johnson@example.com"
            ]
        }
    },
    "related": {
        "user": [
            "alice.johnson@example.com",
            "861637"
        ]
    },
    "tags": [
        "preserve_original_event",
        "forwarded",
        "kolide-people"
    ],
    "user": {
        "email": "alice.johnson@example.com",
        "full_name": "Alice Johnson",
        "id": "861637",
        "name": "alice.johnson@example.com"
    }
}
The deprovisioned_person data stream provides Kolide identity records for people who have been offboarded or deprovisioned using the GET /deprovisioned_people endpoint. This is a separate API resource from people rather than a field on the person object. You can use this data stream to detect lingering access or devices owned by departed identities. Unlike the people data stream, this resource does not return SCIM usernames, but it includes an api_url field that links back to the corresponding GET /people/{id} resource.
Because the GET /deprovisioned_people endpoint does not expose a modified-since cursor, each interval collects the complete collection. This full collection retrieval is intentional because an incremental approach cannot detect when records disappear from the list, for example when a user is re-provisioned, when a Kolide-side correction is made, or when records are missed because of pagination drift. The ingest pipeline derives a content-fingerprint document _id, excluding last_authenticated_at, so duplicate records are deduplicated across polls. Records with tracked fields that change between polls are indexed as new documents.
Exported fields
| Field | Description | Type |
|---|---|---|
| @timestamp | Date/time when the event originated. This is the date/time extracted from the event, typically representing when the event was generated by the source. If the event source has no original timestamp, this value is typically populated by the first time the event was received by the pipeline. Required field for all events. | date |
| data_stream.dataset | The field can contain anything that makes sense to signify the source of the data. Examples include nginx.access, prometheus, endpoint etc. For data streams that otherwise fit, but that do not have dataset set we use the value "generic" for the dataset value. event.dataset should have the same value as data_stream.dataset. Beyond the Elasticsearch data stream naming criteria noted above, the dataset value has additional restrictions: * Must not contain - * No longer than 100 characters |
constant_keyword |
| data_stream.namespace | A user defined namespace. Namespaces are useful to allow grouping of data. Many users already organize their indices this way, and the data stream naming scheme now provides this best practice as a default. Many users will populate this field with default. If no value is used, it falls back to default. Beyond the Elasticsearch index naming criteria noted above, namespace value has the additional restrictions: * Must not contain - * No longer than 100 characters |
constant_keyword |
| data_stream.type | An overarching type for the data stream. Currently allowed values are "logs" and "metrics". We expect to also add "traces" and "synthetics" in the near future. | constant_keyword |
| ecs.version | ECS version this event conforms to. ecs.version is a required field and must exist in all events. When querying across multiple indices -- which may conform to slightly different ECS versions -- this field lets integrations adjust to the schema version of the events. |
keyword |
| error.message | Error message. | match_only_text |
| event.action | The action captured by the event. This describes the information in the event. It is more specific than event.category. Examples are group-add, process-started, file-created. The value is normally defined by the implementer. |
keyword |
| event.category | This is one of four ECS Categorization Fields, and indicates the second level in the ECS category hierarchy. event.category represents the "big buckets" of ECS categories. For example, filtering on event.category:process yields all events relating to process activity. This field is closely related to event.type, which is used as a subcategory. This field is an array. This will allow proper categorization of some events that fall in multiple categories. |
keyword |
| event.dataset | Name of the dataset. If an event source publishes more than one type of log or events (e.g. access log, error log), the dataset is used to specify which one the event comes from. It's recommended but not required to start the dataset name with the module name, followed by a dot, then the dataset name. | constant_keyword |
| event.kind | This is one of four ECS Categorization Fields, and indicates the highest level in the ECS category hierarchy. event.kind gives high-level information about what type of information the event contains, without being specific to the contents of the event. For example, values of this field distinguish alert events from metric events. The value of this field can be used to inform how these kinds of events should be handled. They may warrant different retention, different access control, it may also help understand whether the data is coming in at a regular interval or not. |
keyword |
| event.module | Name of the module this data is coming from. If your monitoring agent supports the concept of modules or plugins to process events of a given source (e.g. Apache logs), event.module should contain the name of this module. |
constant_keyword |
| event.original | Raw text message of entire event. Used to demonstrate log integrity or where the full log message (before splitting it up in multiple parts) may be required, e.g. for reindex. This field is not indexed and doc_values are disabled. It cannot be searched, but it can be retrieved from _source. If users wish to override this and index this field, please see Field data types in the Elasticsearch Reference. |
keyword |
| event.type | This is one of four ECS Categorization Fields, and indicates the third level in the ECS category hierarchy. event.type represents a categorization "sub-bucket" that, when used along with the event.category field values, enables filtering events down to a level appropriate for single visualization. This field is an array. This will allow proper categorization of some events that fall in multiple event types. |
keyword |
| input.type | Type of filebeat input. | keyword |
| kolide.deprovisioned_person.api_url | Kolide REST API URL for the corresponding person resource. Points at GET /people/{id}, not a /deprovisioned_people path. | keyword |
| kolide.deprovisioned_person.created_at | Timestamp at which the person record was originally created. | date |
| kolide.deprovisioned_person.has_registered_device | Whether the person had at least one registered device at the time of deprovisioning. | boolean |
| kolide.deprovisioned_person.id | Kolide person identifier. | keyword |
| kolide.deprovisioned_person.last_authenticated_at | When the person last authenticated with Kolide, prior to deprovisioning. | date |
| log.offset | Log offset. | long |
| related.user | All the user names or other user identifiers seen on the event. | keyword |
| tags | List of keywords used to tag each event. | keyword |
| user.email | User email address. | keyword |
| user.full_name | User's full name, if available. | keyword |
| user.full_name.text | Multi-field of user.full_name. |
match_only_text |
| user.id | Unique identifier of the user. | keyword |
| user.name | Short name or login of the user. | keyword |
| user.name.text | Multi-field of user.name. |
match_only_text |
Example
{
    "@timestamp": "2026-06-26T19:45:06.028069753Z",
    "data_stream": {
        "dataset": "kolide.deprovisioned_person",
        "namespace": "default",
        "type": "logs"
    },
    "ecs": {
        "version": "9.4.0"
    },
    "event": {
        "action": "person_deprovisioned",
        "category": [
            "iam"
        ],
        "dataset": "kolide.deprovisioned_person",
        "kind": "state",
        "original": "{\"id\":\"861637\",\"name\":\"Alice Johnson\",\"email\":\"alice.johnson@example.com\",\"created_at\":\"2026-06-04T18:29:22.129Z\",\"last_authenticated_at\":\"2024-06-15T12:00:00Z\",\"has_registered_device\":false,\"api_url\":\"https://api.kolide.com/people/861637\"}",
        "type": [
            "user",
            "info"
        ]
    },
    "input": {
        "type": "cel"
    },
    "kolide": {
        "deprovisioned_person": {
            "api_url": "https://api.kolide.com/people/861637",
            "created_at": "2026-06-04T18:29:22.129Z",
            "has_registered_device": false,
            "id": "861637",
            "last_authenticated_at": "2024-06-15T12:00:00.000Z"
        }
    },
    "related": {
        "user": [
            "alice.johnson@example.com",
            "861637"
        ]
    },
    "tags": [
        "preserve_original_event",
        "forwarded",
        "kolide-deprovisioned-person"
    ],
    "user": {
        "email": "alice.johnson@example.com",
        "full_name": "Alice Johnson",
        "id": "861637",
        "name": "alice.johnson@example.com"
    }
}
The audit data stream provides the Kolide administrative audit log of console actions using the GET /audit_logs endpoint.
Exported fields
| Field | Description | Type |
|---|---|---|
| @timestamp | Date/time when the event originated. This is the date/time extracted from the event, typically representing when the event was generated by the source. If the event source has no original timestamp, this value is typically populated by the first time the event was received by the pipeline. Required field for all events. | date |
| aws.s3.bucket.arn | The AWS S3 bucket ARN. | keyword |
| aws.s3.bucket.name | The AWS S3 bucket name. | keyword |
| aws.s3.object.key | The AWS S3 object key. | keyword |
| data_stream.dataset | The field can contain anything that makes sense to signify the source of the data. Examples include nginx.access, prometheus, endpoint etc. For data streams that otherwise fit, but that do not have dataset set we use the value "generic" for the dataset value. event.dataset should have the same value as data_stream.dataset. Beyond the Elasticsearch data stream naming criteria noted above, the dataset value has additional restrictions: * Must not contain - * No longer than 100 characters |
constant_keyword |
| data_stream.namespace | A user defined namespace. Namespaces are useful to allow grouping of data. Many users already organize their indices this way, and the data stream naming scheme now provides this best practice as a default. Many users will populate this field with default. If no value is used, it falls back to default. Beyond the Elasticsearch index naming criteria noted above, namespace value has the additional restrictions: * Must not contain - * No longer than 100 characters |
constant_keyword |
| data_stream.type | An overarching type for the data stream. Currently allowed values are "logs" and "metrics". We expect to also add "traces" and "synthetics" in the near future. | constant_keyword |
| ecs.version | ECS version this event conforms to. ecs.version is a required field and must exist in all events. When querying across multiple indices -- which may conform to slightly different ECS versions -- this field lets integrations adjust to the schema version of the events. |
keyword |
| error.message | Error message. | match_only_text |
| event.action | The action captured by the event. This describes the information in the event. It is more specific than event.category. Examples are group-add, process-started, file-created. The value is normally defined by the implementer. |
keyword |
| event.category | This is one of four ECS Categorization Fields, and indicates the second level in the ECS category hierarchy. event.category represents the "big buckets" of ECS categories. For example, filtering on event.category:process yields all events relating to process activity. This field is closely related to event.type, which is used as a subcategory. This field is an array. This will allow proper categorization of some events that fall in multiple categories. |
keyword |
| event.dataset | Name of the dataset. If an event source publishes more than one type of log or events (e.g. access log, error log), the dataset is used to specify which one the event comes from. It's recommended but not required to start the dataset name with the module name, followed by a dot, then the dataset name. | constant_keyword |
| event.id | Unique ID to describe the event. | keyword |
| event.kind | This is one of four ECS Categorization Fields, and indicates the highest level in the ECS category hierarchy. event.kind gives high-level information about what type of information the event contains, without being specific to the contents of the event. For example, values of this field distinguish alert events from metric events. The value of this field can be used to inform how these kinds of events should be handled. They may warrant different retention, different access control, it may also help understand whether the data is coming in at a regular interval or not. |
keyword |
| event.module | Name of the module this data is coming from. If your monitoring agent supports the concept of modules or plugins to process events of a given source (e.g. Apache logs), event.module should contain the name of this module. |
constant_keyword |
| event.original | Raw text message of entire event. Used to demonstrate log integrity or where the full log message (before splitting it up in multiple parts) may be required, e.g. for reindex. This field is not indexed and doc_values are disabled. It cannot be searched, but it can be retrieved from _source. If users wish to override this and index this field, please see Field data types in the Elasticsearch Reference. |
keyword |
| event.outcome | This is one of four ECS Categorization Fields, and indicates the lowest level in the ECS category hierarchy. event.outcome simply denotes whether the event represents a success or a failure from the perspective of the entity that produced the event. Note that when a single transaction is described in multiple events, each event may populate different values of event.outcome, according to their perspective. Also note that in the case of a compound event (a single event that contains multiple logical events), this field should be populated with the value that best captures the overall success or failure from the perspective of the event producer. Further note that not all events will have an associated outcome. For example, this field is generally not populated for metric events, events with event.type:info, or any events for which an outcome does not make logical sense. |
keyword |
| event.type | This is one of four ECS Categorization Fields, and indicates the third level in the ECS category hierarchy. event.type represents a categorization "sub-bucket" that, when used along with the event.category field values, enables filtering events down to a level appropriate for single visualization. This field is an array. This will allow proper categorization of some events that fall in multiple event types. |
keyword |
| gcs.storage.bucket.name | The GCS bucket name. | keyword |
| gcs.storage.object.content_type | The content type of the GCS object. | keyword |
| gcs.storage.object.name | The GCS object name. | keyword |
| host.hostname | Hostname of the host. It normally contains what the hostname command returns on the host machine. |
keyword |
| host.name | Name of the host. It can contain what hostname returns on Unix systems, the fully qualified domain name (FQDN), or a name specified by the user. The recommended value is the lowercase FQDN of the host. | keyword |
| input.type | Type of filebeat input. | keyword |
| kolide.audit.actor_automated | True when the action was performed by a non-human actor (actor_type is ApiKey or System); false for human actors. Useful for filtering automated activity. |
boolean |
| kolide.audit.actor_type | Type of actor that performed the audited action, one of User, ApiKey, or System. |
keyword |
| kolide.audit.change.field | Name of the setting that was changed. | keyword |
| kolide.audit.change.from | Previous value of the setting. | keyword |
| kolide.audit.change.groups_from | Previous set of allowed groups for a device registration auth mode change. | keyword |
| kolide.audit.change.groups_to | New set of allowed groups for a device registration auth mode change. | keyword |
| kolide.audit.change.to | New value of the setting. | keyword |
| kolide.audit.expires_at | Expiry date for an exemption, as a human-readable string from the audit log. | keyword |
| kolide.audit.reason | Human-provided reason for an exemption, approval, or denial. | keyword |
| kolide.audit.target.api_key_name | Name or label of the API key that was revealed or created. | keyword |
| kolide.audit.target.app_name | Name of the managed web application affected by the action. | keyword |
| kolide.audit.target.campaign_id | Identifier of the live query campaign affected by the action. | keyword |
| kolide.audit.target.check_names | Names of the checks set as required for device registration. | keyword |
| kolide.audit.target.config_type | Type of the configuration that was updated. | keyword |
| kolide.audit.target.count | Count of members or people associated with the audited object. | long |
| kolide.audit.target.destination_name | Name of the log pipeline destination affected by the action. | keyword |
| kolide.audit.target.destination_type | Type of the log pipeline destination (for example Amazon S3, Splunk HEC). |
keyword |
| kolide.audit.target.device_id | Numeric identifier of the device affected by the action. | keyword |
| kolide.audit.target.device_serial | Serial number of the device affected by the action. | keyword |
| kolide.audit.target.feature | Name of the feature whose restriction was changed for a user. | keyword |
| kolide.audit.target.fim_category | Name of the osquery FIM (file integrity monitoring) category affected by the action. | keyword |
| kolide.audit.target.group_name | Name of the device group affected by the action. | keyword |
| kolide.audit.target.idp_url | URL or hostname of the identity provider. | keyword |
| kolide.audit.target.issue_id | Numeric identifier of the issue affected by the action. | keyword |
| kolide.audit.target.logger_name | Name of the device property logger added or removed. | keyword |
| kolide.audit.target.okta_event | Name of the Okta event hook received (for example saml_idp_factor_setup). |
keyword |
| kolide.audit.target.org_id | Numeric identifier of the organization. | keyword |
| kolide.audit.target.org_name | Display name of the organization. | keyword |
| kolide.audit.target.osquery_name | Name of the osquery decorator affected by the action. | keyword |
| kolide.audit.target.pack_name | Name of the osquery pack affected by the action. | keyword |
| kolide.audit.target.platform | Device platform referenced by a device registration configuration change (for example macOS, Windows). |
keyword |
| kolide.audit.target.prev_status | Previous status of a reopened device registration or exemption request (for example denied or approved). |
keyword |
| kolide.audit.target.provider_name | Name of the device management provider. | keyword |
| kolide.audit.target.query_name | Name of the osquery discovery or pack query affected by the action. | keyword |
| kolide.audit.target.tables | Osquery tables referenced by a live query campaign. | keyword |
| kolide.audit.target.webhook_url | URL of the webhook affected by a developer webhook action. | keyword |
| log.offset | Log offset. | long |
| message | For log events the message field contains the log message, optimized for viewing in a log viewer. For structured logs without an original message field, other fields can be concatenated to form a human-readable summary of the event. If multiple messages exist, they can be combined into one message. | match_only_text |
| related.hosts | All hostnames or other host identifiers seen on your event. Example identifiers include FQDNs, domain names, workstation names, or aliases. | keyword |
| related.ip | All of the IPs seen on your event. | ip |
| related.user | All the user names or other user identifiers seen on the event. | keyword |
| rule.name | The name of the rule or signature generating the event. | keyword |
| source.as.number | Unique number allocated to the autonomous system. The autonomous system number (ASN) uniquely identifies each network on the Internet. | long |
| source.as.organization.name | Organization name. | keyword |
| source.as.organization.name.text | Multi-field of source.as.organization.name. |
match_only_text |
| source.geo.city_name | City name. | keyword |
| source.geo.continent_name | Name of the continent. | keyword |
| source.geo.country_iso_code | Country ISO code. | keyword |
| source.geo.country_name | Country name. | keyword |
| source.geo.location.lat | Longitude and latitude. | geo_point |
| source.geo.location.lon | Longitude and latitude. | geo_point |
| source.geo.region_iso_code | Region ISO code. | keyword |
| source.geo.region_name | Region name. | keyword |
| source.ip | IP address of the source (IPv4 or IPv6). | ip |
| tags | List of keywords used to tag each event. | keyword |
| url.domain | Domain of the url, such as "www.elastic.co". In some cases a URL may refer to an IP and/or port directly, without a domain name. In this case, the IP address would go to the domain field. If the URL contains a literal IPv6 address enclosed by [ and ] (IETF RFC 2732), the [ and ] characters should also be captured in the domain field. |
keyword |
| user.email | User email address. | keyword |
| user.name | Short name or login of the user. | keyword |
| user.name.text | Multi-field of user.name. |
match_only_text |
| user.target.email | User email address. | keyword |
| user.target.name | Short name or login of the user. | keyword |
| user.target.name.text | Multi-field of user.target.name. |
match_only_text |
Example
{
    "@timestamp": "2024-03-11T21:28:17.000Z",
    "agent": {
        "ephemeral_id": "976911ab-bf56-45ea-b463-1ee8c348bb5f",
        "id": "ab1e36dd-3a4a-4a94-95c7-8b8250ae7ee3",
        "name": "elastic-agent-27061",
        "type": "filebeat",
        "version": "9.4.3"
    },
    "data_stream": {
        "dataset": "kolide.audit",
        "namespace": "56604",
        "type": "logs"
    },
    "ecs": {
        "version": "9.4.0"
    },
    "elastic_agent": {
        "id": "ab1e36dd-3a4a-4a94-95c7-8b8250ae7ee3",
        "snapshot": false,
        "version": "9.4.3"
    },
    "event": {
        "action": "check_enabled",
        "agent_id_status": "verified",
        "category": [
            "configuration"
        ],
        "dataset": "kolide.audit",
        "id": "01JA67B1DYJCKJ1J73T0F5EWGR",
        "ingested": "2026-07-13T16:59:33Z",
        "kind": "event",
        "module": "kolide",
        "original": "{\"actor_info\":{\"actor_email\":\"alice@example.com\",\"actor_name\":\"Alice Johnson\",\"actor_type\":\"User\"},\"actor_name\":\"Alice Johnson\",\"description\":\"Enabled check 'iTerm2 - Require Secure Keyboard Entry to Be Enabled'\",\"id\":\"01JA67B1DYJCKJ1J73T0F5EWGR\",\"timestamp\":\"2024-03-11T21:28:17Z\"}",
        "type": [
            "change"
        ]
    },
    "input": {
        "type": "cel"
    },
    "kolide": {
        "audit": {
            "actor_automated": false,
            "actor_type": "User"
        }
    },
    "message": "Enabled check 'iTerm2 - Require Secure Keyboard Entry to Be Enabled'",
    "related": {
        "user": [
            "Alice Johnson",
            "alice@example.com"
        ]
    },
    "rule": {
        "name": "iTerm2 - Require Secure Keyboard Entry to Be Enabled"
    },
    "tags": [
        "preserve_original_event",
        "forwarded",
        "kolide-audit"
    ],
    "user": {
        "email": "alice@example.com",
        "name": "Alice Johnson"
    }
}
The device_check data stream provides Kolide device check-run results delivered through the Kolide Log Pipeline using an Amazon S3 bucket. You can configure this using Amazon SQS notifications or direct bucket polling. Unlike the issues data stream, which tracks the failure lifecycle, this stream records every check run, including these check statuses:
passingfailinginapplicableunknown
Exported fields
| Field | Description | Type |
|---|---|---|
| @timestamp | Date/time when the event originated. This is the date/time extracted from the event, typically representing when the event was generated by the source. If the event source has no original timestamp, this value is typically populated by the first time the event was received by the pipeline. Required field for all events. | date |
| aws.s3.bucket.arn | The AWS S3 bucket ARN. | keyword |
| aws.s3.bucket.name | The AWS S3 bucket name. | keyword |
| aws.s3.object.key | The AWS S3 object key. | keyword |
| data_stream.dataset | The field can contain anything that makes sense to signify the source of the data. Examples include nginx.access, prometheus, endpoint etc. For data streams that otherwise fit, but that do not have dataset set we use the value "generic" for the dataset value. event.dataset should have the same value as data_stream.dataset. Beyond the Elasticsearch data stream naming criteria noted above, the dataset value has additional restrictions: * Must not contain - * No longer than 100 characters |
constant_keyword |
| data_stream.namespace | A user defined namespace. Namespaces are useful to allow grouping of data. Many users already organize their indices this way, and the data stream naming scheme now provides this best practice as a default. Many users will populate this field with default. If no value is used, it falls back to default. Beyond the Elasticsearch index naming criteria noted above, namespace value has the additional restrictions: * Must not contain - * No longer than 100 characters |
constant_keyword |
| data_stream.type | An overarching type for the data stream. Currently allowed values are "logs" and "metrics". We expect to also add "traces" and "synthetics" in the near future. | constant_keyword |
| ecs.version | ECS version this event conforms to. ecs.version is a required field and must exist in all events. When querying across multiple indices -- which may conform to slightly different ECS versions -- this field lets integrations adjust to the schema version of the events. |
keyword |
| error.message | Error message. | match_only_text |
| event.action | The action captured by the event. This describes the information in the event. It is more specific than event.category. Examples are group-add, process-started, file-created. The value is normally defined by the implementer. |
keyword |
| event.category | This is one of four ECS Categorization Fields, and indicates the second level in the ECS category hierarchy. event.category represents the "big buckets" of ECS categories. For example, filtering on event.category:process yields all events relating to process activity. This field is closely related to event.type, which is used as a subcategory. This field is an array. This will allow proper categorization of some events that fall in multiple categories. |
keyword |
| event.dataset | Name of the dataset. If an event source publishes more than one type of log or events (e.g. access log, error log), the dataset is used to specify which one the event comes from. It's recommended but not required to start the dataset name with the module name, followed by a dot, then the dataset name. | constant_keyword |
| event.id | Unique ID to describe the event. | keyword |
| event.kind | This is one of four ECS Categorization Fields, and indicates the highest level in the ECS category hierarchy. event.kind gives high-level information about what type of information the event contains, without being specific to the contents of the event. For example, values of this field distinguish alert events from metric events. The value of this field can be used to inform how these kinds of events should be handled. They may warrant different retention, different access control, it may also help understand whether the data is coming in at a regular interval or not. |
keyword |
| event.module | Name of the module this data is coming from. If your monitoring agent supports the concept of modules or plugins to process events of a given source (e.g. Apache logs), event.module should contain the name of this module. |
constant_keyword |
| event.original | Raw text message of entire event. Used to demonstrate log integrity or where the full log message (before splitting it up in multiple parts) may be required, e.g. for reindex. This field is not indexed and doc_values are disabled. It cannot be searched, but it can be retrieved from _source. If users wish to override this and index this field, please see Field data types in the Elasticsearch Reference. |
keyword |
| event.outcome | This is one of four ECS Categorization Fields, and indicates the lowest level in the ECS category hierarchy. event.outcome simply denotes whether the event represents a success or a failure from the perspective of the entity that produced the event. Note that when a single transaction is described in multiple events, each event may populate different values of event.outcome, according to their perspective. Also note that in the case of a compound event (a single event that contains multiple logical events), this field should be populated with the value that best captures the overall success or failure from the perspective of the event producer. Further note that not all events will have an associated outcome. For example, this field is generally not populated for metric events, events with event.type:info, or any events for which an outcome does not make logical sense. |
keyword |
| event.type | This is one of four ECS Categorization Fields, and indicates the third level in the ECS category hierarchy. event.type represents a categorization "sub-bucket" that, when used along with the event.category field values, enables filtering events down to a level appropriate for single visualization. This field is an array. This will allow proper categorization of some events that fall in multiple event types. |
keyword |
| gcs.storage.bucket.name | The GCS bucket name. | keyword |
| gcs.storage.object.content_type | The content type of the GCS object. | keyword |
| gcs.storage.object.name | The GCS object name. | keyword |
| host.id | Unique host id. As hostname is not always unique, use values that are meaningful in your environment. Example: The current usage of beat.name. |
keyword |
| input.type | Type of filebeat input. | keyword |
| kolide.device_check.check_id | Numeric identifier of the check that was run. | long |
| kolide.device_check.check_result_data | The per-check result rows produced by the run. The shape varies by check, so the array is stored as a flattened field rather than mapping each key. | flattened |
| kolide.device_check.check_slug | Slug identifying the check, for example unencrypted or macos_remote_login. |
keyword |
| kolide.device_check.device_id | Numeric identifier of the device the check was run against. | long |
| kolide.device_check.status | Outcome of the check run. One of passing, failing, inapplicable, or unknown. |
keyword |
| log.offset | Log offset. | long |
| related.hosts | All hostnames or other host identifiers seen on your event. Example identifiers include FQDNs, domain names, workstation names, or aliases. | keyword |
| rule.id | A rule ID that is unique within the scope of an agent, observer, or other entity using the rule for detection of this event. | keyword |
| rule.name | The name of the rule or signature generating the event. | keyword |
| tags | List of keywords used to tag each event. | keyword |
Example
{
    "@timestamp": "2026-06-02T15:45:01.000Z",
    "agent": {
        "ephemeral_id": "7688604a-e3eb-4d25-a462-28596cd3c236",
        "id": "c4e7e825-937b-4db3-a16a-67072d1169fa",
        "name": "elastic-agent-75667",
        "type": "filebeat",
        "version": "9.4.3"
    },
    "cloud": {
        "provider": "google cloud"
    },
    "data_stream": {
        "dataset": "kolide.device_check",
        "namespace": "77666",
        "type": "logs"
    },
    "ecs": {
        "version": "9.4.0"
    },
    "elastic_agent": {
        "id": "c4e7e825-937b-4db3-a16a-67072d1169fa",
        "snapshot": false,
        "version": "9.4.3"
    },
    "event": {
        "action": "check_result",
        "agent_id_status": "verified",
        "category": [
            "host"
        ],
        "dataset": "kolide.device_check",
        "id": "7386319-10-2026-06-02T15:45:01Z",
        "ingested": "2026-07-13T16:43:34Z",
        "kind": "state",
        "module": "kolide",
        "original": "{\"type\":\"check_result\",\"timestamp\":\"2026-06-02T15:45:01Z\",\"data\":{\"check_id\":10,\"check_slug\":\"macos_file_sharing\",\"device_id\":7386319,\"status\":\"passing\",\"check_result_data\":[{\"file_sharing\":\"0\",\"current_os_version\":\"26.4.1\",\"KOLIDE_CHECK_STATUS\":\"PASS\"}]}}",
        "outcome": "success",
        "type": [
            "info"
        ]
    },
    "gcs": {
        "storage": {
            "bucket": {
                "name": "kolide-device-check"
            },
            "object": {
                "content_type": "application/x-ndjson",
                "name": "kolide-device-check.log"
            }
        }
    },
    "host": {
        "id": "7386319"
    },
    "input": {
        "type": "gcs"
    },
    "kolide": {
        "device_check": {
            "check_id": 10,
            "check_result_data": {
                "KOLIDE_CHECK_STATUS": "PASS",
                "current_os_version": "26.4.1",
                "file_sharing": "0"
            },
            "check_slug": "macos_file_sharing",
            "device_id": 7386319,
            "status": "passing"
        }
    },
    "log": {
        "file": {
            "path": "gs://kolide-device-check/kolide-device-check.log"
        },
        "offset": 1670
    },
    "rule": {
        "id": "10",
        "name": "macos_file_sharing"
    },
    "tags": [
        "preserve_original_event",
        "forwarded",
        "kolide-device-check-gcs"
    ]
}
The osquery_result data stream provides raw osquery Result Logs delivered through the Kolide Log Pipeline using Amazon S3 or Google Cloud Storage under the kolide/results/ prefix. This includes both snapshot-query rows and differential (added and removed) rows. Per-query column data in kolide.osquery_result.added, kolide.osquery_result.removed, or kolide.osquery_result.snapshot is arbitrary and depends on the target osquery table or custom SQL, so it is stored as a flattened field rather than mapped per column.
Exported fields
| Field | Description | Type |
|---|---|---|
| @timestamp | Date/time when the event originated. This is the date/time extracted from the event, typically representing when the event was generated by the source. If the event source has no original timestamp, this value is typically populated by the first time the event was received by the pipeline. Required field for all events. | date |
| aws.s3.bucket.arn | The AWS S3 bucket ARN. | keyword |
| aws.s3.bucket.name | The AWS S3 bucket name. | keyword |
| aws.s3.object.key | The AWS S3 object key. | keyword |
| data_stream.dataset | The field can contain anything that makes sense to signify the source of the data. Examples include nginx.access, prometheus, endpoint etc. For data streams that otherwise fit, but that do not have dataset set we use the value "generic" for the dataset value. event.dataset should have the same value as data_stream.dataset. Beyond the Elasticsearch data stream naming criteria noted above, the dataset value has additional restrictions: * Must not contain - * No longer than 100 characters |
constant_keyword |
| data_stream.namespace | A user defined namespace. Namespaces are useful to allow grouping of data. Many users already organize their indices this way, and the data stream naming scheme now provides this best practice as a default. Many users will populate this field with default. If no value is used, it falls back to default. Beyond the Elasticsearch index naming criteria noted above, namespace value has the additional restrictions: * Must not contain - * No longer than 100 characters |
constant_keyword |
| data_stream.type | An overarching type for the data stream. Currently allowed values are "logs" and "metrics". We expect to also add "traces" and "synthetics" in the near future. | constant_keyword |
| device.manufacturer | The vendor name of the device manufacturer. | keyword |
| device.model.name | The human readable marketing name of the device model. | keyword |
| ecs.version | ECS version this event conforms to. ecs.version is a required field and must exist in all events. When querying across multiple indices -- which may conform to slightly different ECS versions -- this field lets integrations adjust to the schema version of the events. |
keyword |
| error.message | Error message. | match_only_text |
| event.action | The action captured by the event. This describes the information in the event. It is more specific than event.category. Examples are group-add, process-started, file-created. The value is normally defined by the implementer. |
keyword |
| event.category | This is one of four ECS Categorization Fields, and indicates the second level in the ECS category hierarchy. event.category represents the "big buckets" of ECS categories. For example, filtering on event.category:process yields all events relating to process activity. This field is closely related to event.type, which is used as a subcategory. This field is an array. This will allow proper categorization of some events that fall in multiple categories. |
keyword |
| event.dataset | Name of the dataset. If an event source publishes more than one type of log or events (e.g. access log, error log), the dataset is used to specify which one the event comes from. It's recommended but not required to start the dataset name with the module name, followed by a dot, then the dataset name. | constant_keyword |
| event.id | Unique ID to describe the event. | keyword |
| event.kind | This is one of four ECS Categorization Fields, and indicates the highest level in the ECS category hierarchy. event.kind gives high-level information about what type of information the event contains, without being specific to the contents of the event. For example, values of this field distinguish alert events from metric events. The value of this field can be used to inform how these kinds of events should be handled. They may warrant different retention, different access control, it may also help understand whether the data is coming in at a regular interval or not. |
keyword |
| event.module | Name of the module this data is coming from. If your monitoring agent supports the concept of modules or plugins to process events of a given source (e.g. Apache logs), event.module should contain the name of this module. |
constant_keyword |
| event.original | Raw text message of entire event. Used to demonstrate log integrity or where the full log message (before splitting it up in multiple parts) may be required, e.g. for reindex. This field is not indexed and doc_values are disabled. It cannot be searched, but it can be retrieved from _source. If users wish to override this and index this field, please see Field data types in the Elasticsearch Reference. |
keyword |
| event.sequence | Sequence number of the event. The sequence number is a value published by some event sources, to make the exact ordering of events unambiguous, regardless of the timestamp precision. | long |
| event.type | This is one of four ECS Categorization Fields, and indicates the third level in the ECS category hierarchy. event.type represents a categorization "sub-bucket" that, when used along with the event.category field values, enables filtering events down to a level appropriate for single visualization. This field is an array. This will allow proper categorization of some events that fall in multiple event types. |
keyword |
| gcs.storage.bucket.name | The GCS bucket name. | keyword |
| gcs.storage.object.content_type | The content type of the GCS object. | keyword |
| gcs.storage.object.name | The GCS object name. | keyword |
| host.geo.city_name | City name. | keyword |
| host.geo.continent_name | Name of the continent. | keyword |
| host.geo.country_iso_code | Country ISO code. | keyword |
| host.geo.country_name | Country name. | keyword |
| host.geo.location.lat | Longitude and latitude. | geo_point |
| host.geo.location.lon | Longitude and latitude. | geo_point |
| host.geo.region_iso_code | Region ISO code. | keyword |
| host.geo.region_name | Region name. | keyword |
| host.hostname | Hostname of the host. It normally contains what the hostname command returns on the host machine. |
keyword |
| host.id | Unique host id. As hostname is not always unique, use values that are meaningful in your environment. Example: The current usage of beat.name. |
keyword |
| host.ip | Host ip addresses. | ip |
| host.name | Name of the host. It can contain what hostname returns on Unix systems, the fully qualified domain name (FQDN), or a name specified by the user. The recommended value is the lowercase FQDN of the host. | keyword |
| input.type | Type of filebeat input. | keyword |
| kolide.osquery_result.added | Rows added since the last differential run (diffResults.added). The shape is arbitrary and depends on which osquery table or custom SQL the query targets, so it is stored as a flattened field rather than mapping each key. |
flattened |
| kolide.osquery_result.calendar_time | Osquery's human-readable, locale-dependent timestamp string. @timestamp (derived from unixTime) is authoritative; this is kept only for reference. |
keyword |
| kolide.osquery_result.counter | Osquery's per-epoch row counter, also copied to event.sequence. |
long |
| kolide.osquery_result.device_registered_at | When the reporting device was registered to its owner in Kolide (kolide_decorations.device_registered_at). |
date |
| kolide.osquery_result.device_serial | Serial number of the reporting device, from Kolide's device decoration (kolide_decorations.serial_number, falling back to decorations.hardware_serial). No ECS host-serial field exists, so this stays custom. |
keyword |
| kolide.osquery_result.enrolled_at | When the reporting device enrolled with Kolide (kolide_decorations.enrolled_at). |
date |
| kolide.osquery_result.epoch | Osquery's log-rotation epoch for this query. | long |
| kolide.osquery_result.hardware_uuid | Hardware UUID of the reporting device, from Kolide's device decoration (kolide_decorations.hardware_uuid, falling back to decorations.uuid). |
keyword |
| kolide.osquery_result.hardware_version | Hardware version string from osquery's own decorator block (decorations.hardware_version). No ECS equivalent. |
keyword |
| kolide.osquery_result.host_identifier | Osquery's own host identifier string (typically a UUID or hostname, depending on the host's --host_identifier configuration). Kept for correlation/debugging alongside the more reliable host.id/host.name sourced from Kolide's device decoration. |
keyword |
| kolide.osquery_result.numerics | Whether osquery is configured to emit numeric-typed columns as native JSON numbers rather than strings (numerics envelope field). |
boolean |
| kolide.osquery_result.pack_name | Name of the osquery pack (parsed from the name envelope field, e.g. pack:kolide_log_pipeline:\<pack_name\>:\<query_name\>). |
keyword |
| kolide.osquery_result.query_name | Name of the osquery query within the pack. Also mirrored to rule.name. |
keyword |
| kolide.osquery_result.removed | Rows removed since the last differential run (diffResults.removed). Same arbitrary-shape rationale as added. |
flattened |
| kolide.osquery_result.request_id | Kolide Log Pipeline request ID (a ULID) for this delivery. Unique per object, used as the deduplication key for event.id. |
keyword |
| kolide.osquery_result.snapshot | The snapshot query's row values (an array of column-value objects). The shape is arbitrary and depends on which osquery table or custom SQL the query targets, so it is stored as a flattened field rather than mapping each key. | flattened |
| log.offset | Log offset. | long |
| related.hosts | All hostnames or other host identifiers seen on your event. Example identifiers include FQDNs, domain names, workstation names, or aliases. | keyword |
| related.ip | All of the IPs seen on your event. | ip |
| related.user | All the user names or other user identifiers seen on the event. | keyword |
| rule.name | The name of the rule or signature generating the event. | keyword |
| tags | List of keywords used to tag each event. | keyword |
| user.email | User email address. | keyword |
| user.full_name | User's full name, if available. | keyword |
| user.full_name.text | Multi-field of user.full_name. |
match_only_text |
| user.id | Unique identifier of the user. | keyword |
Example
{
    "@timestamp": "2026-06-18T16:43:50.000Z",
    "agent": {
        "ephemeral_id": "53e3433b-e37f-4ae9-a175-ed2b4200692b",
        "id": "86ee9ece-8678-4857-9f5c-d4900a1942de",
        "name": "elastic-agent-75298",
        "type": "filebeat",
        "version": "9.4.3"
    },
    "cloud": {
        "provider": "google cloud"
    },
    "data_stream": {
        "dataset": "kolide.osquery_result",
        "namespace": "20432",
        "type": "logs"
    },
    "device": {
        "manufacturer": "Apple Inc.",
        "model": {
            "name": "Mac16,8"
        }
    },
    "ecs": {
        "version": "9.4.0"
    },
    "elastic_agent": {
        "id": "86ee9ece-8678-4857-9f5c-d4900a1942de",
        "snapshot": false,
        "version": "9.4.3"
    },
    "event": {
        "action": "differential",
        "agent_id_status": "verified",
        "category": [
            "host"
        ],
        "dataset": "kolide.osquery_result",
        "id": "01KVDSXT59W05PA85B3C24V2HV",
        "ingested": "2026-07-13T16:46:33Z",
        "kind": "event",
        "module": "kolide",
        "original": "{\"diffResults\": {\"removed\": [], \"added\": [{\"datetime\": \"2026-06-18T16:43:50Z\", \"day\": \"18\", \"hour\": \"16\", \"iso_8601\": \"2026-06-18T16:43:50Z\", \"local_timezone\": \"EDT\", \"minutes\": \"43\", \"month\": \"6\", \"seconds\": \"50\", \"timestamp\": \"Thu Jun 18 16:43:50 2026 UTC\", \"timezone\": \"UTC\", \"unix_time\": \"1781801030\", \"weekday\": \"Thursday\", \"year\": \"2026\"}]}, \"name\": \"pack:kolide_log_pipeline:example_noisy_pack:current_time\", \"hostIdentifier\": \"00000000-0000-0000-0000-000000000001\", \"calendarTime\": \"Thu Jun 18 16:43:50 2026 UTC\", \"unixTime\": 1781801030, \"epoch\": 1781800669, \"counter\": 0, \"numerics\": false, \"decorations\": {\"computer_name\": \"Test User's MacBook Pro\", \"hardware_model\": \"Mac16,8\", \"hardware_serial\": \"TESTSERIAL0001\", \"hardware_vendor\": \"Apple Inc.\", \"hardware_version\": \"\", \"hostname\": \"test-macbook-pro\", \"local_hostname\": \"test-macbook-pro\", \"uuid\": \"00000000-0000-0000-0000-000000000001\"}, \"kolide_decorations\": {\"device_id\": 9000000, \"device_display_name\": \"test-macbook-pro\", \"remote_ip\": \"203.0.113.5\", \"serial_number\": \"TESTSERIAL0001\", \"hardware_uuid\": \"00000000-0000-0000-0000-000000000001\", \"enrolled_at\": \"2026-06-18T16:37:49.943Z\", \"device_registered_owner_id\": 9100000, \"device_registered_owner_name\": \"Test User\", \"device_registered_owner_email\": \"test.user@example.com\", \"device_registered_at\": \"2026-06-18T16:38:12.195Z\"}, \"request_id\": \"01KVDSXT59W05PA85B3C24V2HV\", \"type\": \"results_log\"}",
        "sequence": 0,
        "type": [
            "change"
        ]
    },
    "gcs": {
        "storage": {
            "bucket": {
                "name": "kolide-osquery-result"
            },
            "object": {
                "content_type": "application/x-ndjson",
                "name": "kolide-osquery-result.log"
            }
        }
    },
    "host": {
        "geo": {
            "city_name": "Madrid",
            "continent_name": "Europe",
            "country_iso_code": "ES",
            "country_name": "Spain",
            "location": {
                "coordinates": [
                    -3.702500034123659,
                    40.416389987803996
                ],
                "type": "Point"
            },
            "region_iso_code": "ES-M",
            "region_name": "Madrid"
        },
        "hostname": "test-macbook-pro",
        "id": "9000000",
        "ip": [
            "203.0.113.5"
        ],
        "name": "test-macbook-pro"
    },
    "input": {
        "type": "gcs"
    },
    "kolide": {
        "osquery_result": {
            "added": {
                "datetime": "2026-06-18T16:43:50Z",
                "day": "18",
                "hour": "16",
                "iso_8601": "2026-06-18T16:43:50Z",
                "local_timezone": "EDT",
                "minutes": "43",
                "month": "6",
                "seconds": "50",
                "timestamp": "Thu Jun 18 16:43:50 2026 UTC",
                "timezone": "UTC",
                "unix_time": "1781801030",
                "weekday": "Thursday",
                "year": "2026"
            },
            "calendar_time": "Thu Jun 18 16:43:50 2026 UTC",
            "counter": 0,
            "device_registered_at": "2026-06-18T16:38:12.195Z",
            "device_serial": "TESTSERIAL0001",
            "enrolled_at": "2026-06-18T16:37:49.943Z",
            "epoch": 1781800669,
            "hardware_uuid": "00000000-0000-0000-0000-000000000001",
            "host_identifier": "00000000-0000-0000-0000-000000000001",
            "numerics": false,
            "pack_name": "example_noisy_pack",
            "query_name": "current_time",
            "request_id": "01KVDSXT59W05PA85B3C24V2HV"
        }
    },
    "log": {
        "file": {
            "path": "gs://kolide-osquery-result/kolide-osquery-result.log"
        },
        "offset": 3529
    },
    "related": {
        "hosts": [
            "test-macbook-pro"
        ],
        "ip": [
            "203.0.113.5"
        ],
        "user": [
            "test.user@example.com"
        ]
    },
    "rule": {
        "name": "current_time"
    },
    "tags": [
        "preserve_original_event",
        "forwarded",
        "kolide-osquery-result-gcs"
    ],
    "user": {
        "email": "test.user@example.com",
        "full_name": "Test User",
        "id": "9100000"
    }
}
The osquery_status data stream provides raw osquery Status Logs, which contain GLOG-style telemetry about the osquery daemon itself, delivered through the Kolide Log Pipeline using Amazon S3 or Google Cloud Storage under the kolide/status/ prefix.
Exported fields
| Field | Description | Type |
|---|---|---|
| @timestamp | Date/time when the event originated. This is the date/time extracted from the event, typically representing when the event was generated by the source. If the event source has no original timestamp, this value is typically populated by the first time the event was received by the pipeline. Required field for all events. | date |
| aws.s3.bucket.arn | The AWS S3 bucket ARN. | keyword |
| aws.s3.bucket.name | The AWS S3 bucket name. | keyword |
| aws.s3.object.key | The AWS S3 object key. | keyword |
| data_stream.dataset | The field can contain anything that makes sense to signify the source of the data. Examples include nginx.access, prometheus, endpoint etc. For data streams that otherwise fit, but that do not have dataset set we use the value "generic" for the dataset value. event.dataset should have the same value as data_stream.dataset. Beyond the Elasticsearch data stream naming criteria noted above, the dataset value has additional restrictions: * Must not contain - * No longer than 100 characters |
constant_keyword |
| data_stream.namespace | A user defined namespace. Namespaces are useful to allow grouping of data. Many users already organize their indices this way, and the data stream naming scheme now provides this best practice as a default. Many users will populate this field with default. If no value is used, it falls back to default. Beyond the Elasticsearch index naming criteria noted above, namespace value has the additional restrictions: * Must not contain - * No longer than 100 characters |
constant_keyword |
| data_stream.type | An overarching type for the data stream. Currently allowed values are "logs" and "metrics". We expect to also add "traces" and "synthetics" in the near future. | constant_keyword |
| ecs.version | ECS version this event conforms to. ecs.version is a required field and must exist in all events. When querying across multiple indices -- which may conform to slightly different ECS versions -- this field lets integrations adjust to the schema version of the events. |
keyword |
| error.message | Error message. | match_only_text |
| event.action | The action captured by the event. This describes the information in the event. It is more specific than event.category. Examples are group-add, process-started, file-created. The value is normally defined by the implementer. |
keyword |
| event.category | This is one of four ECS Categorization Fields, and indicates the second level in the ECS category hierarchy. event.category represents the "big buckets" of ECS categories. For example, filtering on event.category:process yields all events relating to process activity. This field is closely related to event.type, which is used as a subcategory. This field is an array. This will allow proper categorization of some events that fall in multiple categories. |
keyword |
| event.dataset | Name of the dataset. If an event source publishes more than one type of log or events (e.g. access log, error log), the dataset is used to specify which one the event comes from. It's recommended but not required to start the dataset name with the module name, followed by a dot, then the dataset name. | constant_keyword |
| event.id | Unique ID to describe the event. | keyword |
| event.kind | This is one of four ECS Categorization Fields, and indicates the highest level in the ECS category hierarchy. event.kind gives high-level information about what type of information the event contains, without being specific to the contents of the event. For example, values of this field distinguish alert events from metric events. The value of this field can be used to inform how these kinds of events should be handled. They may warrant different retention, different access control, it may also help understand whether the data is coming in at a regular interval or not. |
keyword |
| event.module | Name of the module this data is coming from. If your monitoring agent supports the concept of modules or plugins to process events of a given source (e.g. Apache logs), event.module should contain the name of this module. |
constant_keyword |
| event.original | Raw text message of entire event. Used to demonstrate log integrity or where the full log message (before splitting it up in multiple parts) may be required, e.g. for reindex. This field is not indexed and doc_values are disabled. It cannot be searched, but it can be retrieved from _source. If users wish to override this and index this field, please see Field data types in the Elasticsearch Reference. |
keyword |
| event.type | This is one of four ECS Categorization Fields, and indicates the third level in the ECS category hierarchy. event.type represents a categorization "sub-bucket" that, when used along with the event.category field values, enables filtering events down to a level appropriate for single visualization. This field is an array. This will allow proper categorization of some events that fall in multiple event types. |
keyword |
| gcs.storage.bucket.name | The GCS bucket name. | keyword |
| gcs.storage.object.content_type | The content type of the GCS object. | keyword |
| gcs.storage.object.name | The GCS object name. | keyword |
| host.hostname | Hostname of the host. It normally contains what the hostname command returns on the host machine. |
keyword |
| host.id | Unique host id. As hostname is not always unique, use values that are meaningful in your environment. Example: The current usage of beat.name. |
keyword |
| host.ip | Host ip addresses. | ip |
| host.name | Name of the host. It can contain what hostname returns on Unix systems, the fully qualified domain name (FQDN), or a name specified by the user. The recommended value is the lowercase FQDN of the host. | keyword |
| input.type | Type of filebeat input. | keyword |
| kolide.osquery_status.device_registered_at | When the reporting device was registered to its owner in Kolide (kolide_decorations.device_registered_at). |
date |
| kolide.osquery_status.device_serial | Serial number of the reporting device, from Kolide's device decoration (kolide_decorations.serial_number). No ECS host-serial field exists, so this stays custom. |
keyword |
| kolide.osquery_status.enrolled_at | When the reporting device enrolled with Kolide (kolide_decorations.enrolled_at). |
date |
| kolide.osquery_status.hardware_uuid | Hardware UUID of the reporting device, from Kolide's device decoration (kolide_decorations.hardware_uuid). |
keyword |
| kolide.osquery_status.host_identifier | Osquery's own host identifier string (typically a UUID or hostname, depending on the host's --host_identifier configuration). Kept for correlation/debugging alongside the more reliable host.id/host.name sourced from Kolide's device decoration. |
keyword |
| kolide.osquery_status.request_id | Kolide Log Pipeline request ID (a ULID) for this delivery. Unique per object, used as the deduplication key for event.id. |
keyword |
| kolide.osquery_status.severity | Raw GLOG severity level (0=INFO, 1=WARNING, 2=ERROR, 3=FATAL), alongside the derived log.level. |
keyword |
| log.level | Original log level of the log event. If the source of the event provides a log level or textual severity, this is the one that goes in log.level. If your source doesn't specify one, you may put your event transport's severity here (e.g. Syslog severity). Some examples are warn, err, i, informational. |
keyword |
| log.offset | Log offset. | long |
| log.origin.file.line | The line number of the file containing the source code which originated the log event. | long |
| log.origin.file.name | The name of the file containing the source code which originated the log event. Note that this field is not meant to capture the log file. The correct field to capture the log file is log.file.path. |
keyword |
| message | For log events the message field contains the log message, optimized for viewing in a log viewer. For structured logs without an original message field, other fields can be concatenated to form a human-readable summary of the event. If multiple messages exist, they can be combined into one message. | match_only_text |
| related.hosts | All hostnames or other host identifiers seen on your event. Example identifiers include FQDNs, domain names, workstation names, or aliases. | keyword |
| related.ip | All of the IPs seen on your event. | ip |
| tags | List of keywords used to tag each event. | keyword |
| user.email | User email address. | keyword |
| user.full_name | User's full name, if available. | keyword |
| user.full_name.text | Multi-field of user.full_name. |
match_only_text |
| user.id | Unique identifier of the user. | keyword |
Example
{
    "@timestamp": "2026-06-18T19:00:26.000Z",
    "agent": {
        "ephemeral_id": "9f74f21b-f382-453b-b998-382eb95ec979",
        "id": "4bb46e82-a5cd-4ba2-8ca9-c78cc61c4f1b",
        "name": "elastic-agent-47155",
        "type": "filebeat",
        "version": "9.4.3"
    },
    "cloud": {
        "provider": "google cloud"
    },
    "data_stream": {
        "dataset": "kolide.osquery_status",
        "namespace": "68723",
        "type": "logs"
    },
    "ecs": {
        "version": "9.4.0"
    },
    "elastic_agent": {
        "id": "4bb46e82-a5cd-4ba2-8ca9-c78cc61c4f1b",
        "snapshot": false,
        "version": "9.4.3"
    },
    "event": {
        "action": "osquery_status",
        "agent_id_status": "verified",
        "category": [
            "process"
        ],
        "dataset": "kolide.osquery_status",
        "id": "01KVE1Q4W257B537D5PJD6DN7F",
        "ingested": "2026-07-13T16:48:43Z",
        "kind": "event",
        "module": "kolide",
        "original": "{\"s\": 0, \"f\": \"preferences.cpp\", \"i\": 318, \"m\": \"Cannot find/read defaults plist from path: /Library/Preferences/com.apple.TimeMachine.plist\", \"h\": \"00000000-0000-0000-0000-000000000001\", \"c\": \"Thu Jun 18 19:00:26 2026 UTC\", \"u\": 1781809226, \"kolide_decorations\": {\"device_id\": 9000000, \"device_display_name\": \"test-macbook-pro\", \"remote_ip\": \"203.0.113.5\", \"serial_number\": \"TESTSERIAL0001\", \"hardware_uuid\": \"00000000-0000-0000-0000-000000000001\", \"enrolled_at\": \"2026-06-18T16:37:49.943Z\", \"device_registered_owner_id\": 9100000, \"device_registered_owner_name\": \"Test User\", \"device_registered_owner_email\": \"test.user@example.com\", \"device_registered_at\": \"2026-06-18T16:38:12.195Z\"}, \"request_id\": \"01KVE1Q4W257B537D5PJD6DN7F\", \"type\": \"status_log\"}",
        "type": [
            "info"
        ]
    },
    "gcs": {
        "storage": {
            "bucket": {
                "name": "kolide-osquery-status"
            },
            "object": {
                "content_type": "application/x-ndjson",
                "name": "kolide-osquery-status.log"
            }
        }
    },
    "host": {
        "hostname": "test-macbook-pro",
        "id": "9000000",
        "ip": [
            "203.0.113.5"
        ],
        "name": "test-macbook-pro"
    },
    "input": {
        "type": "gcs"
    },
    "kolide": {
        "osquery_status": {
            "device_registered_at": "2026-06-18T16:38:12.195Z",
            "device_serial": "TESTSERIAL0001",
            "enrolled_at": "2026-06-18T16:37:49.943Z",
            "hardware_uuid": "00000000-0000-0000-0000-000000000001",
            "host_identifier": "00000000-0000-0000-0000-000000000001",
            "request_id": "01KVE1Q4W257B537D5PJD6DN7F",
            "severity": "0"
        }
    },
    "log": {
        "file": {
            "path": "gs://kolide-osquery-status/kolide-osquery-status.log"
        },
        "level": "info",
        "offset": 689,
        "origin": {
            "file": {
                "line": 318,
                "name": "preferences.cpp"
            }
        }
    },
    "message": "Cannot find/read defaults plist from path: /Library/Preferences/com.apple.TimeMachine.plist",
    "related": {
        "hosts": [
            "test-macbook-pro"
        ],
        "ip": [
            "203.0.113.5"
        ]
    },
    "tags": [
        "preserve_original_event",
        "forwarded",
        "kolide-osquery-status-gcs"
    ],
    "user": {
        "email": "test.user@example.com",
        "full_name": "Test User",
        "id": "9100000"
    }
}
- Description: Latest devices from Kolide. As devices get updated, this transform stores only the latest state of each device inside the destination index. Thus the transform's destination index contains only the latest state of the device.
- Source Index: logs-kolide.device-*
- Destination Index: logs-kolide_latest.dest_device-2
Exported fields
| Field | Description | Type |
|---|---|---|
| @timestamp | Date/time when the event originated. This is the date/time extracted from the event, typically representing when the event was generated by the source. If the event source has no original timestamp, this value is typically populated by the first time the event was received by the pipeline. Required field for all events. | date |
| agent.ephemeral_id | Ephemeral identifier of this agent (if one exists). This id normally changes across restarts, but agent.id does not. |
keyword |
| agent.id | Unique identifier of this agent (if one exists). Example: For Beats this would be beat.id. | keyword |
| agent.name | Custom name of the agent. This is a name that can be given to an agent. This can be helpful if for example two Filebeat instances are running on the same host but a human readable separation is needed on which Filebeat instance data is coming from. | keyword |
| agent.type | Type of the agent. The agent type always stays the same and should be given by the agent used. In case of Filebeat the agent would always be Filebeat also if two Filebeat instances are run on the same machine. | keyword |
| agent.version | Version of the agent. | keyword |
| data_stream.dataset | The field can contain anything that makes sense to signify the source of the data. Examples include nginx.access, prometheus, endpoint etc. For data streams that otherwise fit, but that do not have dataset set we use the value "generic" for the dataset value. event.dataset should have the same value as data_stream.dataset. Beyond the Elasticsearch data stream naming criteria noted above, the dataset value has additional restrictions: * Must not contain - * No longer than 100 characters |
constant_keyword |
| data_stream.namespace | A user defined namespace. Namespaces are useful to allow grouping of data. Many users already organize their indices this way, and the data stream naming scheme now provides this best practice as a default. Many users will populate this field with default. If no value is used, it falls back to default. Beyond the Elasticsearch index naming criteria noted above, namespace value has the additional restrictions: * Must not contain - * No longer than 100 characters |
constant_keyword |
| data_stream.type | An overarching type for the data stream. Currently allowed values are "logs" and "metrics". We expect to also add "traces" and "synthetics" in the near future. | constant_keyword |
| ecs.version | ECS version this event conforms to. ecs.version is a required field and must exist in all events. When querying across multiple indices -- which may conform to slightly different ECS versions -- this field lets integrations adjust to the schema version of the events. |
keyword |
| error.message | Error message. | match_only_text |
| event.action | The action captured by the event. This describes the information in the event. It is more specific than event.category. Examples are group-add, process-started, file-created. The value is normally defined by the implementer. |
keyword |
| event.agent_id_status | Agents are normally responsible for populating the agent.id field value. If the system receiving events is capable of validating the value based on authentication information for the client then this field can be used to reflect the outcome of that validation. For example if the agent's connection is authenticated with mTLS and the client cert contains the ID of the agent to which the cert was issued then the agent.id value in events can be checked against the certificate. If the values match then event.agent_id_status: verified is added to the event, otherwise one of the other allowed values should be used. If no validation is performed then the field should be omitted. The allowed values are: verified - The agent.id field value matches expected value obtained from auth metadata. mismatch - The agent.id field value does not match the expected value obtained from auth metadata. missing - There was no agent.id field in the event to validate. auth_metadata_missing - There was no auth metadata or it was missing information about the agent ID. |
keyword |
| event.category | This is one of four ECS Categorization Fields, and indicates the second level in the ECS category hierarchy. event.category represents the "big buckets" of ECS categories. For example, filtering on event.category:process yields all events relating to process activity. This field is closely related to event.type, which is used as a subcategory. This field is an array. This will allow proper categorization of some events that fall in multiple categories. |
keyword |
| event.dataset | Name of the dataset. If an event source publishes more than one type of log or events (e.g. access log, error log), the dataset is used to specify which one the event comes from. It's recommended but not required to start the dataset name with the module name, followed by a dot, then the dataset name. | constant_keyword |
| event.id | Unique ID to describe the event. | keyword |
| event.ingested | Timestamp when an event arrived in the central data store. This is different from @timestamp, which is when the event originally occurred. It's also different from event.created, which is meant to capture the first time an agent saw the event. In normal conditions, assuming no tampering, the timestamps should chronologically look like this: @timestamp < event.created < event.ingested. |
date |
| event.kind | This is one of four ECS Categorization Fields, and indicates the highest level in the ECS category hierarchy. event.kind gives high-level information about what type of information the event contains, without being specific to the contents of the event. For example, values of this field distinguish alert events from metric events. The value of this field can be used to inform how these kinds of events should be handled. They may warrant different retention, different access control, it may also help understand whether the data is coming in at a regular interval or not. |
keyword |
| event.module | Name of the module this data is coming from. If your monitoring agent supports the concept of modules or plugins to process events of a given source (e.g. Apache logs), event.module should contain the name of this module. |
constant_keyword |
| event.original | Raw text message of entire event. Used to demonstrate log integrity or where the full log message (before splitting it up in multiple parts) may be required, e.g. for reindex. This field is not indexed and doc_values are disabled. It cannot be searched, but it can be retrieved from _source. If users wish to override this and index this field, please see Field data types in the Elasticsearch Reference. |
keyword |
| event.outcome | This is one of four ECS Categorization Fields, and indicates the lowest level in the ECS category hierarchy. event.outcome simply denotes whether the event represents a success or a failure from the perspective of the entity that produced the event. Note that when a single transaction is described in multiple events, each event may populate different values of event.outcome, according to their perspective. Also note that in the case of a compound event (a single event that contains multiple logical events), this field should be populated with the value that best captures the overall success or failure from the perspective of the event producer. Further note that not all events will have an associated outcome. For example, this field is generally not populated for metric events, events with event.type:info, or any events for which an outcome does not make logical sense. |
keyword |
| event.start | event.start contains the date when the event started or when the activity was first observed. |
date |
| event.type | This is one of four ECS Categorization Fields, and indicates the third level in the ECS category hierarchy. event.type represents a categorization "sub-bucket" that, when used along with the event.category field values, enables filtering events down to a level appropriate for single visualization. This field is an array. This will allow proper categorization of some events that fall in multiple event types. |
keyword |
| host.hostname | Hostname of the host. It normally contains what the hostname command returns on the host machine. |
keyword |
| host.id | Unique host id. As hostname is not always unique, use values that are meaningful in your environment. Example: The current usage of beat.name. |
keyword |
| host.name | Name of the host. It can contain what hostname returns on Unix systems, the fully qualified domain name (FQDN), or a name specified by the user. The recommended value is the lowercase FQDN of the host. | keyword |
| host.os.full | Operating system name, including the version or code name. | keyword |
| host.os.full.text | Multi-field of host.os.full. |
match_only_text |
| host.os.name | Operating system name, without the version. | keyword |
| host.os.name.text | Multi-field of host.os.name. |
match_only_text |
| host.os.platform | Operating system platform (such centos, ubuntu, windows). | keyword |
| host.os.type | Use the os.type field to categorize the operating system into one of the broad commercial families. If the OS you're dealing with is not listed as an expected value, the field should not be populated. Please let us know by opening an issue with ECS, to propose its addition. |
keyword |
| host.os.version | Operating system version as a raw string. | keyword |
| host.type | Type of host. For Cloud providers this can be the machine type like t2.medium. If vm, this could be the container, for example, or other information meaningful in your environment. |
keyword |
| input.type | Type of filebeat input. | keyword |
| kolide.device.auth_configuration.authentication_mode | Authentication mode, for example only_registered_owner or any_registered_person. |
keyword |
| kolide.device.auth_configuration.device_id | Identifier of the device the configuration applies to. | keyword |
| kolide.device.auth_configuration.person_groups | Person groups permitted to authenticate the device. | flattened |
| kolide.device.auth_state | Raw authentication state of the device reported by the API, for example Good or Blocked (API only). |
keyword |
| kolide.device.device_status | Raw device status reported by the device_trust.status_changed webhook, for example blocked (webhook only). |
keyword |
| kolide.device.device_url | API URL of the device record (webhook only). | keyword |
| kolide.device.form_factor | Form factor of the device, for example Computer. |
keyword |
| kolide.device.hardware_model | Hardware model identifier, for example MacBookPro18,1. |
keyword |
| kolide.device.hardware_uuid | Hardware UUID of the device. | keyword |
| kolide.device.last_authenticated_at | Timestamp at which the device last authenticated. | date |
| kolide.device.last_seen_at | Timestamp at which the device was last seen. | date |
| kolide.device.note | Free-form note associated with the device. | text |
| kolide.device.product_image_url | URL of the product image for the device hardware. | keyword |
| kolide.device.registered_at | Timestamp at which the device was registered. | date |
| kolide.device.registered_owner_info.identifier | Identifier of the registered owner. | keyword |
| kolide.device.registered_owner_info.location | API URL of the registered owner resource. | keyword |
| kolide.device.serial | Hardware serial number of the device. | keyword |
| kolide.device.status | Normalized (lowercase) device status, derived from the webhook device_status or the API auth_state. |
keyword |
| kolide.device.type | Type of device, one of Mac, Linux, Windows, iOS, or Android. |
keyword |
| kolide.device.will_block_at | Timestamp at which the device will be blocked, if any. | date |
| labels.is_transform_source | Distinguishes between documents that are a source for a transform and documents that are an output of a transform, to facilitate easier filtering. | constant_keyword |
| log.offset | Log offset. | long |
| related.hosts | All hostnames or other host identifiers seen on your event. Example identifiers include FQDNs, domain names, workstation names, or aliases. | keyword |
| related.user | All the user names or other user identifiers seen on the event. | keyword |
| tags | List of keywords used to tag each event. | keyword |
| user.email | User email address. | keyword |
| user.id | Unique identifier of the user. | keyword |
| user.name | Short name or login of the user. | keyword |
| user.name.text | Multi-field of user.name. |
match_only_text |
- Description: Latest people from Kolide. As people get updated, this transform stores only the latest state of each person inside the destination index. Thus the transform's destination index contains only the latest state of the person.
- Source Index: logs-kolide.people-*
- Destination Index: logs-kolide_latest.dest_people-2
Exported fields
| Field | Description | Type |
|---|---|---|
| @timestamp | Date/time when the event originated. This is the date/time extracted from the event, typically representing when the event was generated by the source. If the event source has no original timestamp, this value is typically populated by the first time the event was received by the pipeline. Required field for all events. | date |
| agent.ephemeral_id | Ephemeral identifier of this agent (if one exists). This id normally changes across restarts, but agent.id does not. |
keyword |
| agent.id | Unique identifier of this agent (if one exists). Example: For Beats this would be beat.id. | keyword |
| agent.name | Custom name of the agent. This is a name that can be given to an agent. This can be helpful if for example two Filebeat instances are running on the same host but a human readable separation is needed on which Filebeat instance data is coming from. | keyword |
| agent.type | Type of the agent. The agent type always stays the same and should be given by the agent used. In case of Filebeat the agent would always be Filebeat also if two Filebeat instances are run on the same machine. | keyword |
| agent.version | Version of the agent. | keyword |
| data_stream.dataset | The field can contain anything that makes sense to signify the source of the data. Examples include nginx.access, prometheus, endpoint etc. For data streams that otherwise fit, but that do not have dataset set we use the value "generic" for the dataset value. event.dataset should have the same value as data_stream.dataset. Beyond the Elasticsearch data stream naming criteria noted above, the dataset value has additional restrictions: * Must not contain - * No longer than 100 characters |
constant_keyword |
| data_stream.namespace | A user defined namespace. Namespaces are useful to allow grouping of data. Many users already organize their indices this way, and the data stream naming scheme now provides this best practice as a default. Many users will populate this field with default. If no value is used, it falls back to default. Beyond the Elasticsearch index naming criteria noted above, namespace value has the additional restrictions: * Must not contain - * No longer than 100 characters |
constant_keyword |
| data_stream.type | An overarching type for the data stream. Currently allowed values are "logs" and "metrics". We expect to also add "traces" and "synthetics" in the near future. | constant_keyword |
| ecs.version | ECS version this event conforms to. ecs.version is a required field and must exist in all events. When querying across multiple indices -- which may conform to slightly different ECS versions -- this field lets integrations adjust to the schema version of the events. |
keyword |
| error.message | Error message. | match_only_text |
| event.action | The action captured by the event. This describes the information in the event. It is more specific than event.category. Examples are group-add, process-started, file-created. The value is normally defined by the implementer. |
keyword |
| event.agent_id_status | Agents are normally responsible for populating the agent.id field value. If the system receiving events is capable of validating the value based on authentication information for the client then this field can be used to reflect the outcome of that validation. For example if the agent's connection is authenticated with mTLS and the client cert contains the ID of the agent to which the cert was issued then the agent.id value in events can be checked against the certificate. If the values match then event.agent_id_status: verified is added to the event, otherwise one of the other allowed values should be used. If no validation is performed then the field should be omitted. The allowed values are: verified - The agent.id field value matches expected value obtained from auth metadata. mismatch - The agent.id field value does not match the expected value obtained from auth metadata. missing - There was no agent.id field in the event to validate. auth_metadata_missing - There was no auth metadata or it was missing information about the agent ID. |
keyword |
| event.category | This is one of four ECS Categorization Fields, and indicates the second level in the ECS category hierarchy. event.category represents the "big buckets" of ECS categories. For example, filtering on event.category:process yields all events relating to process activity. This field is closely related to event.type, which is used as a subcategory. This field is an array. This will allow proper categorization of some events that fall in multiple categories. |
keyword |
| event.dataset | Name of the dataset. If an event source publishes more than one type of log or events (e.g. access log, error log), the dataset is used to specify which one the event comes from. It's recommended but not required to start the dataset name with the module name, followed by a dot, then the dataset name. | constant_keyword |
| event.ingested | Timestamp when an event arrived in the central data store. This is different from @timestamp, which is when the event originally occurred. It's also different from event.created, which is meant to capture the first time an agent saw the event. In normal conditions, assuming no tampering, the timestamps should chronologically look like this: @timestamp < event.created < event.ingested. |
date |
| event.kind | This is one of four ECS Categorization Fields, and indicates the highest level in the ECS category hierarchy. event.kind gives high-level information about what type of information the event contains, without being specific to the contents of the event. For example, values of this field distinguish alert events from metric events. The value of this field can be used to inform how these kinds of events should be handled. They may warrant different retention, different access control, it may also help understand whether the data is coming in at a regular interval or not. |
keyword |
| event.module | Name of the module this data is coming from. If your monitoring agent supports the concept of modules or plugins to process events of a given source (e.g. Apache logs), event.module should contain the name of this module. |
constant_keyword |
| event.original | Raw text message of entire event. Used to demonstrate log integrity or where the full log message (before splitting it up in multiple parts) may be required, e.g. for reindex. This field is not indexed and doc_values are disabled. It cannot be searched, but it can be retrieved from _source. If users wish to override this and index this field, please see Field data types in the Elasticsearch Reference. |
keyword |
| event.type | This is one of four ECS Categorization Fields, and indicates the third level in the ECS category hierarchy. event.type represents a categorization "sub-bucket" that, when used along with the event.category field values, enables filtering events down to a level appropriate for single visualization. This field is an array. This will allow proper categorization of some events that fall in multiple event types. |
keyword |
| input.type | Type of filebeat input. | keyword |
| kolide.people.created_at | Timestamp at which the person record was created. | date |
| kolide.people.has_registered_device | Whether the person has at least one registered device. | boolean |
| kolide.people.id | Kolide person identifier. | keyword |
| kolide.people.last_authenticated_at | When the person last authenticated with Kolide. | date |
| kolide.people.usernames | Usernames imported from the SCIM provider associated with this person. | keyword |
| labels.is_transform_source | Distinguishes between documents that are a source for a transform and documents that are an output of a transform, to facilitate easier filtering. | constant_keyword |
| log.offset | Log offset. | long |
| related.user | All the user names or other user identifiers seen on the event. | keyword |
| tags | List of keywords used to tag each event. | keyword |
| user.email | User email address. | keyword |
| user.full_name | User's full name, if available. | keyword |
| user.full_name.text | Multi-field of user.full_name. |
match_only_text |
| user.id | Unique identifier of the user. | keyword |
| user.name | Short name or login of the user. | keyword |
| user.name.text | Multi-field of user.name. |
match_only_text |
This integration includes one or more Kibana dashboards that visualizes the data collected by the integration. The screenshots below illustrate how the ingested data is displayed.
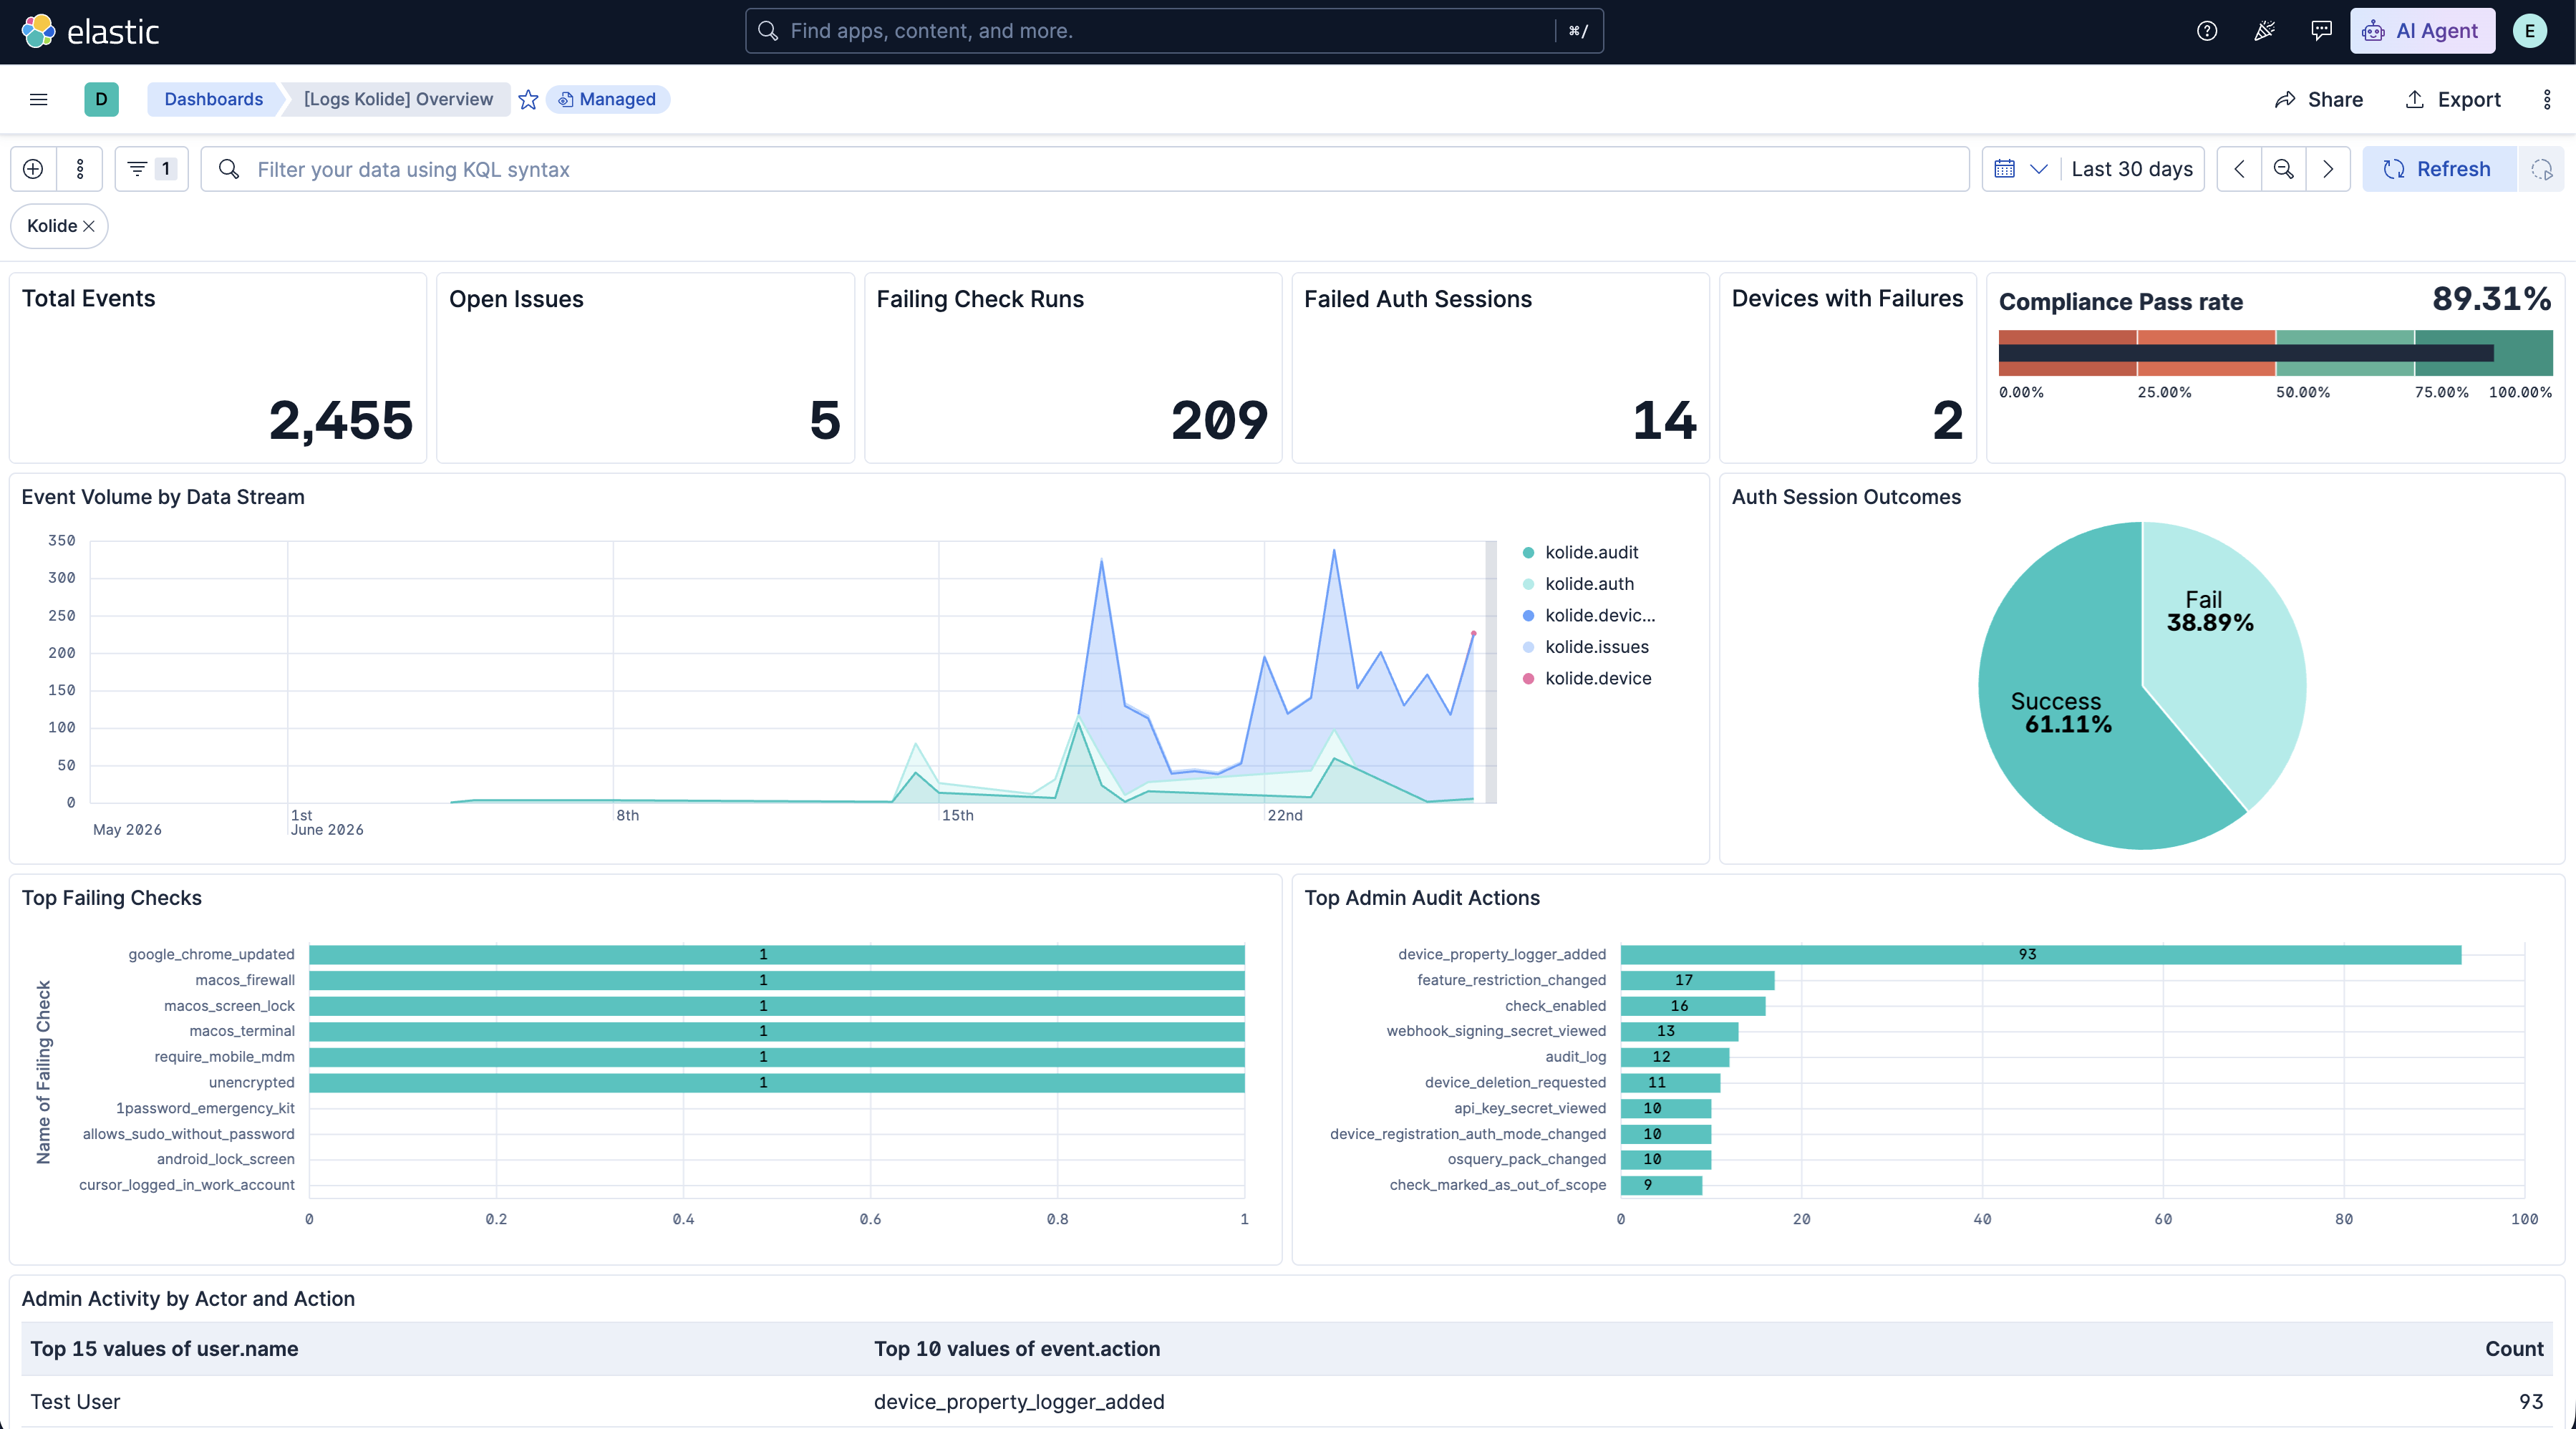
Changelog
| Version | Details | Minimum Kibana version |
|---|---|---|
| 0.4.0 | Enhancement (View pull request) Convert the latest device and people transform destination indices to lookup indices and bump their destination index versions. |
9.1.0 8.19.0 |
| 0.3.0 | Enhancement (View pull request) Add latest_device and latest_people transforms, which maintain a current-state index of every Kolide device and person. Enhancement (View pull request) Add labels.is_transform_source to the device and people data streams, so transform source documents can be distinguished from transform output. |
9.1.0 8.19.0 |
| 0.2.1 | Bug fix (View pull request) Remove empty ILM policies section from the README. |
9.1.0 8.19.0 |
| 0.2.0 | Enhancement (View pull request) Add GCS input support, new deprovisioned_person, osquery_status, osquery_result, people, and request data streams, and webhook routing updates. Bug fix (View pull request) Fix fetching events based on resolved_at, blocked and blocks_device_at fields in the issues pipeline. Update deduplication logic and @timestamp derivation. |
9.1.0 8.19.0 |
| 0.1.2 | Bug fix (View pull request) Standardize HTTP Endpoint capitalization in README file |
9.1.0 8.19.0 |
| 0.1.1 | Bug fix (View pull request) Fix the cursor handling for the audit, auth and issues data streams. |
9.1.0 8.19.0 |
| 0.1.0 | Enhancement (View pull request) Initial release of the Kolide integration. |
9.1.0 8.19.0 |